Pacific SST Monitoring
  • Northeast Pacific SST and MHWs
  • Buoy temperatures

On this page

  • Canadian Pacific Exclusive Economic Zone buoy temperatures
    • ECCC buoy data
    • Latest week of data
  • Northeast Pacific buoy temperatures
    • NDBC buoy data
    • Latest week of data

Buoy temperature in the Canadian Pacific Exclusive Economic Zone and Northeast Pacific

Authors

Andrea Hilborn

Charles Hannah

Published

October 21, 2026

When using sea surface temperature datasets to monitor marine heatwaves (MHWs), it is important to compare them to other data sources. Here, we assembled temperatures measured by buoys located in the Canadian Pacific EEZ, as well as further throughout the Northeast Pacific (NEP).

Canadian Pacific Exclusive Economic Zone buoy temperatures

ECCC buoy data

  • Dataset: Realtime data from Environment and Climate Change Canada buoys
  • Data access: CIOOS Pacific ERDDAP DFO_MEDS_BUOYS and ECCC_MSC_BUOYS records. The DFO_MEDS_BUOYS record has a detailed quality control layer outlined in Kellogg et al. (2021) but ceased in December 2023
  • Climatology period: 1991–2020 (where available)
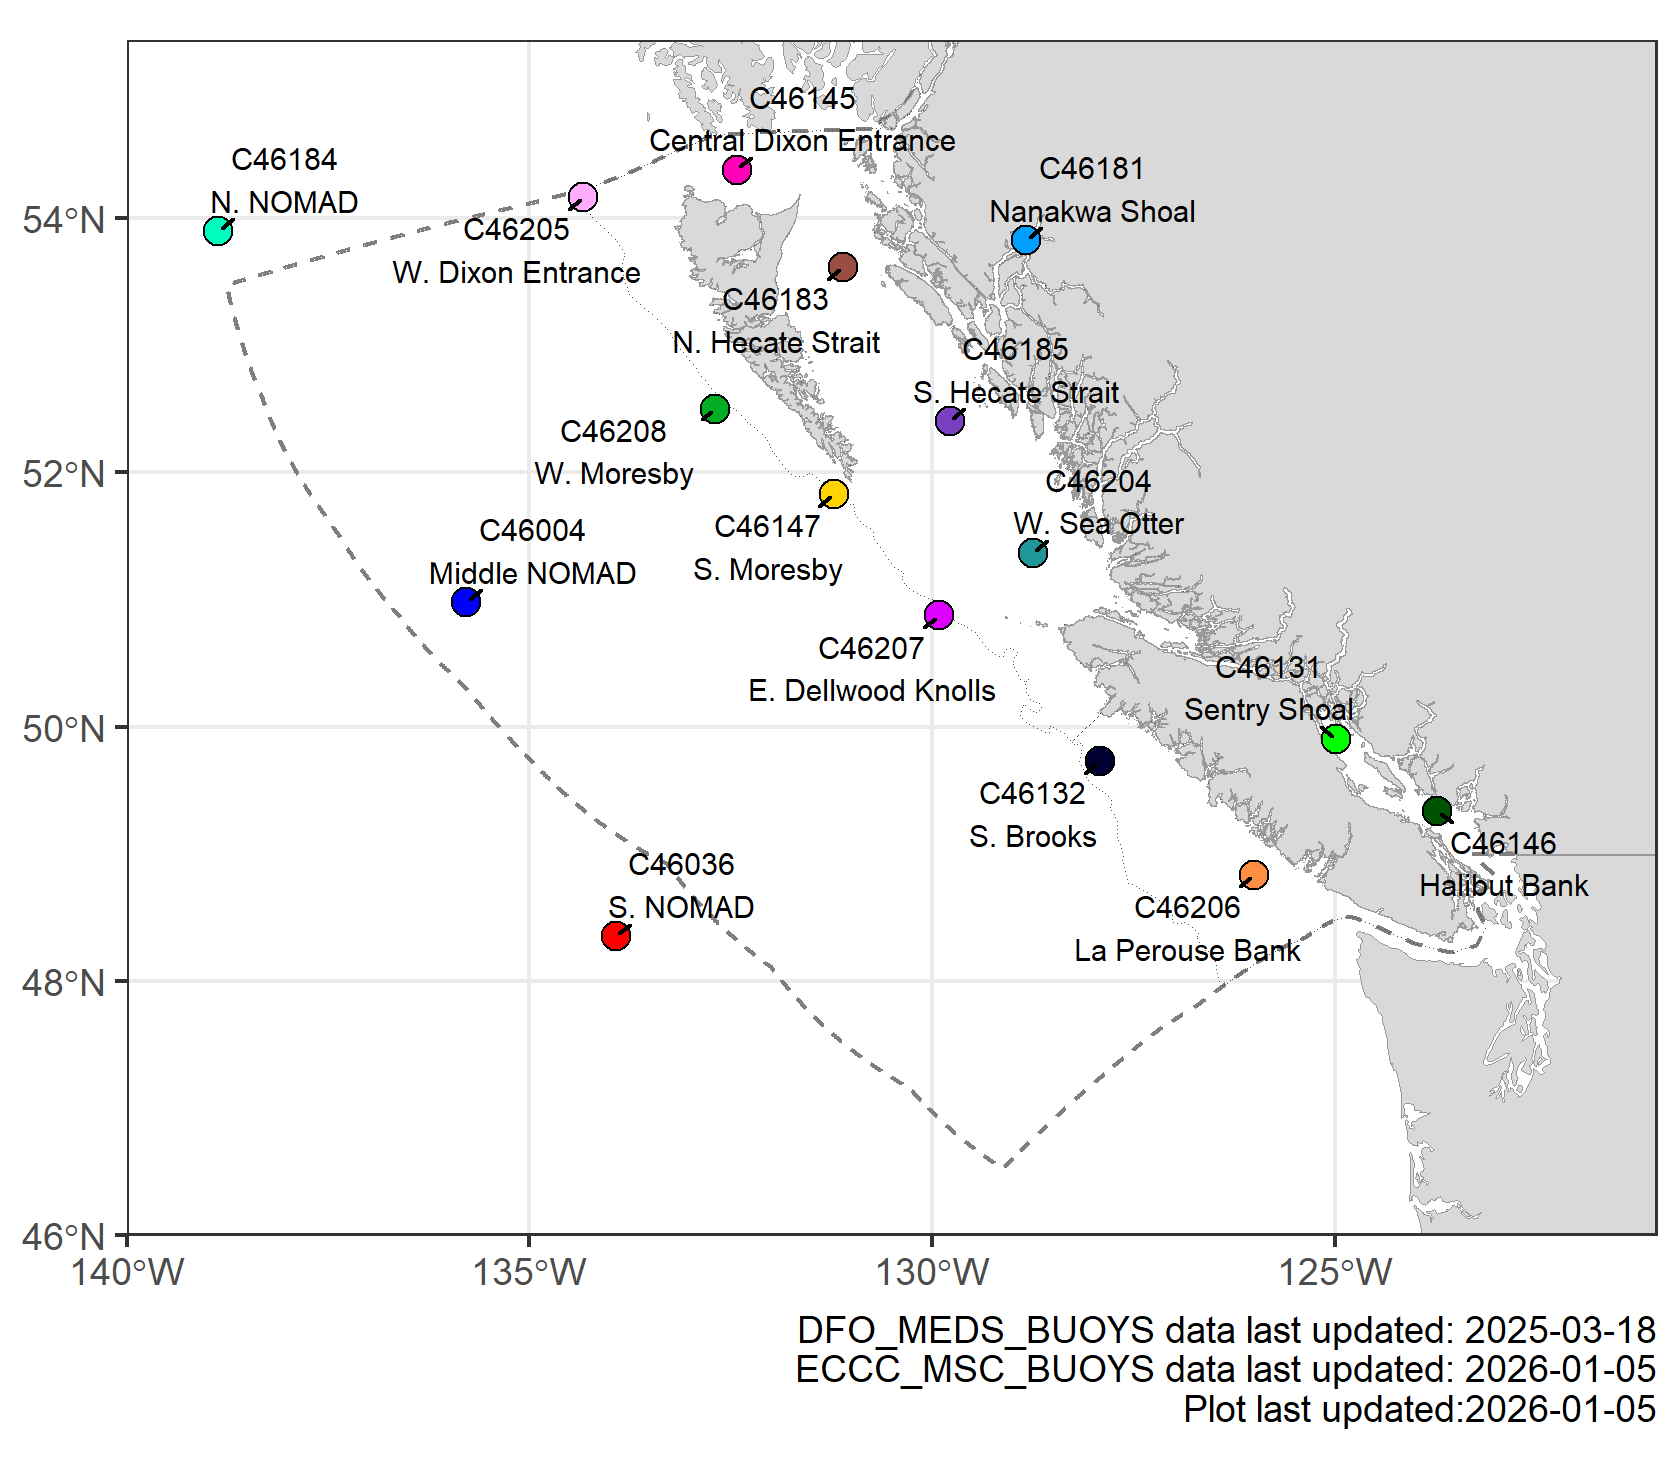
NoteClick here to view map of buoys

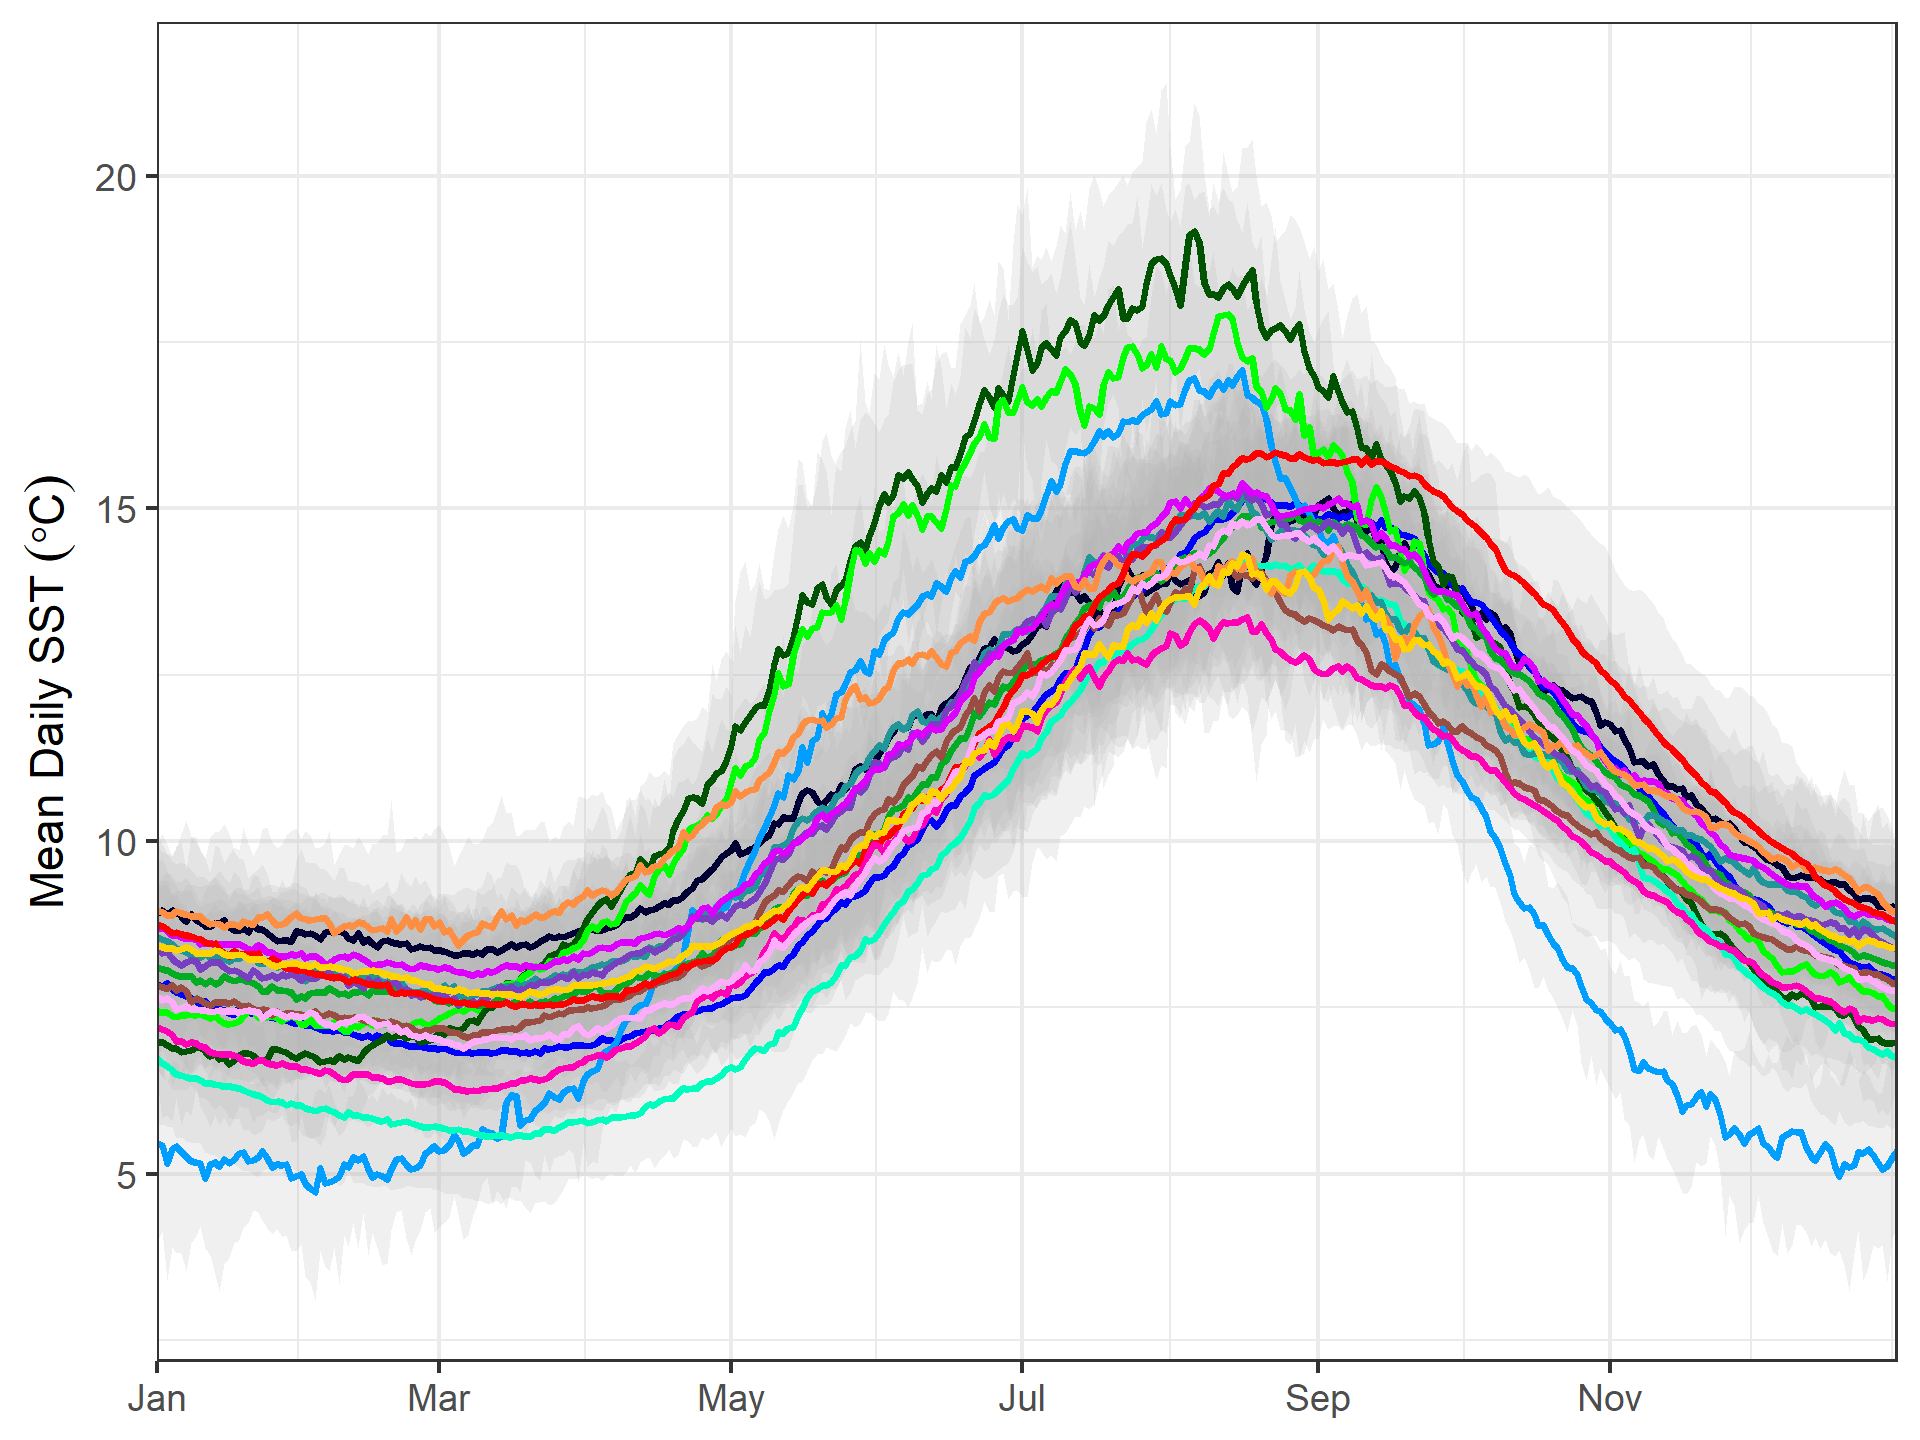
The Canadian Pacific EEZ is indicated with a dashed line, with grey outlines indicating BC Bioregion boundaries. The next plot shows the 1991-2020 temperature climatology (also referred to as the temperature baseline) of each buoy.

The Canadian Pacific EEZ is indicated with a dashed line, with grey outlines indicating BC Bioregion boundaries. The next plot shows the 1991-2020 temperature climatology (also referred to as the temperature baseline) of each buoy.
NoteClick here to view 1991-2020 buoy surface temperature climatologies

Latest week of data

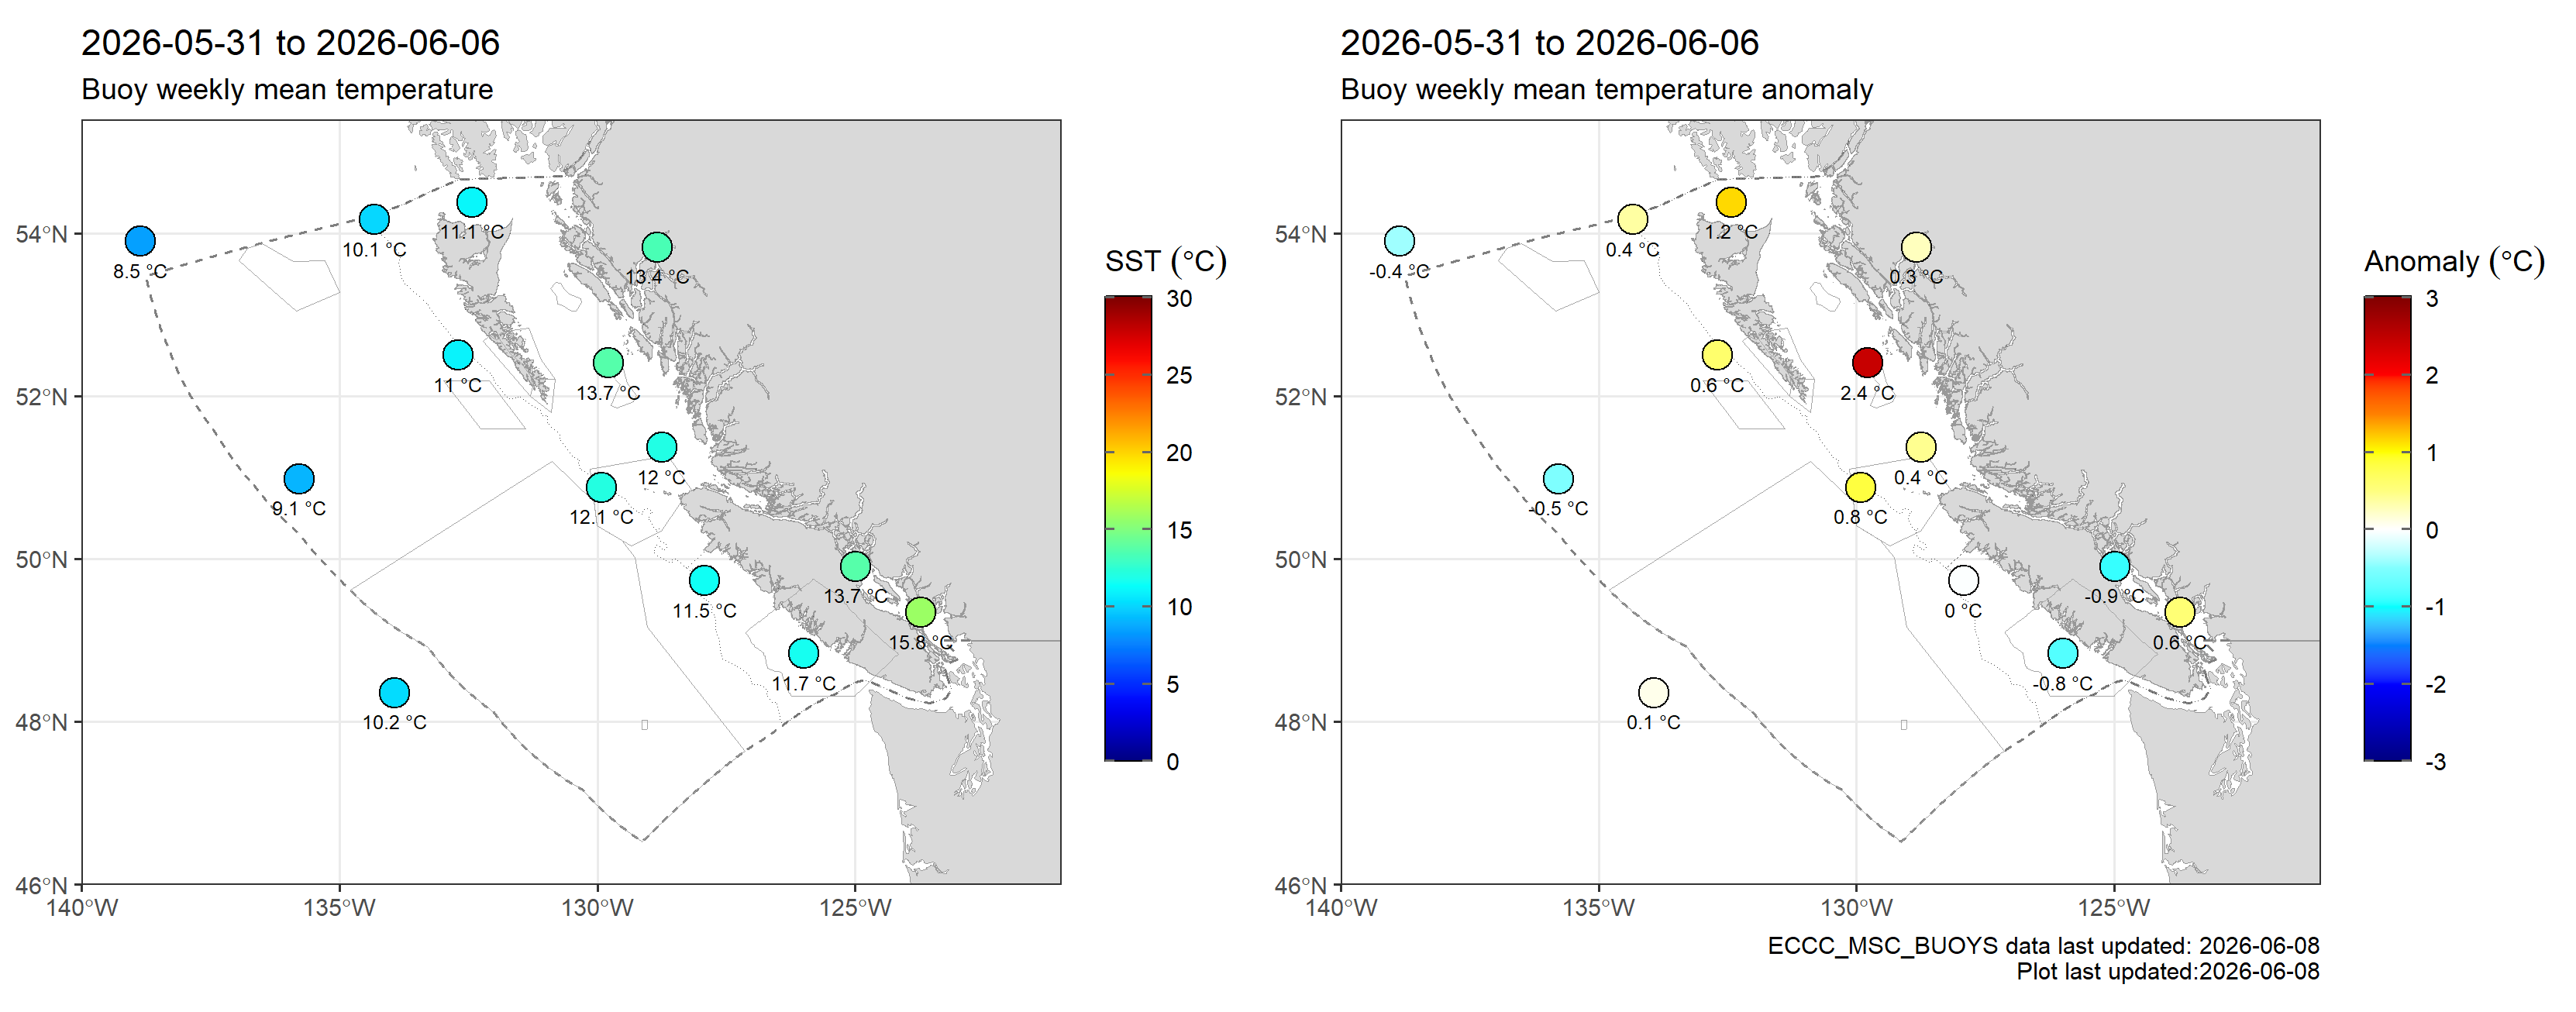
Coloured circles indicate the weekly SST and SST anomaly at buoy locations (see collapsed location map above), averaged weekly to correspond to the OISST maps on the previous page. The Canadian Pacific EEZ is indicated with a dashed line, with grey outlines indicating BC Bioregion boundaries.

Coloured circles indicate the weekly SST and SST anomaly at buoy locations (see collapsed location map above), averaged weekly to correspond to the OISST maps on the previous page. The Canadian Pacific EEZ is indicated with a dashed line, with grey outlines indicating BC Bioregion boundaries.
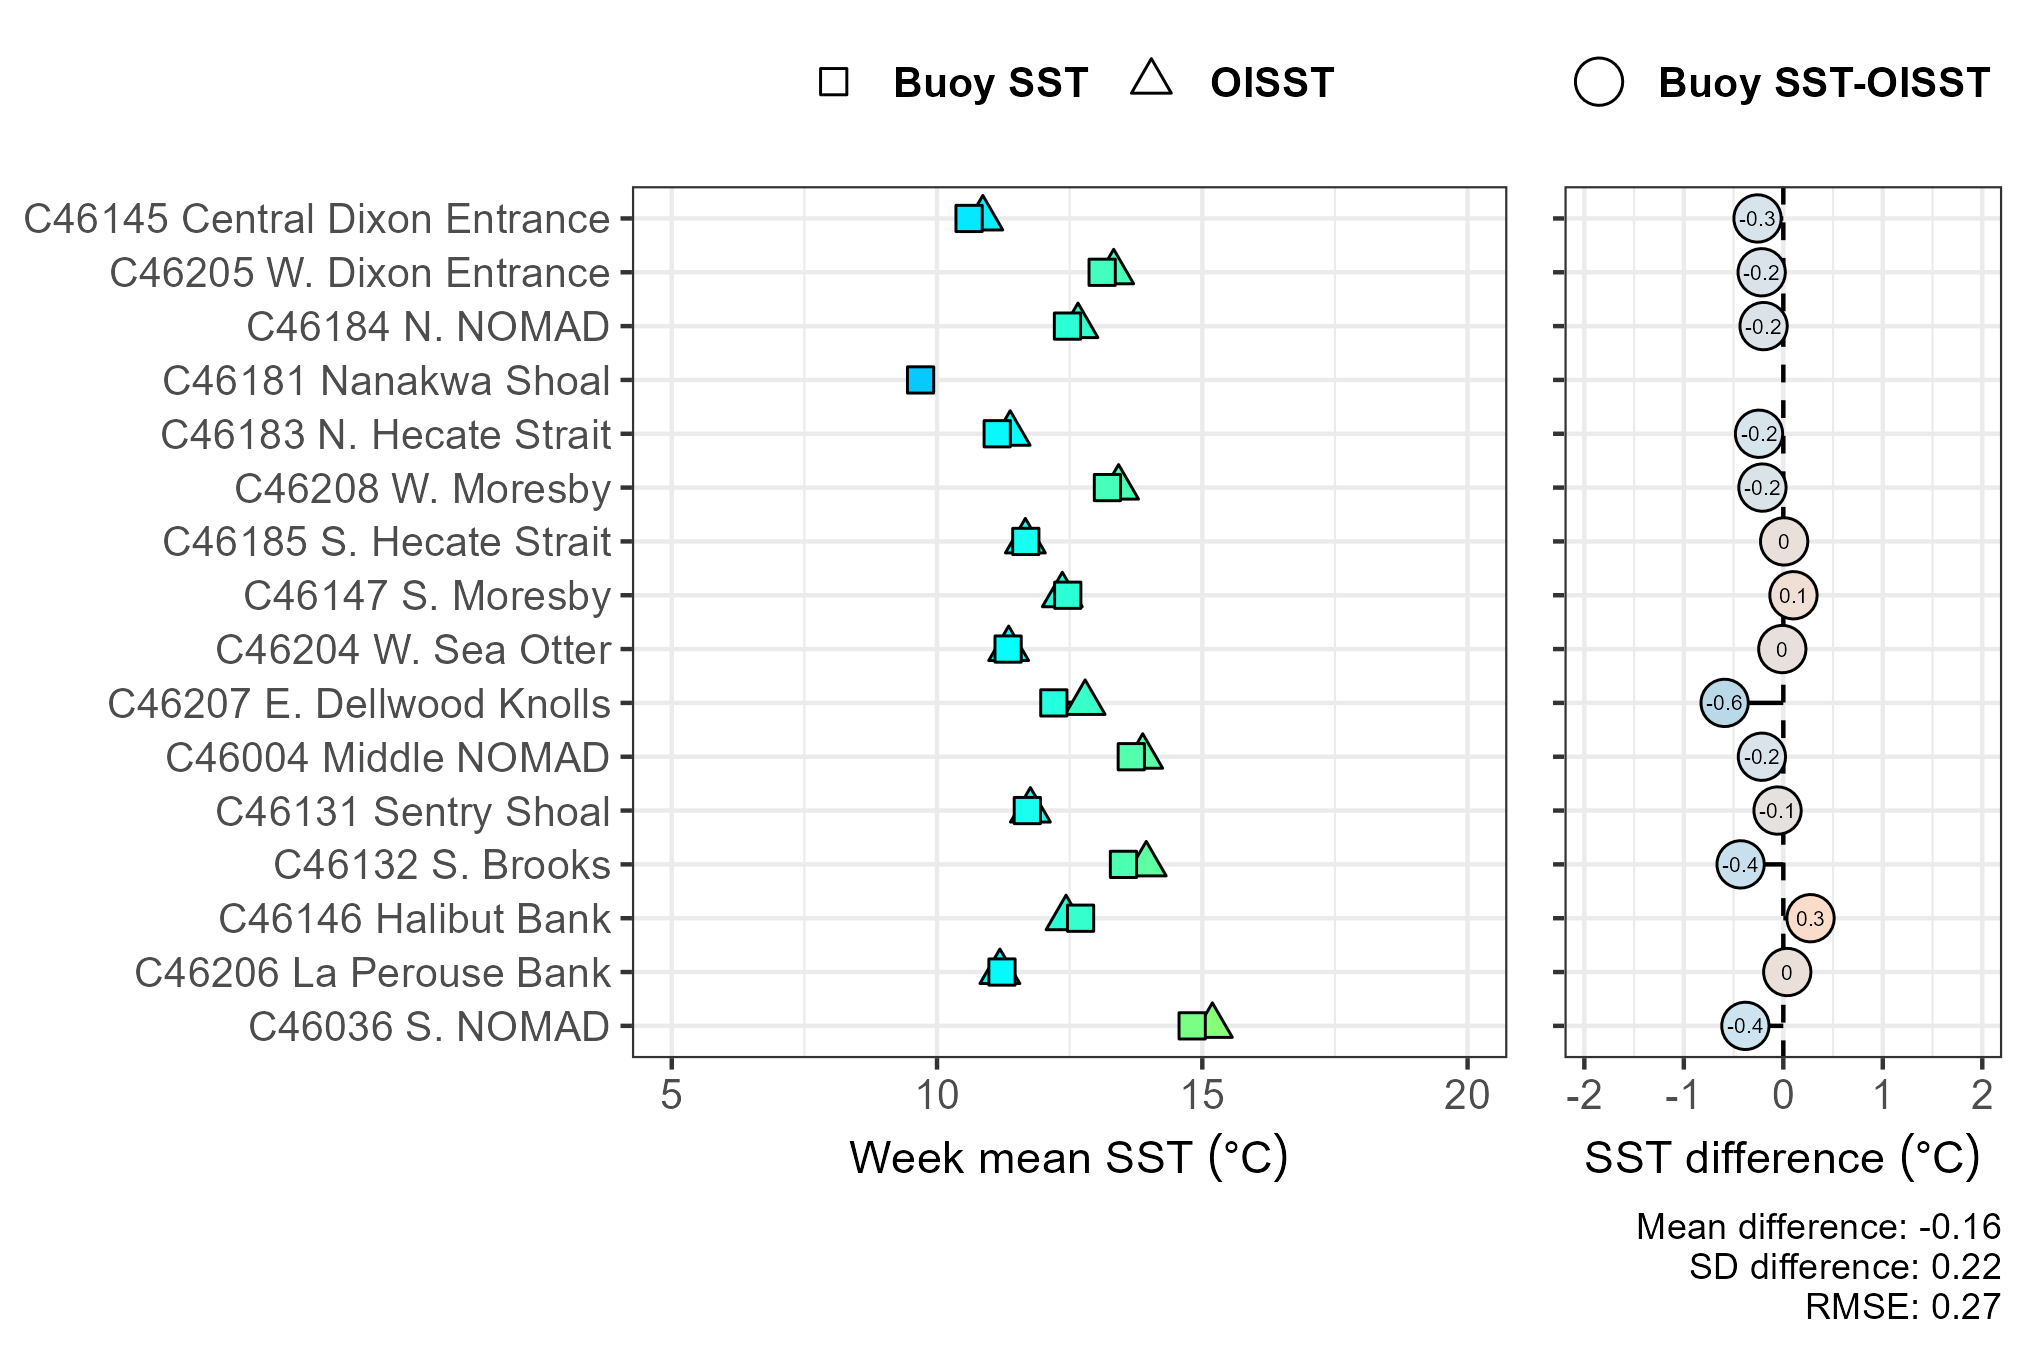
NoteOISST and buoy comparison

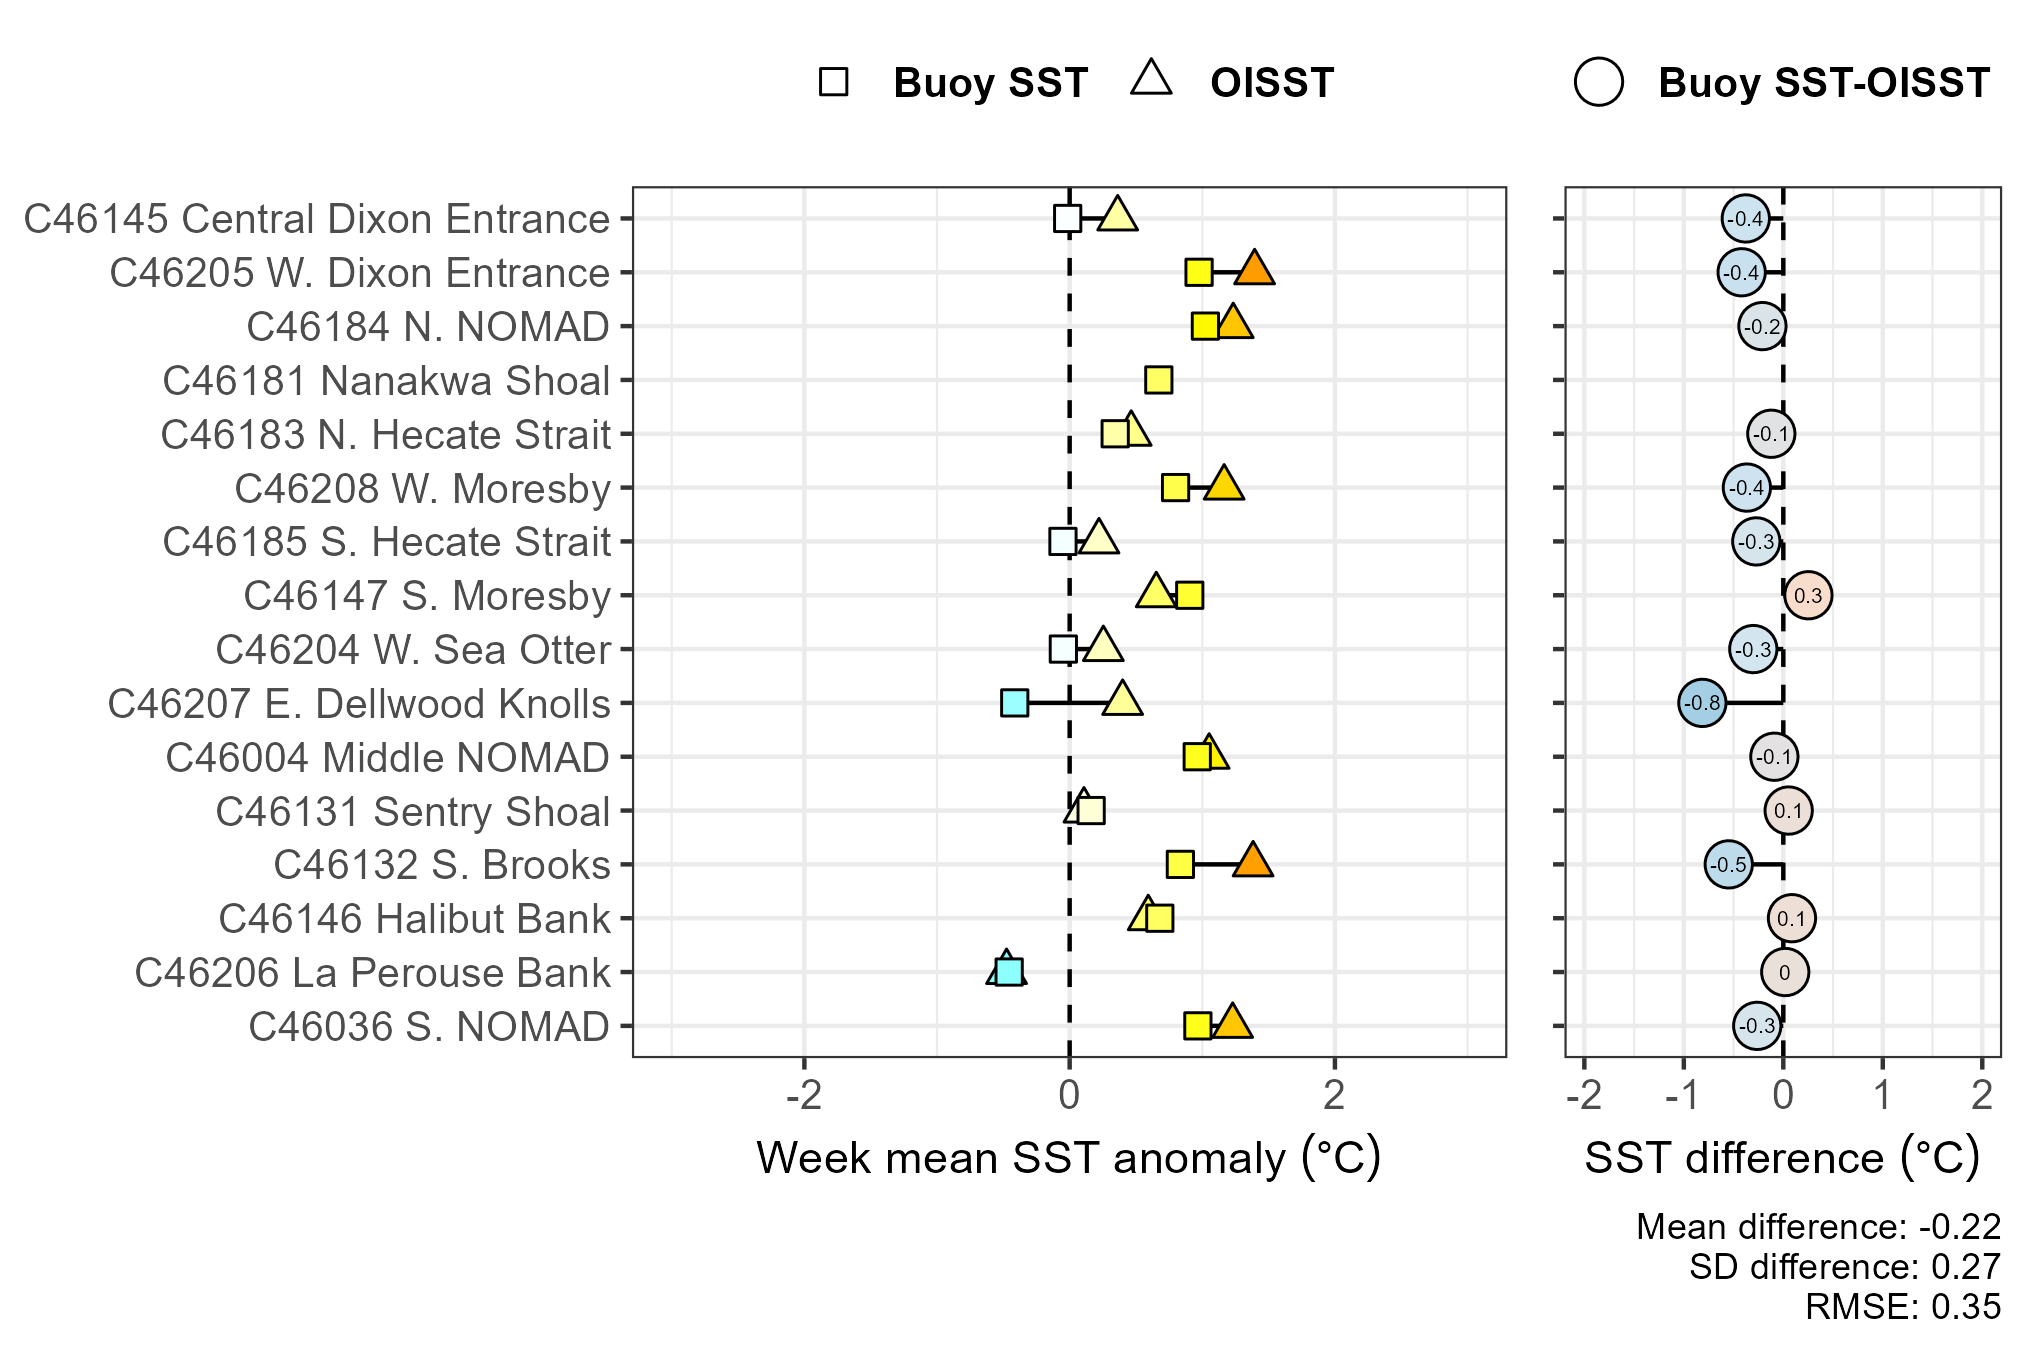
NoteOISST and buoy anomaly comparison

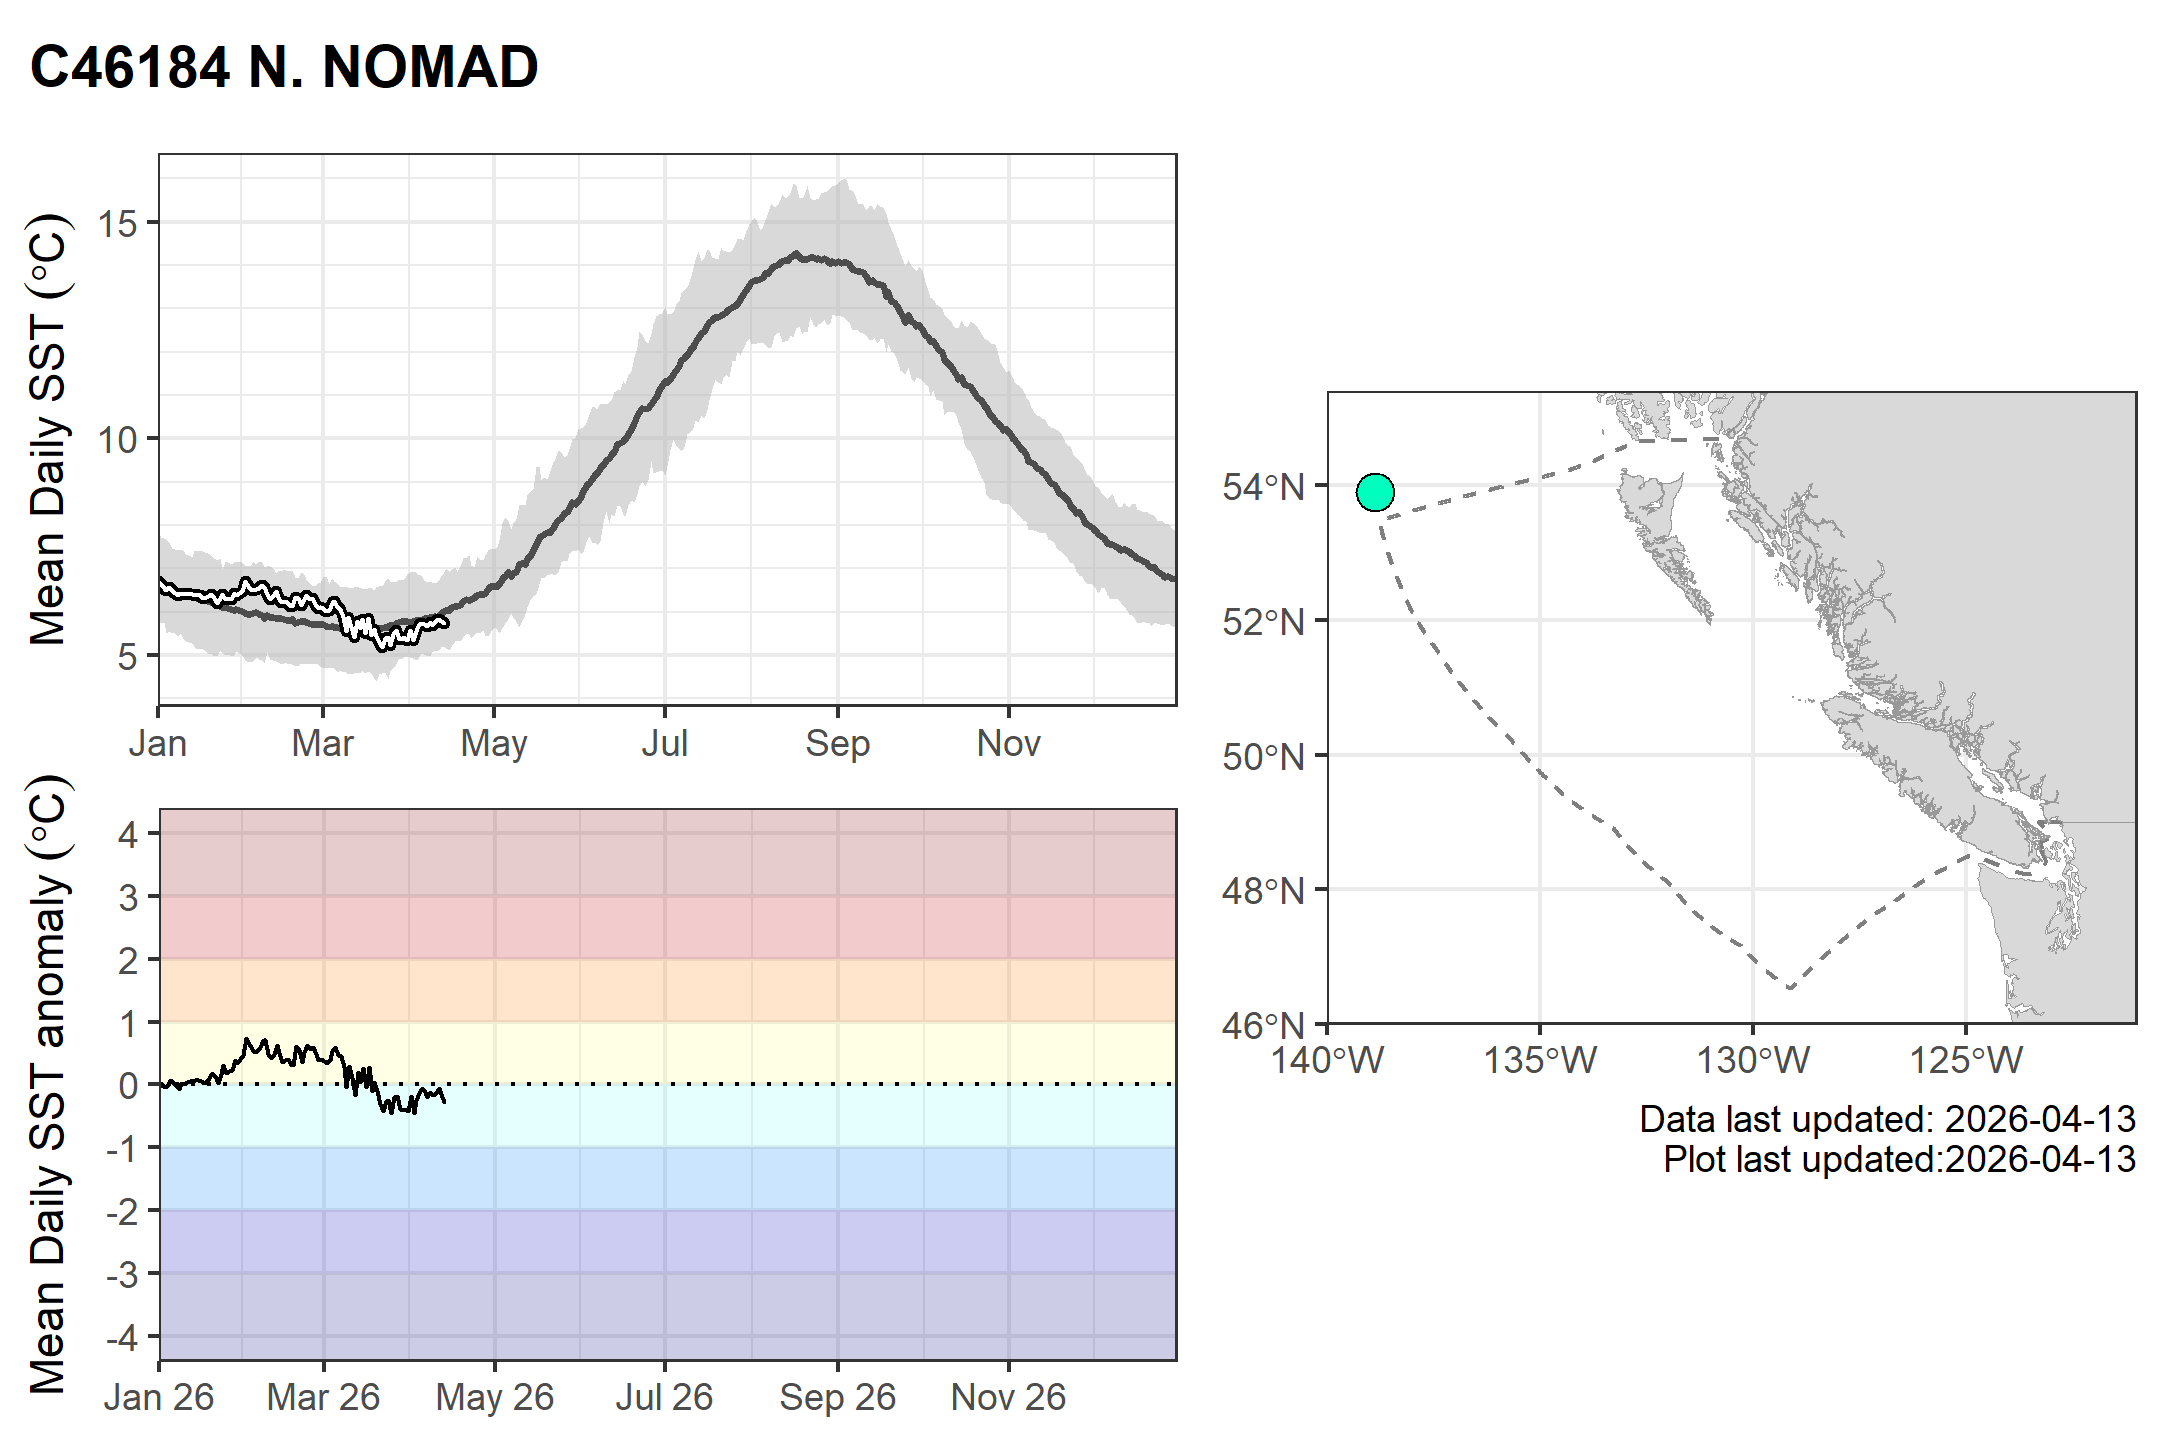
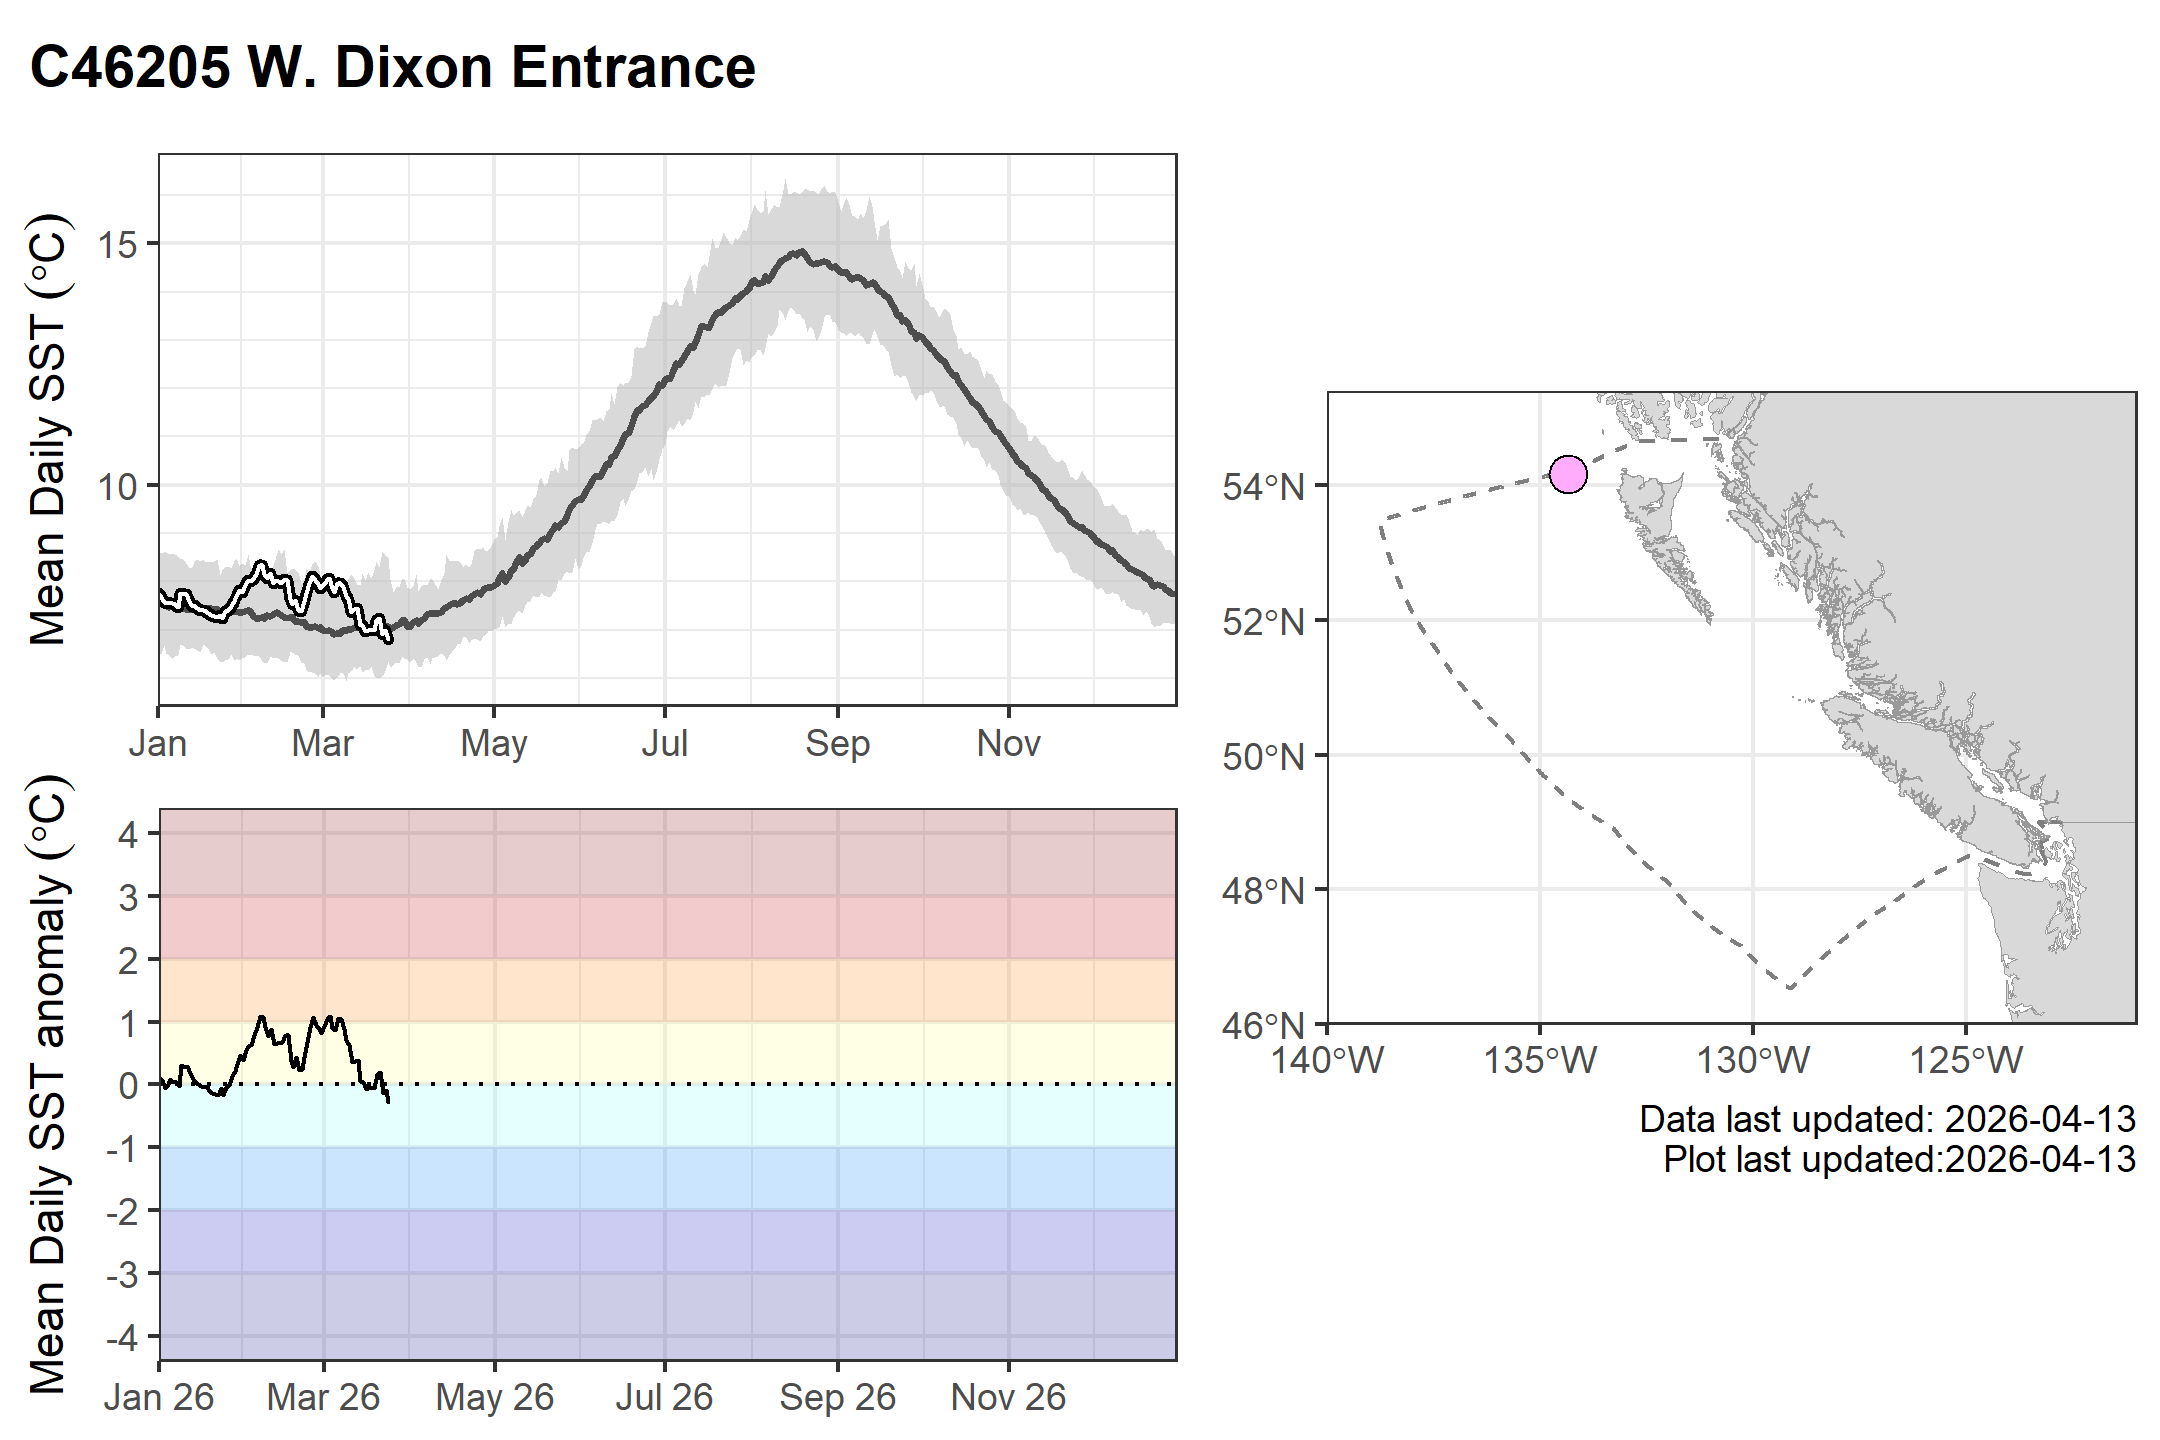
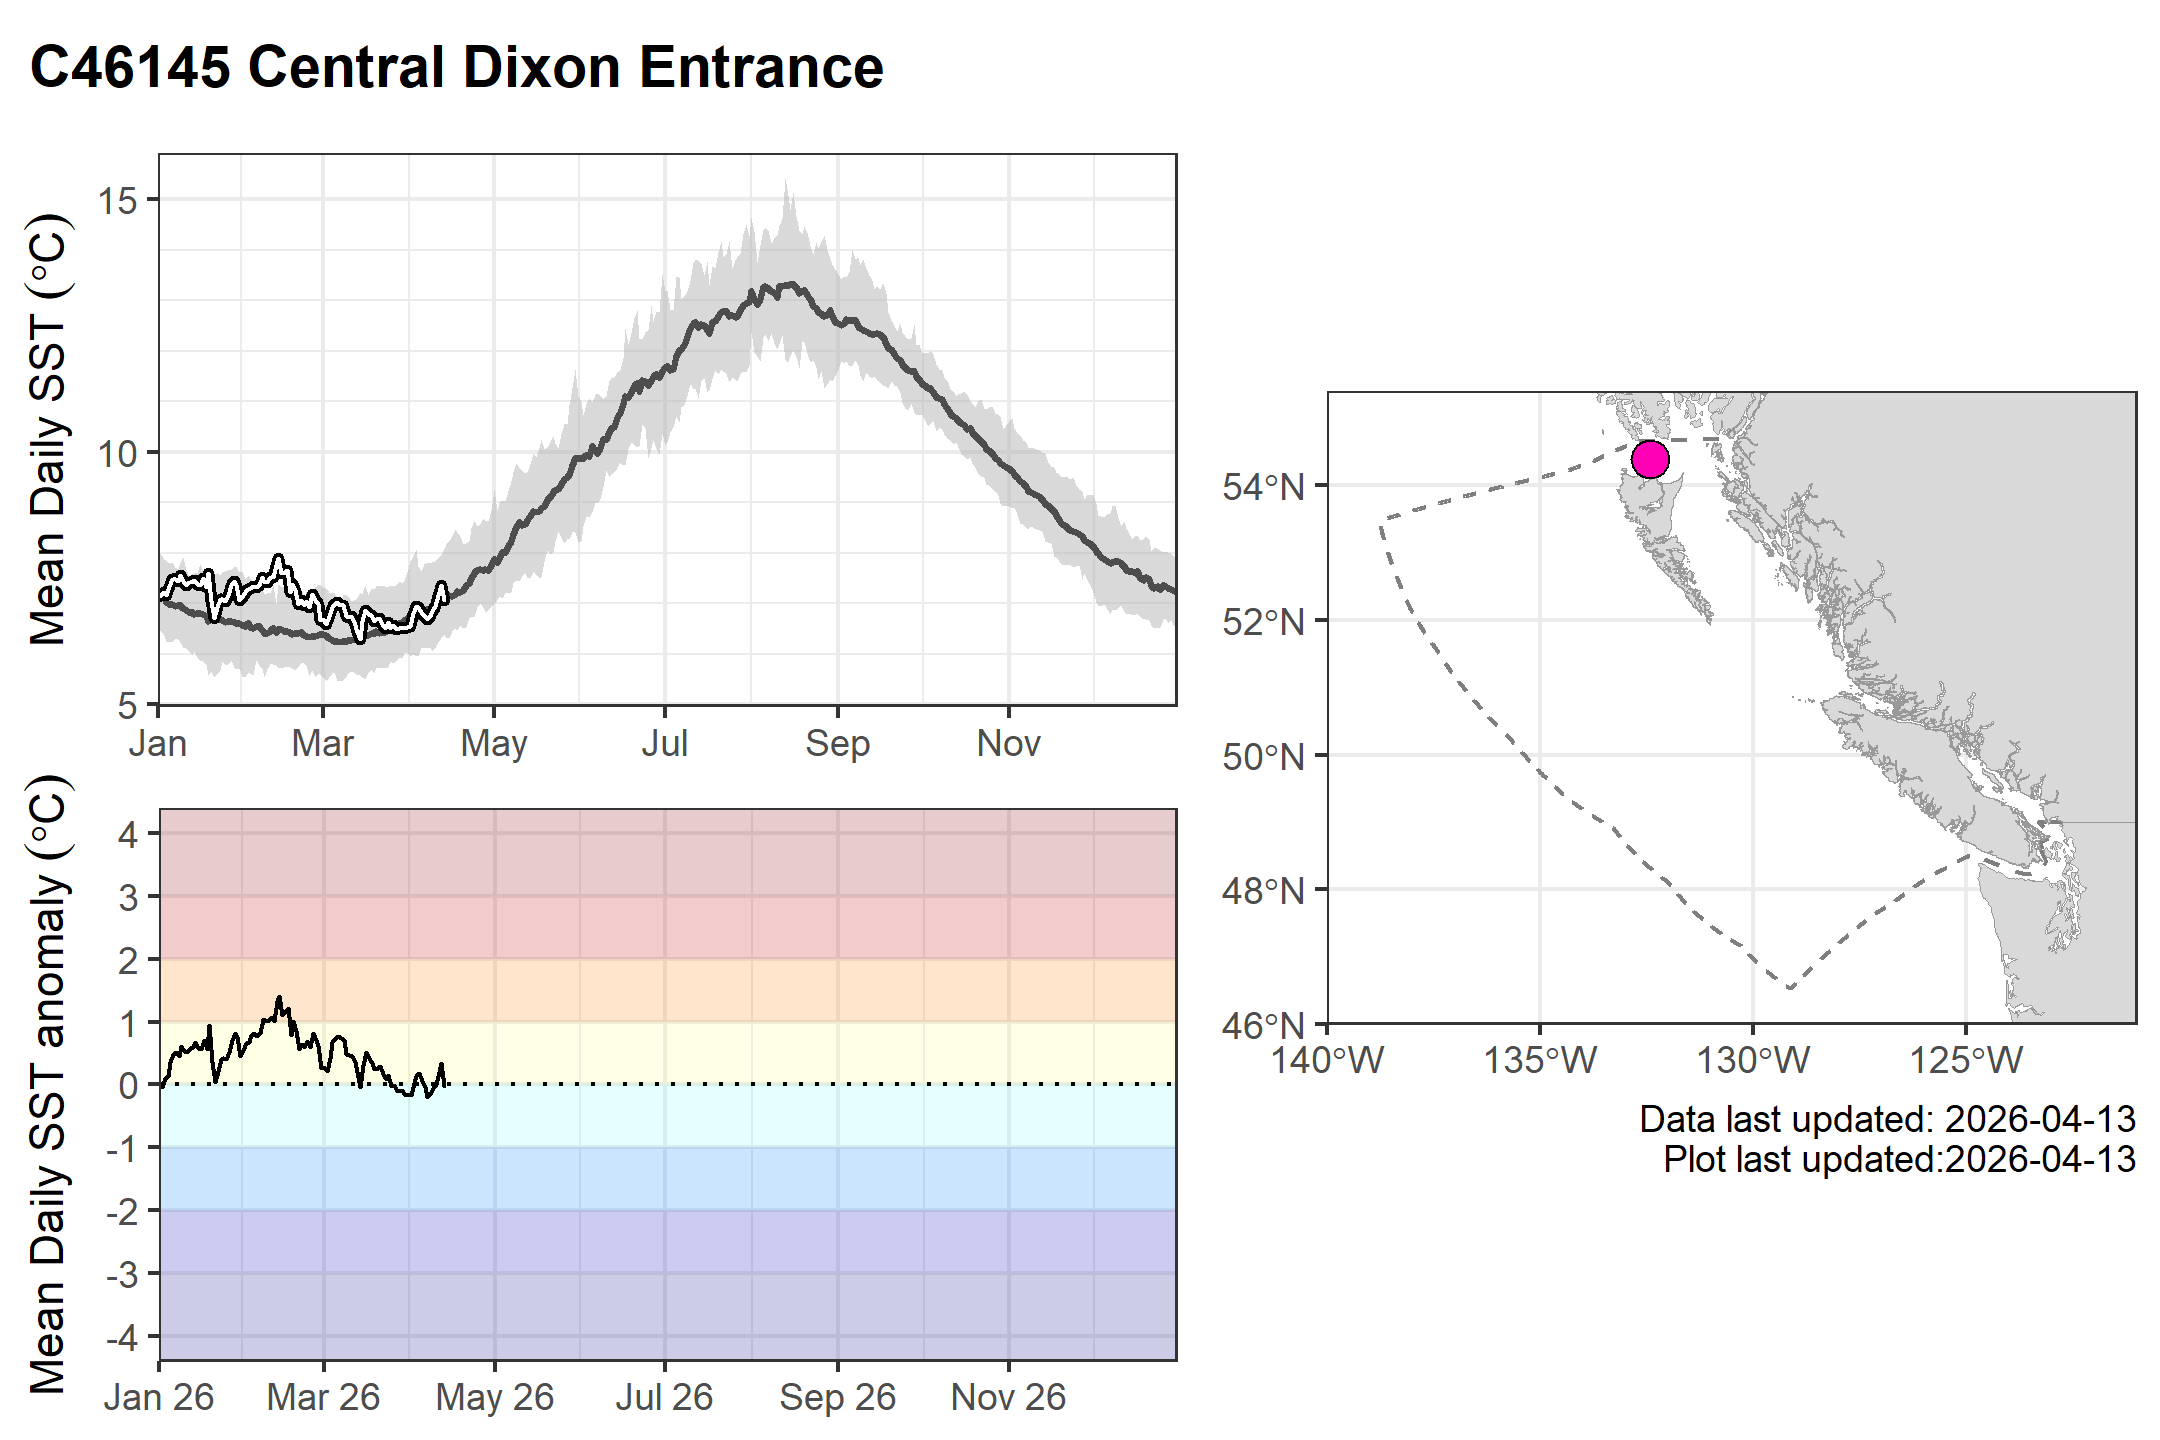
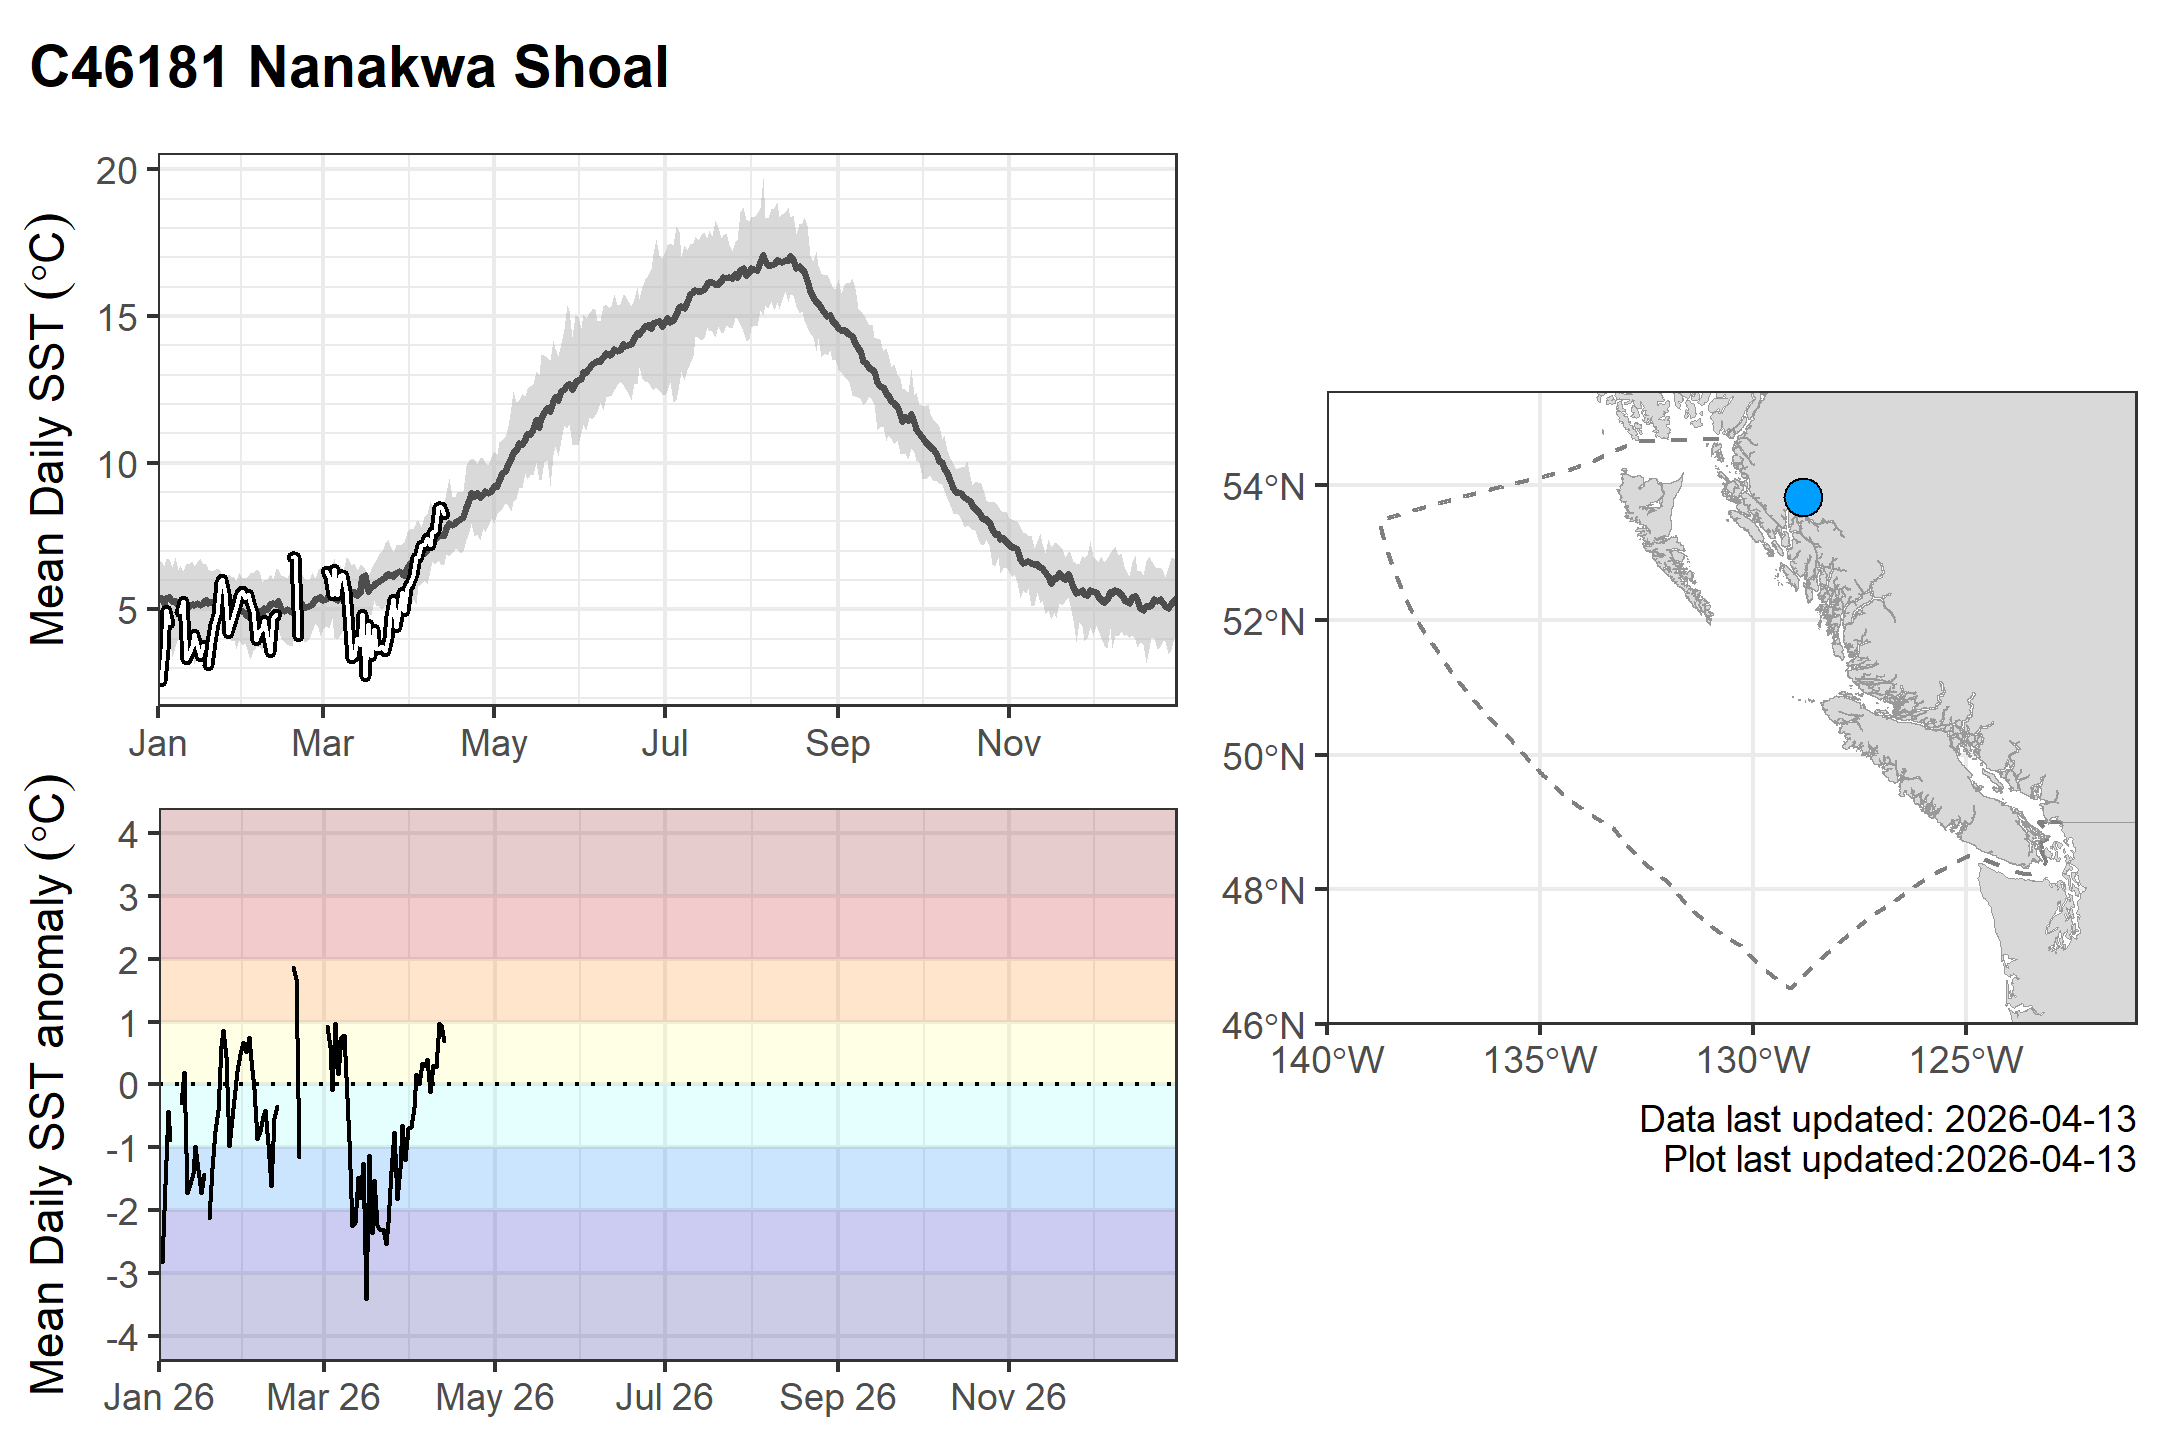
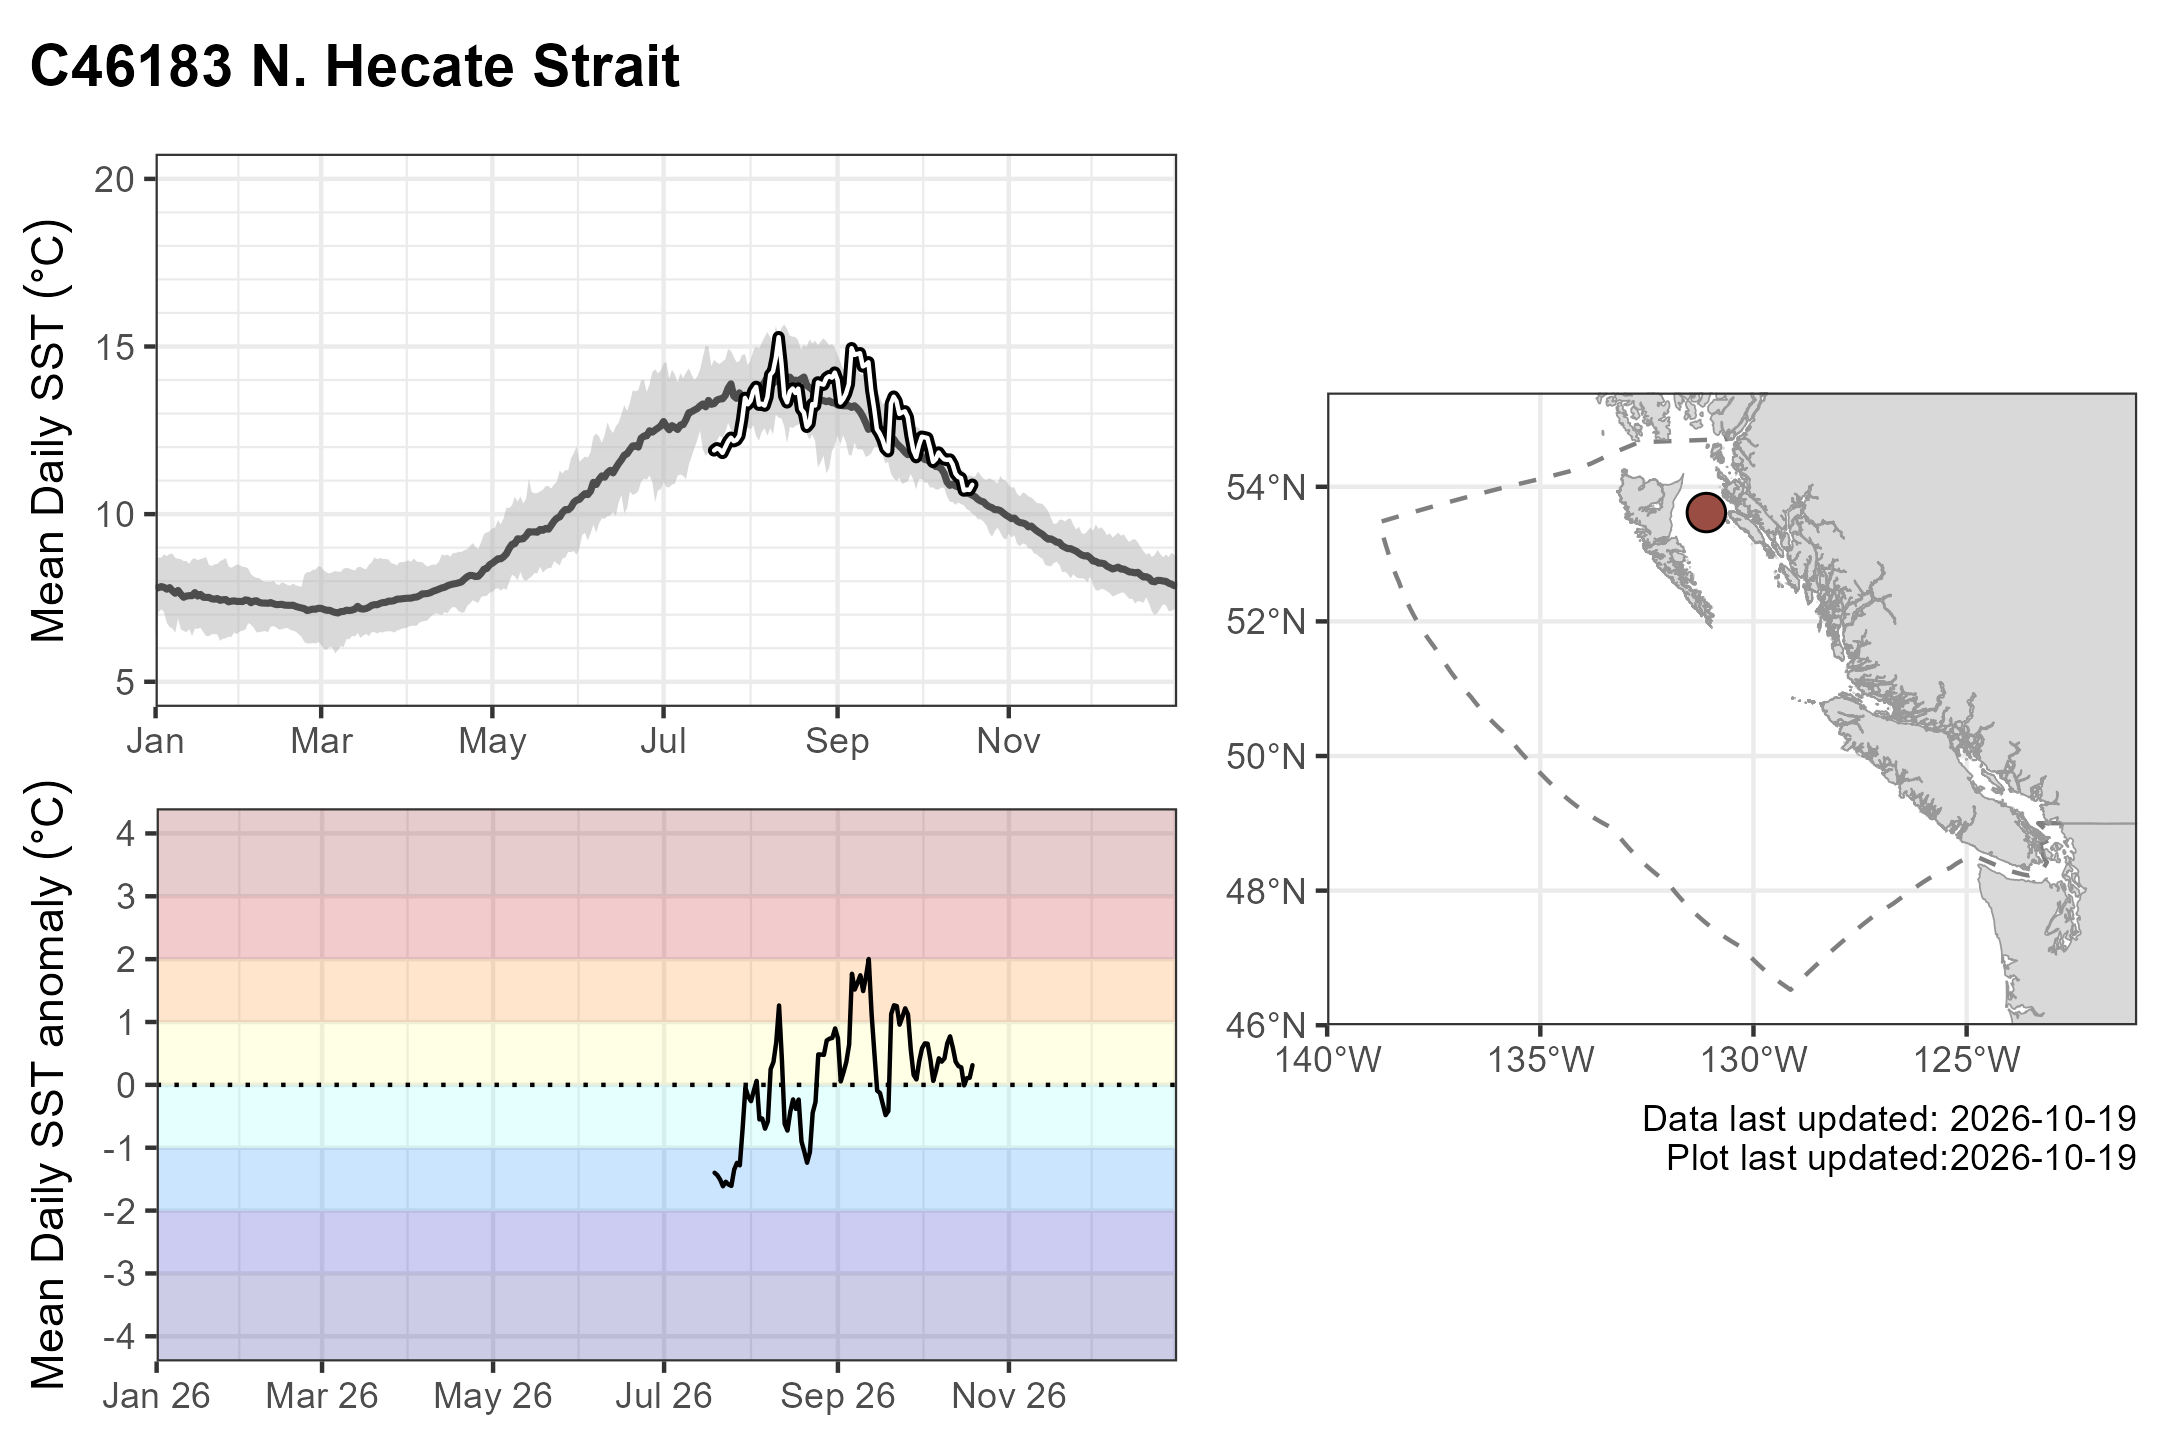
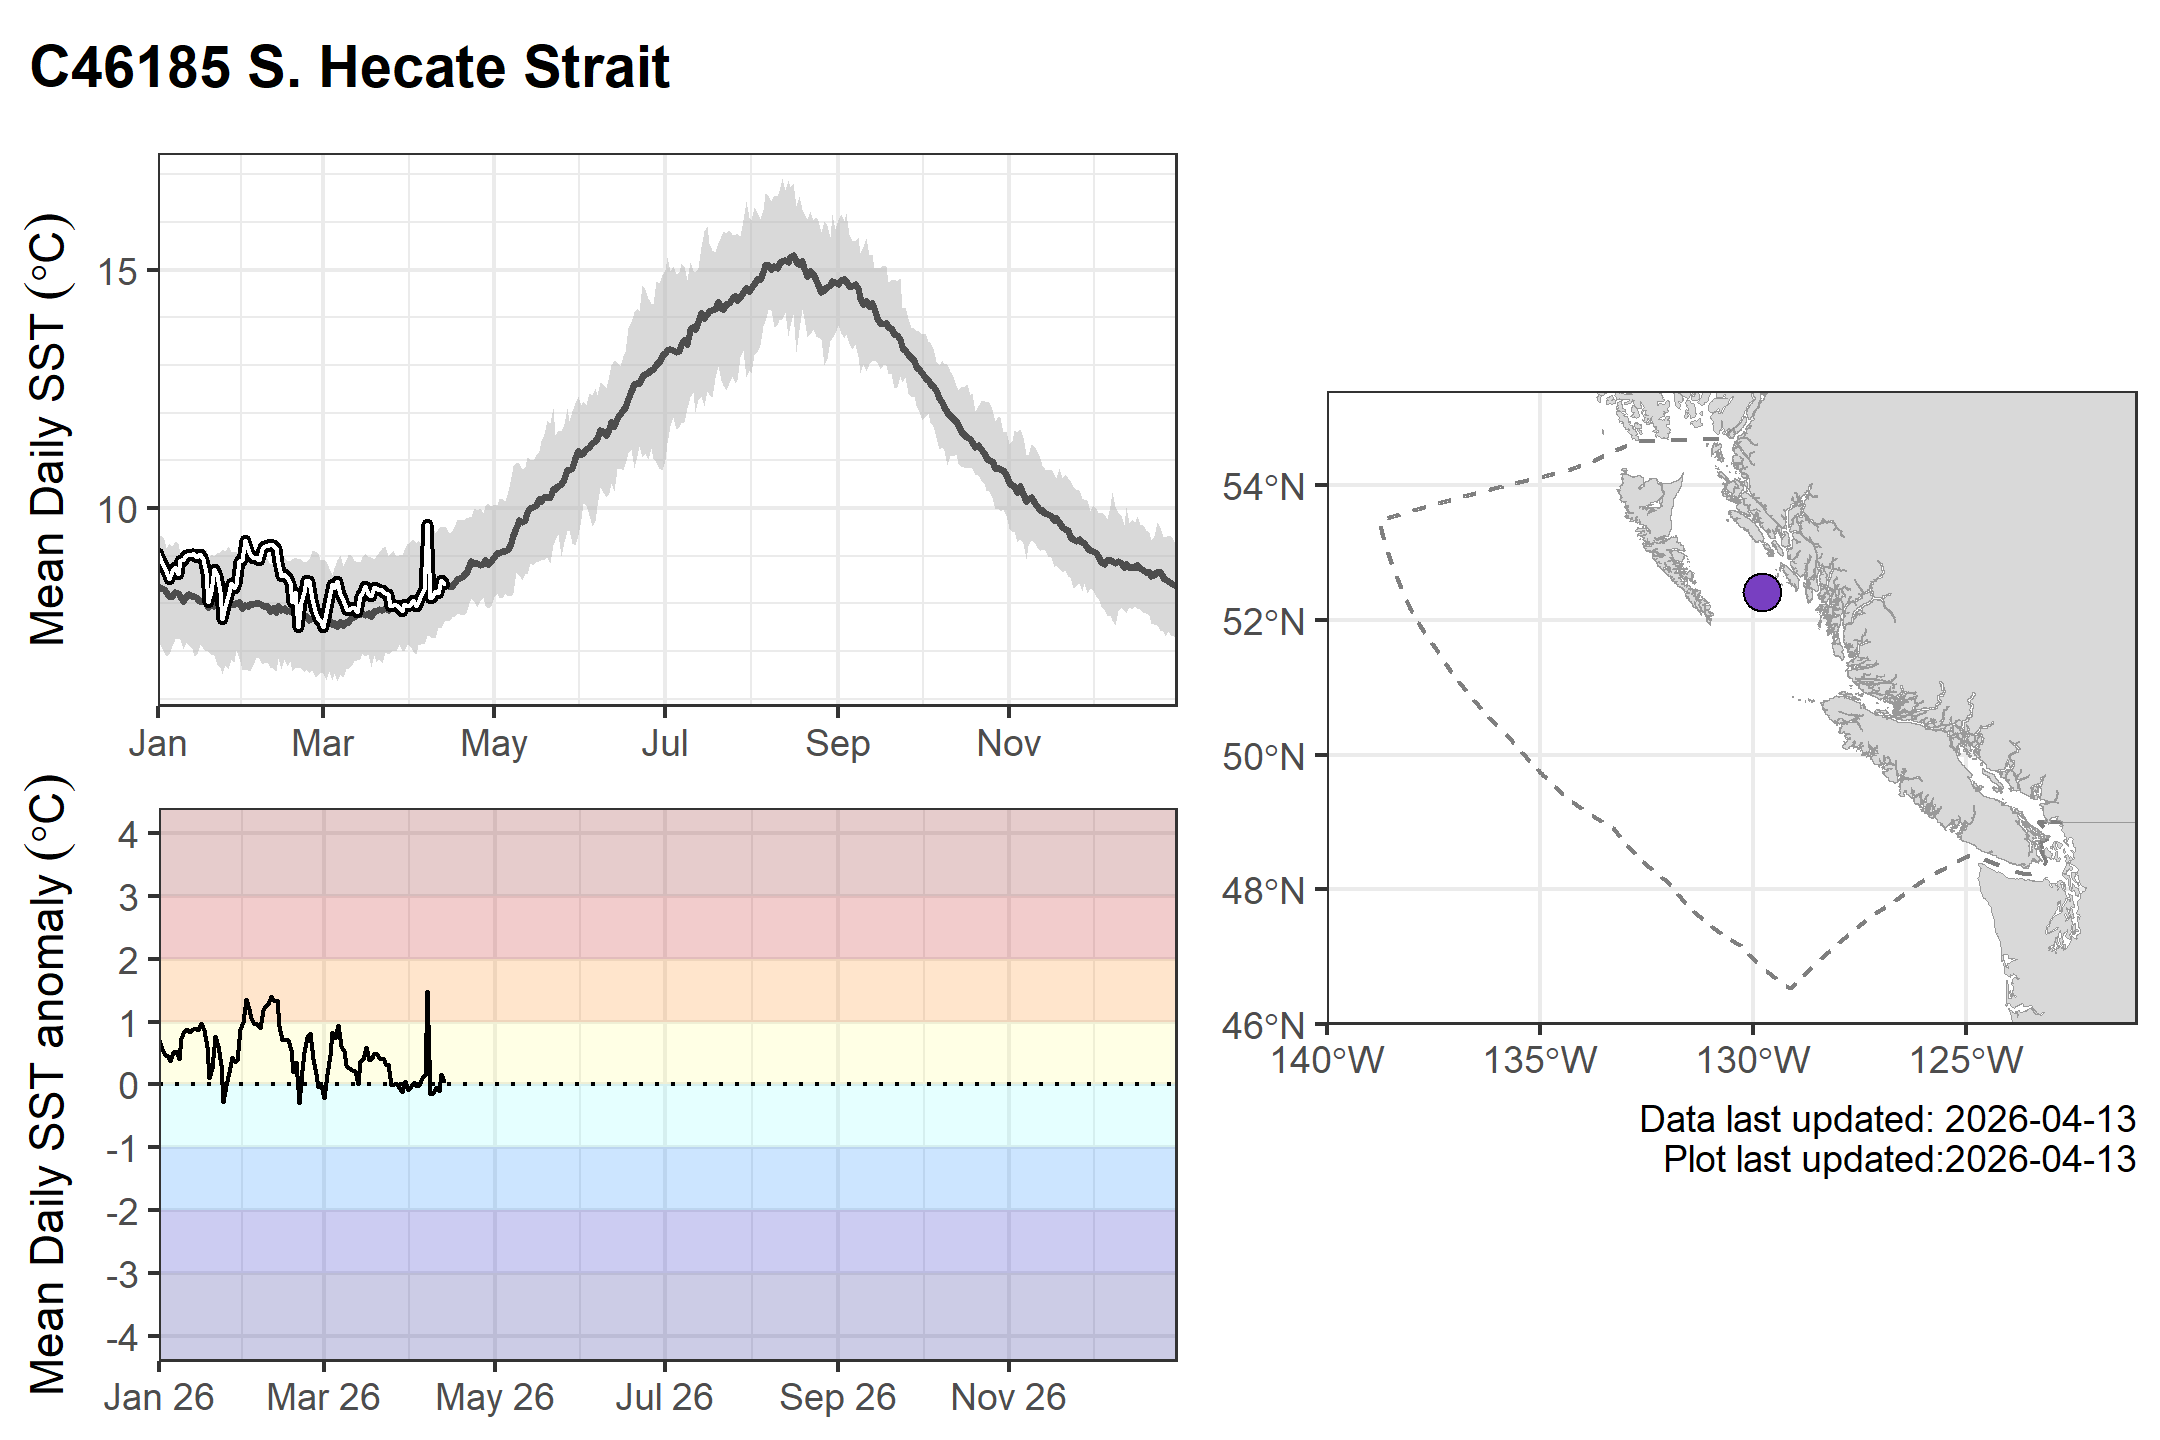
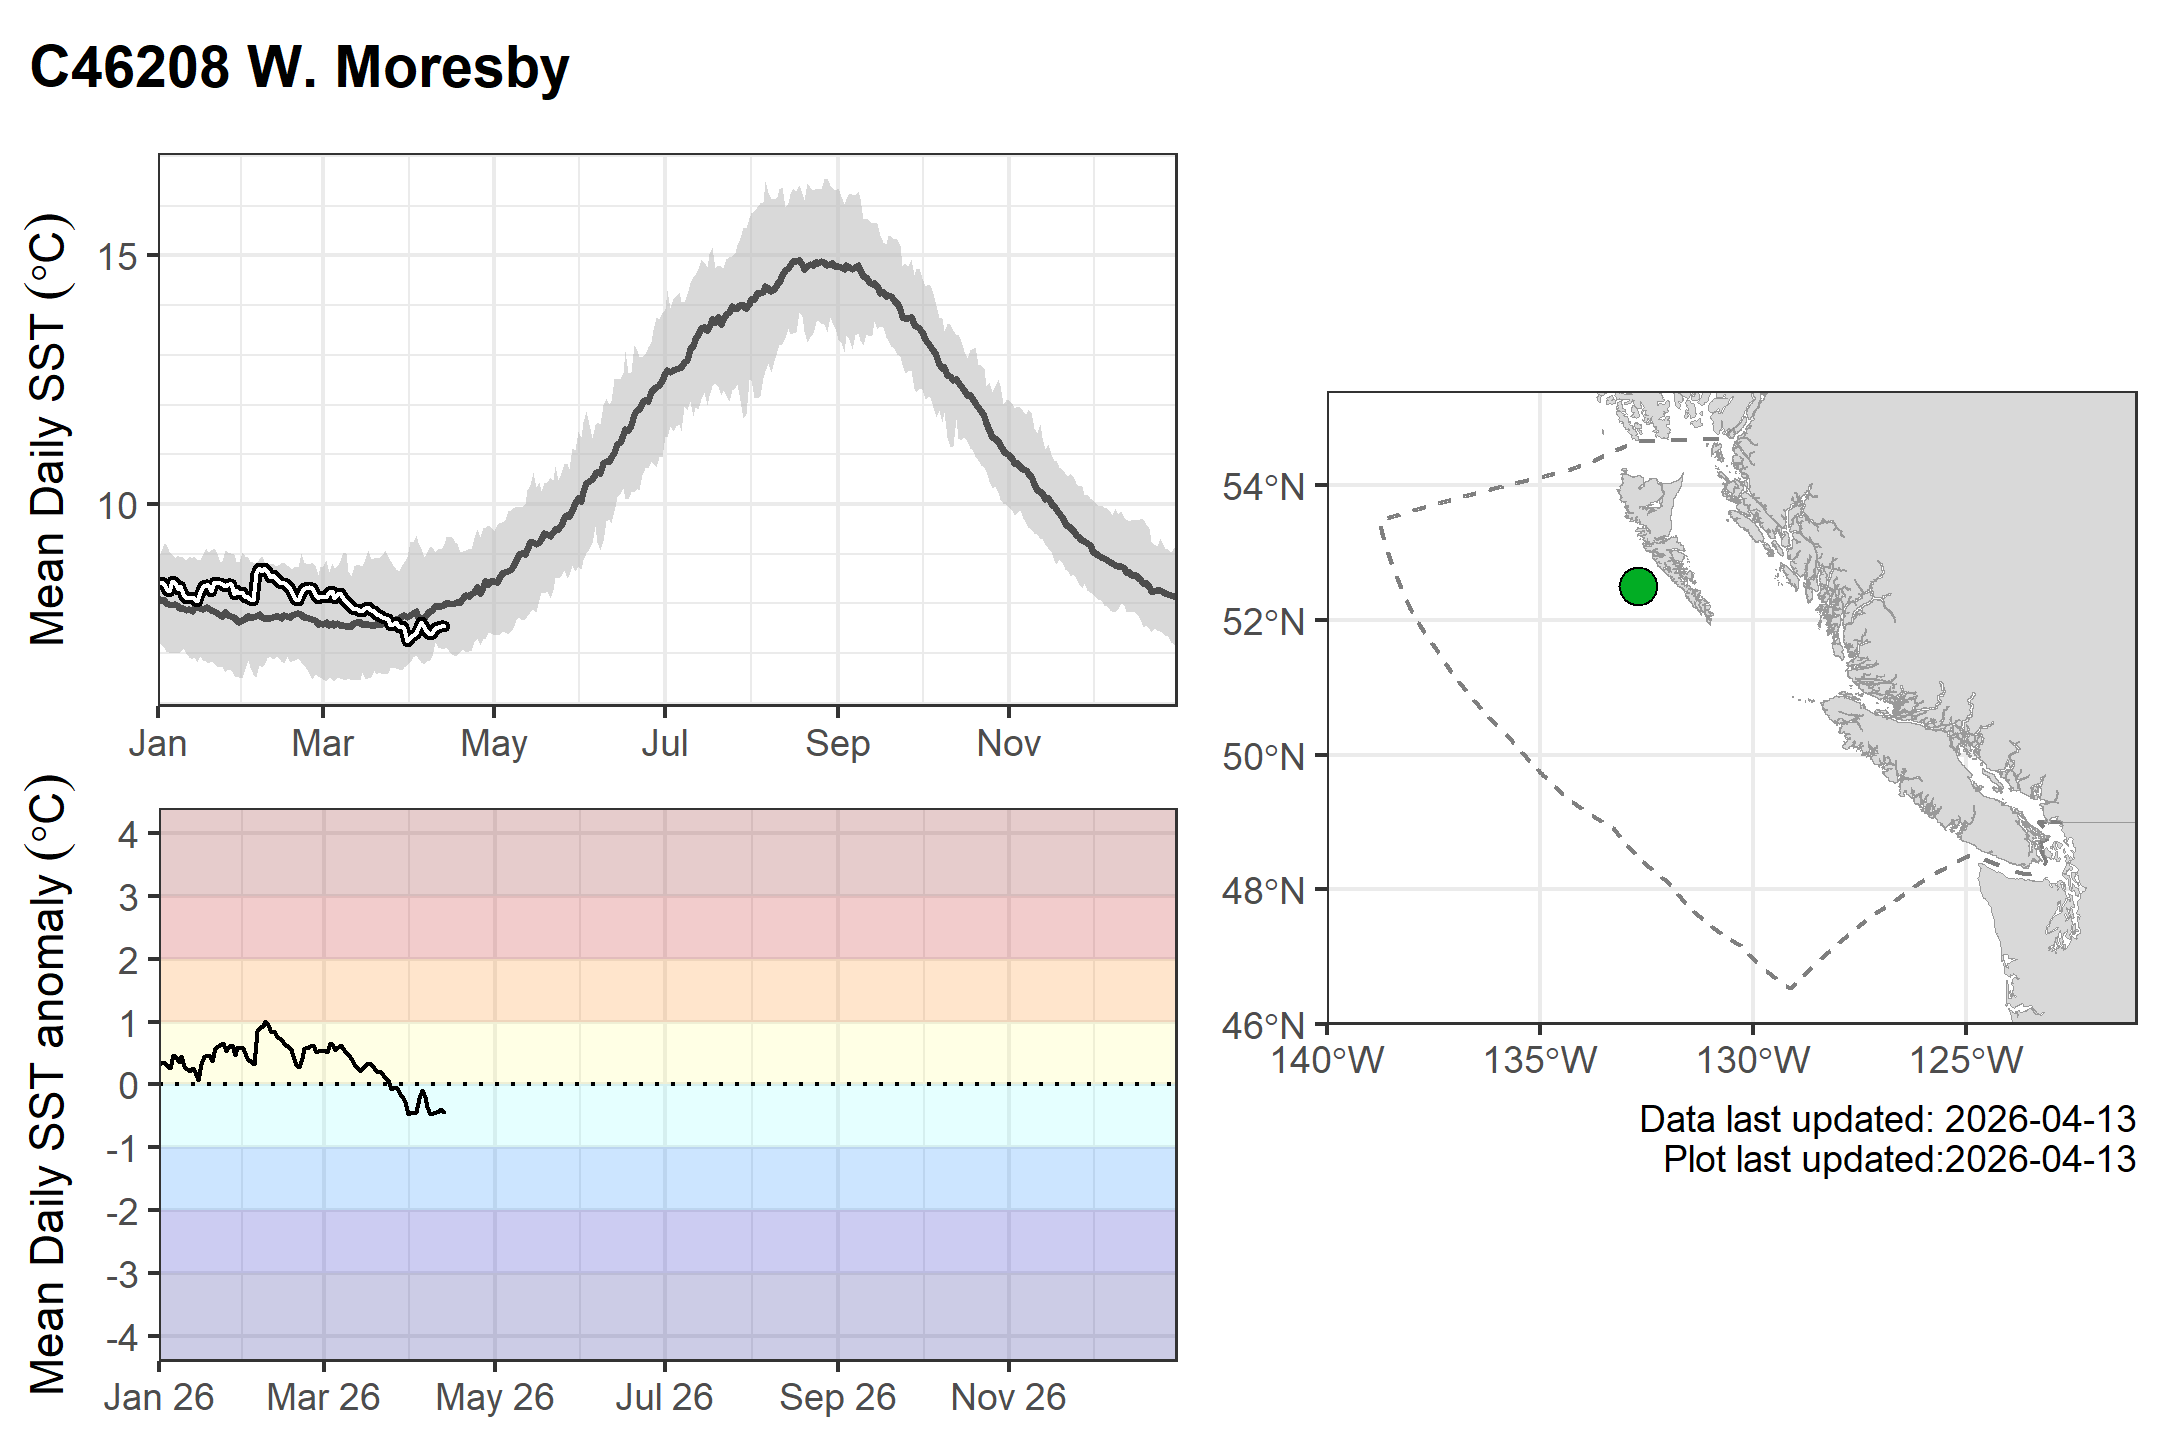
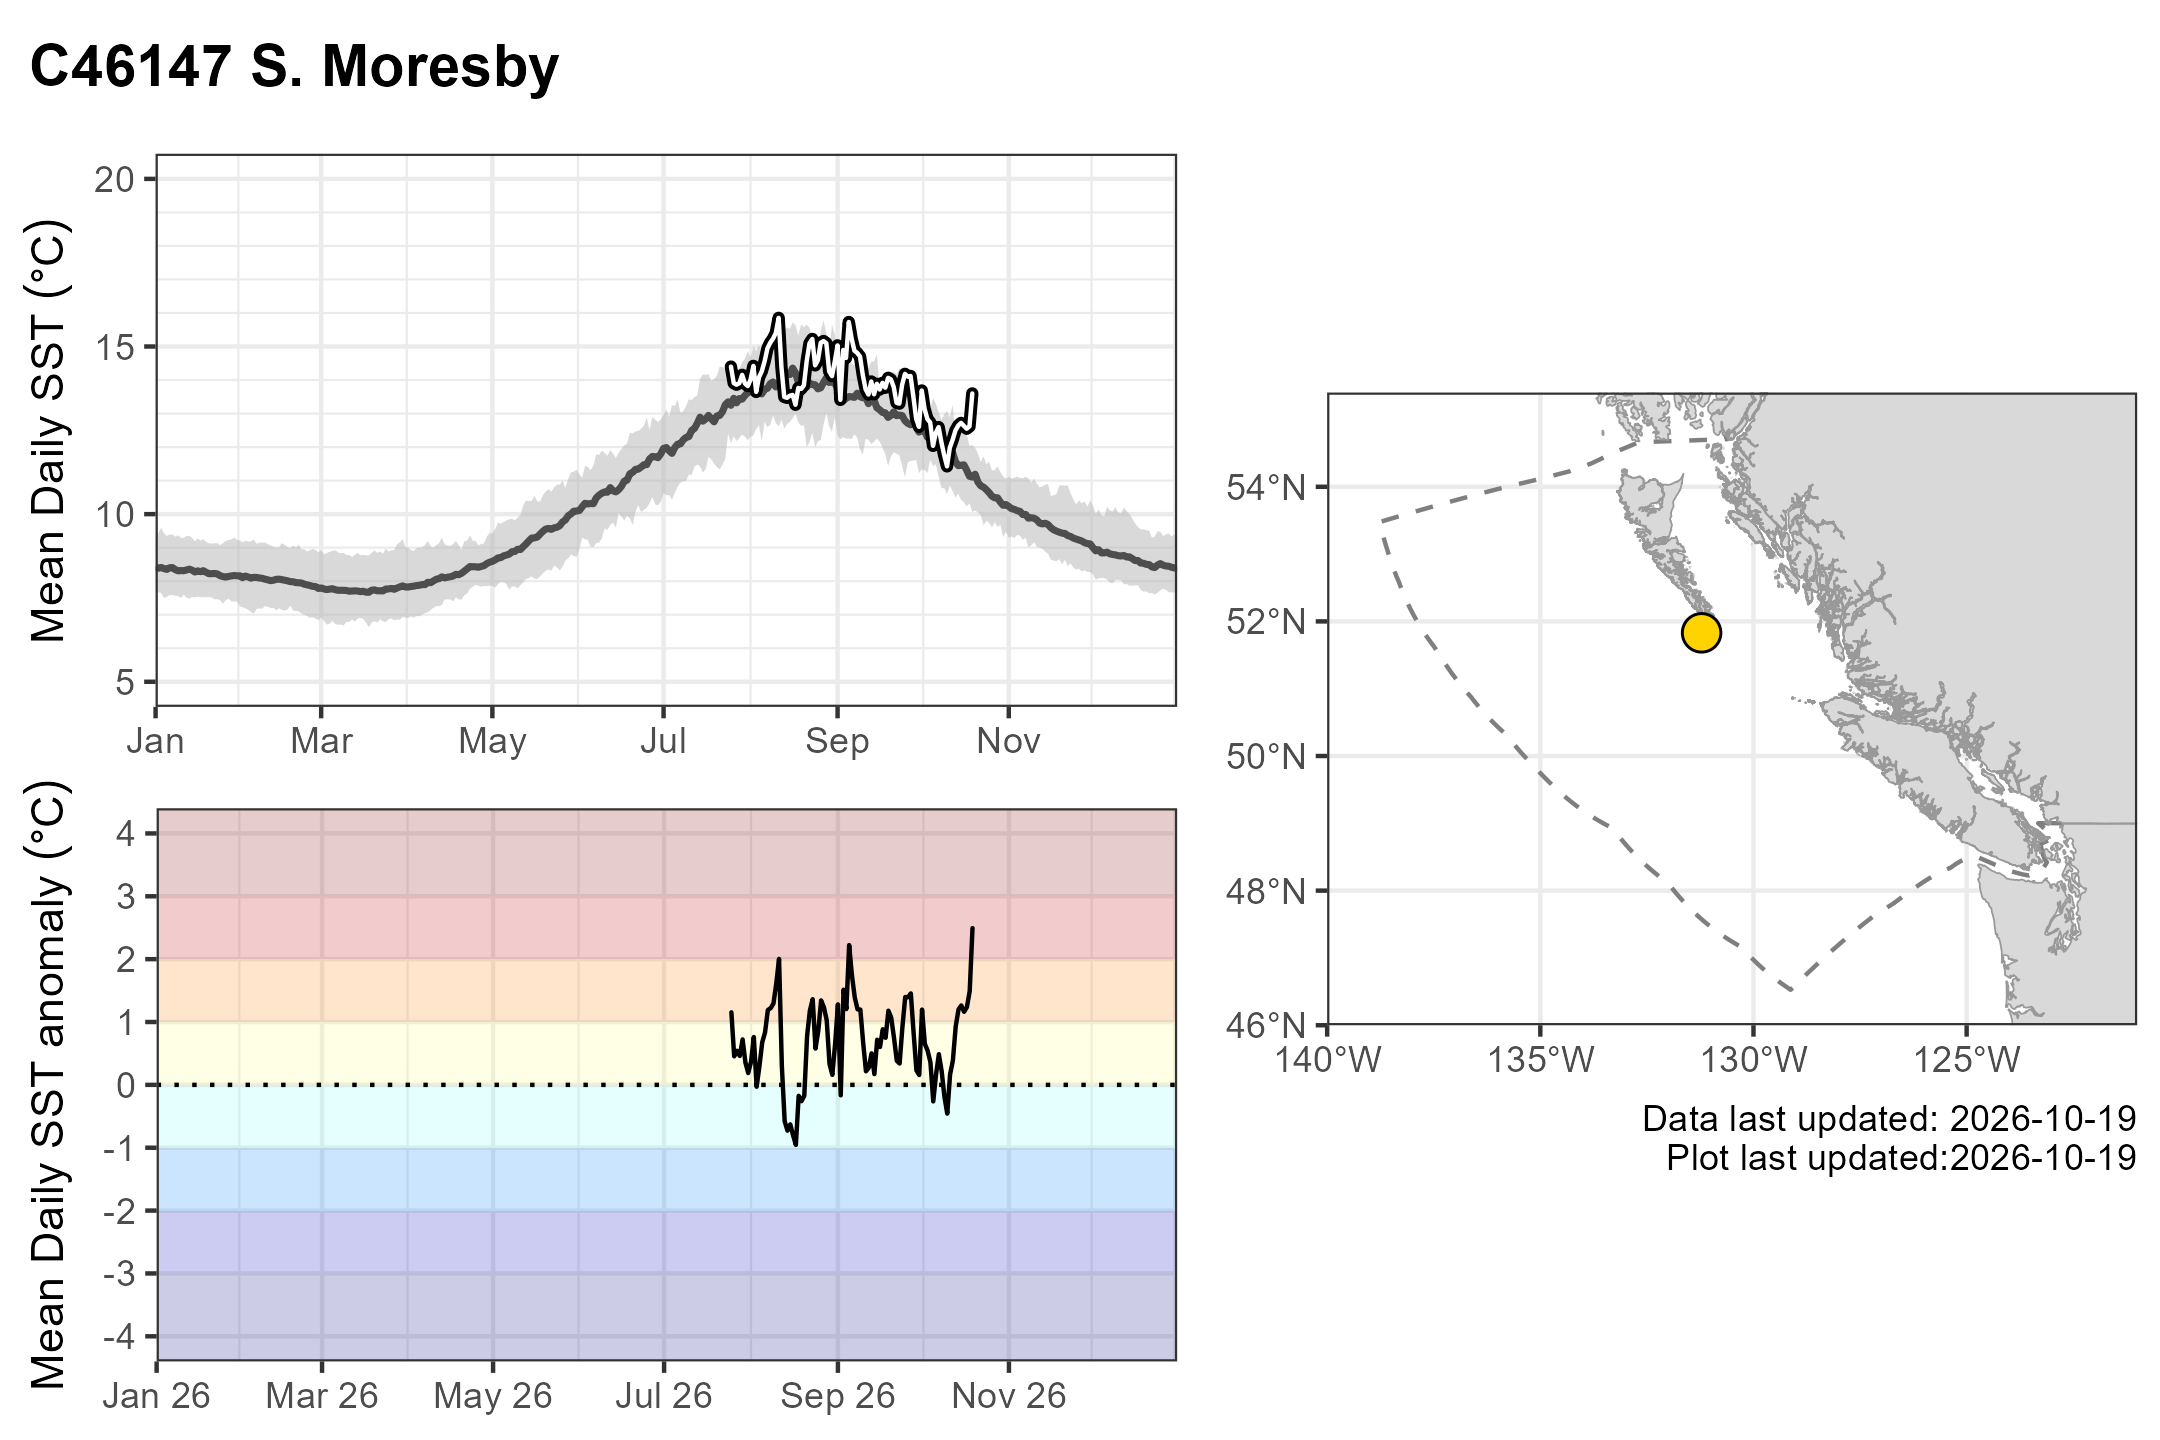
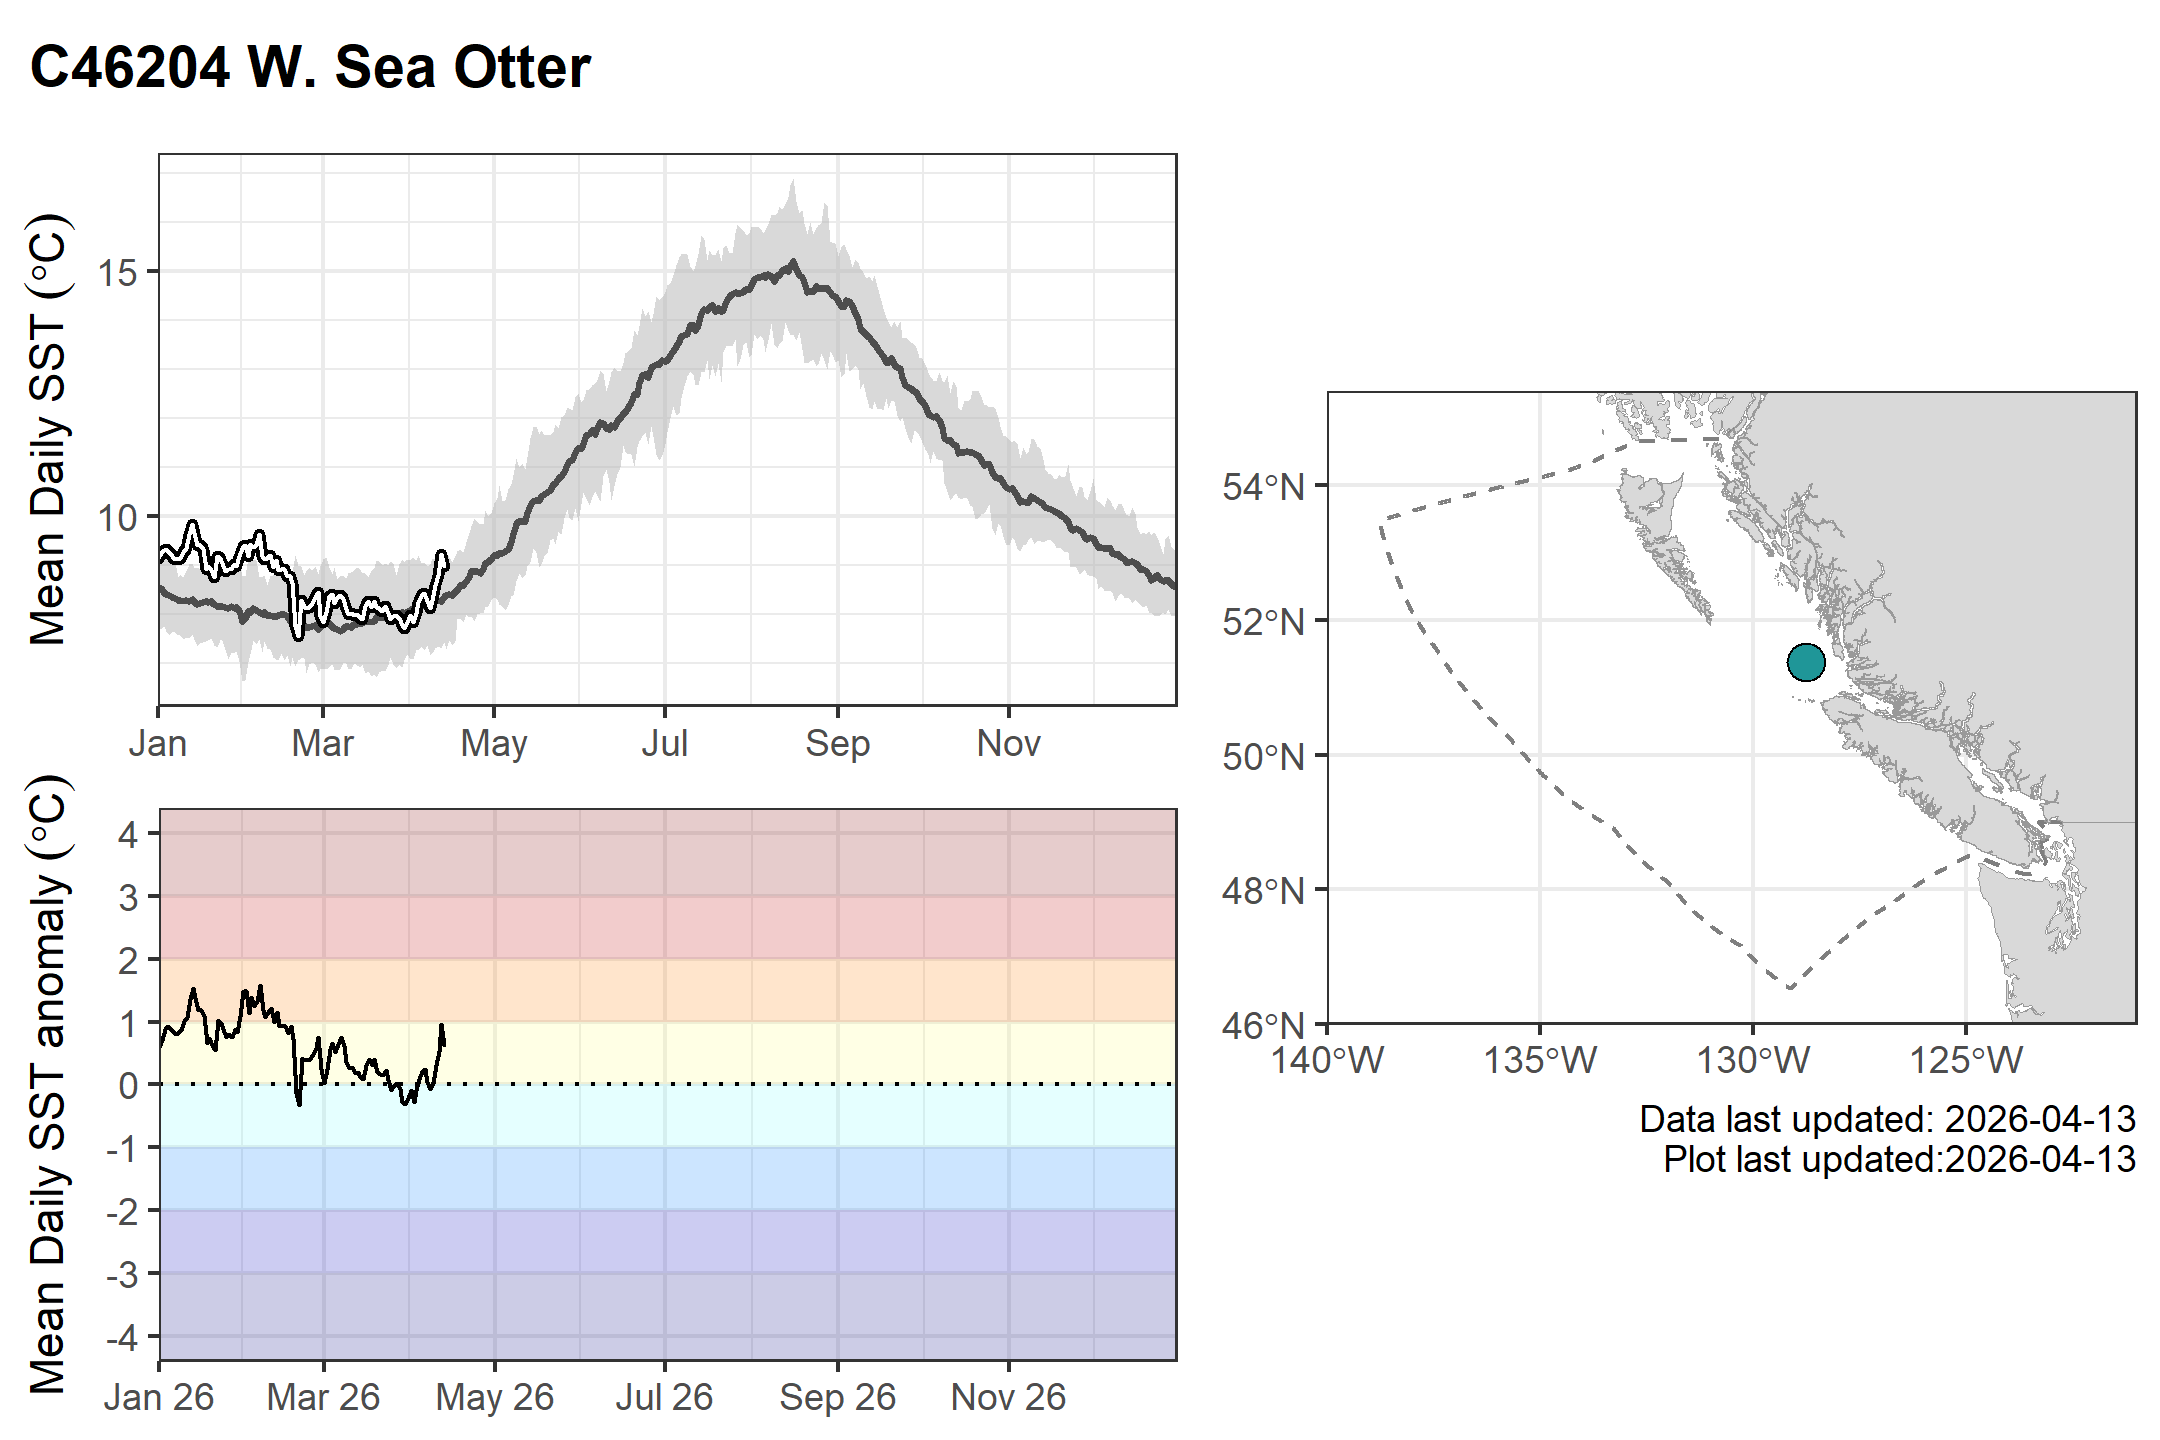
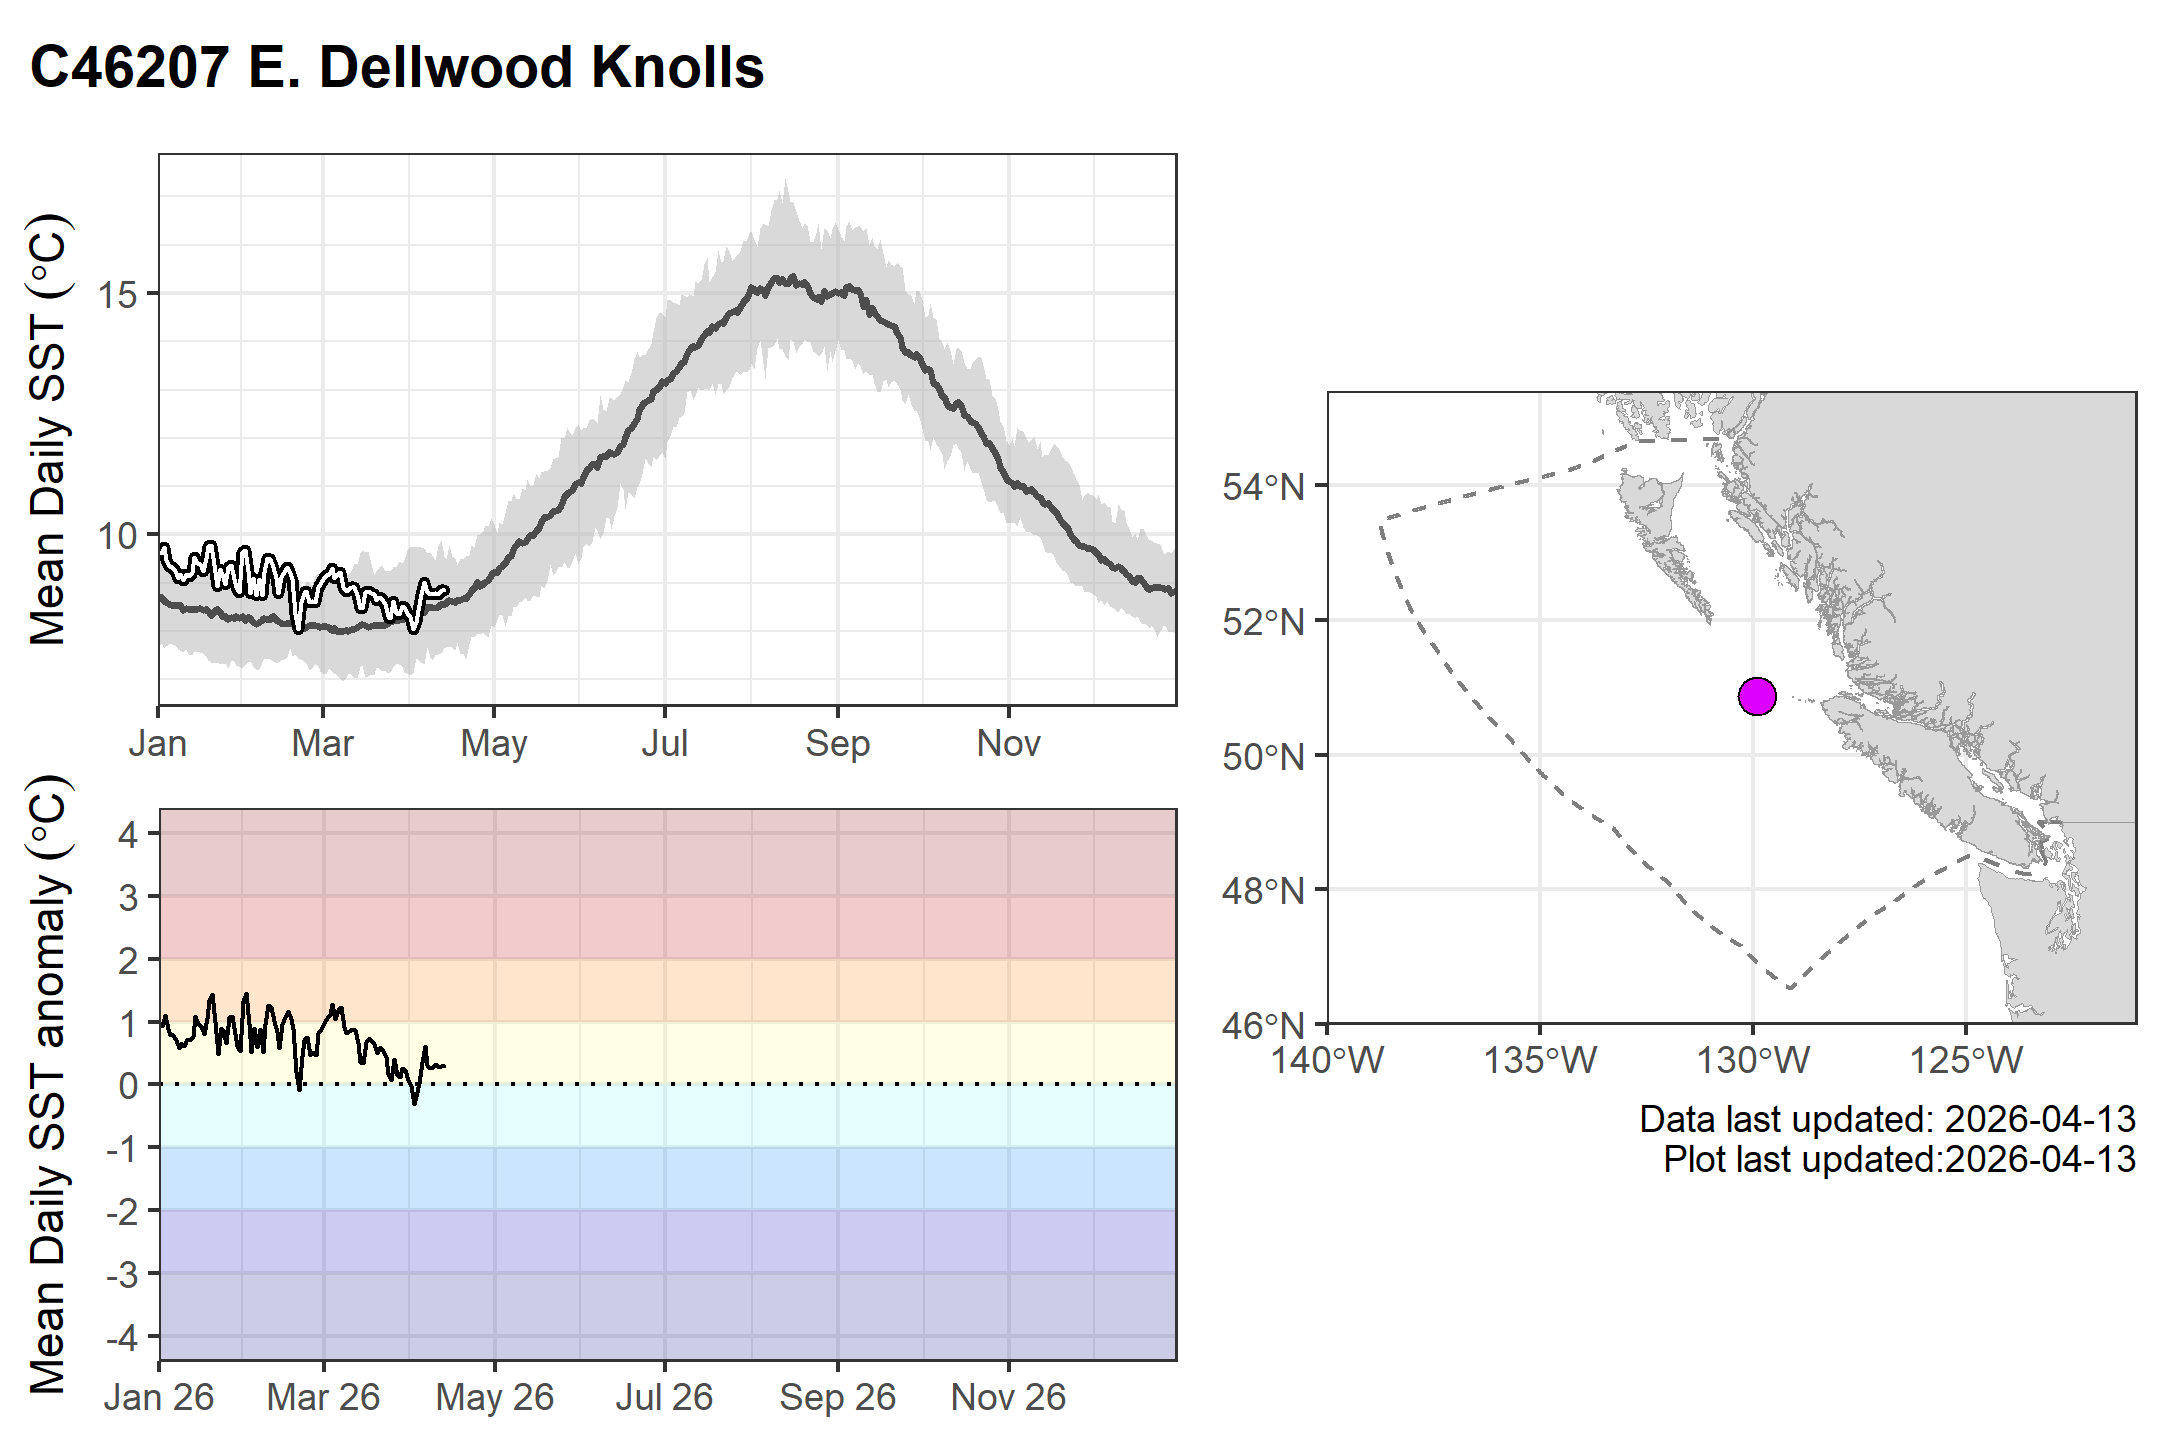
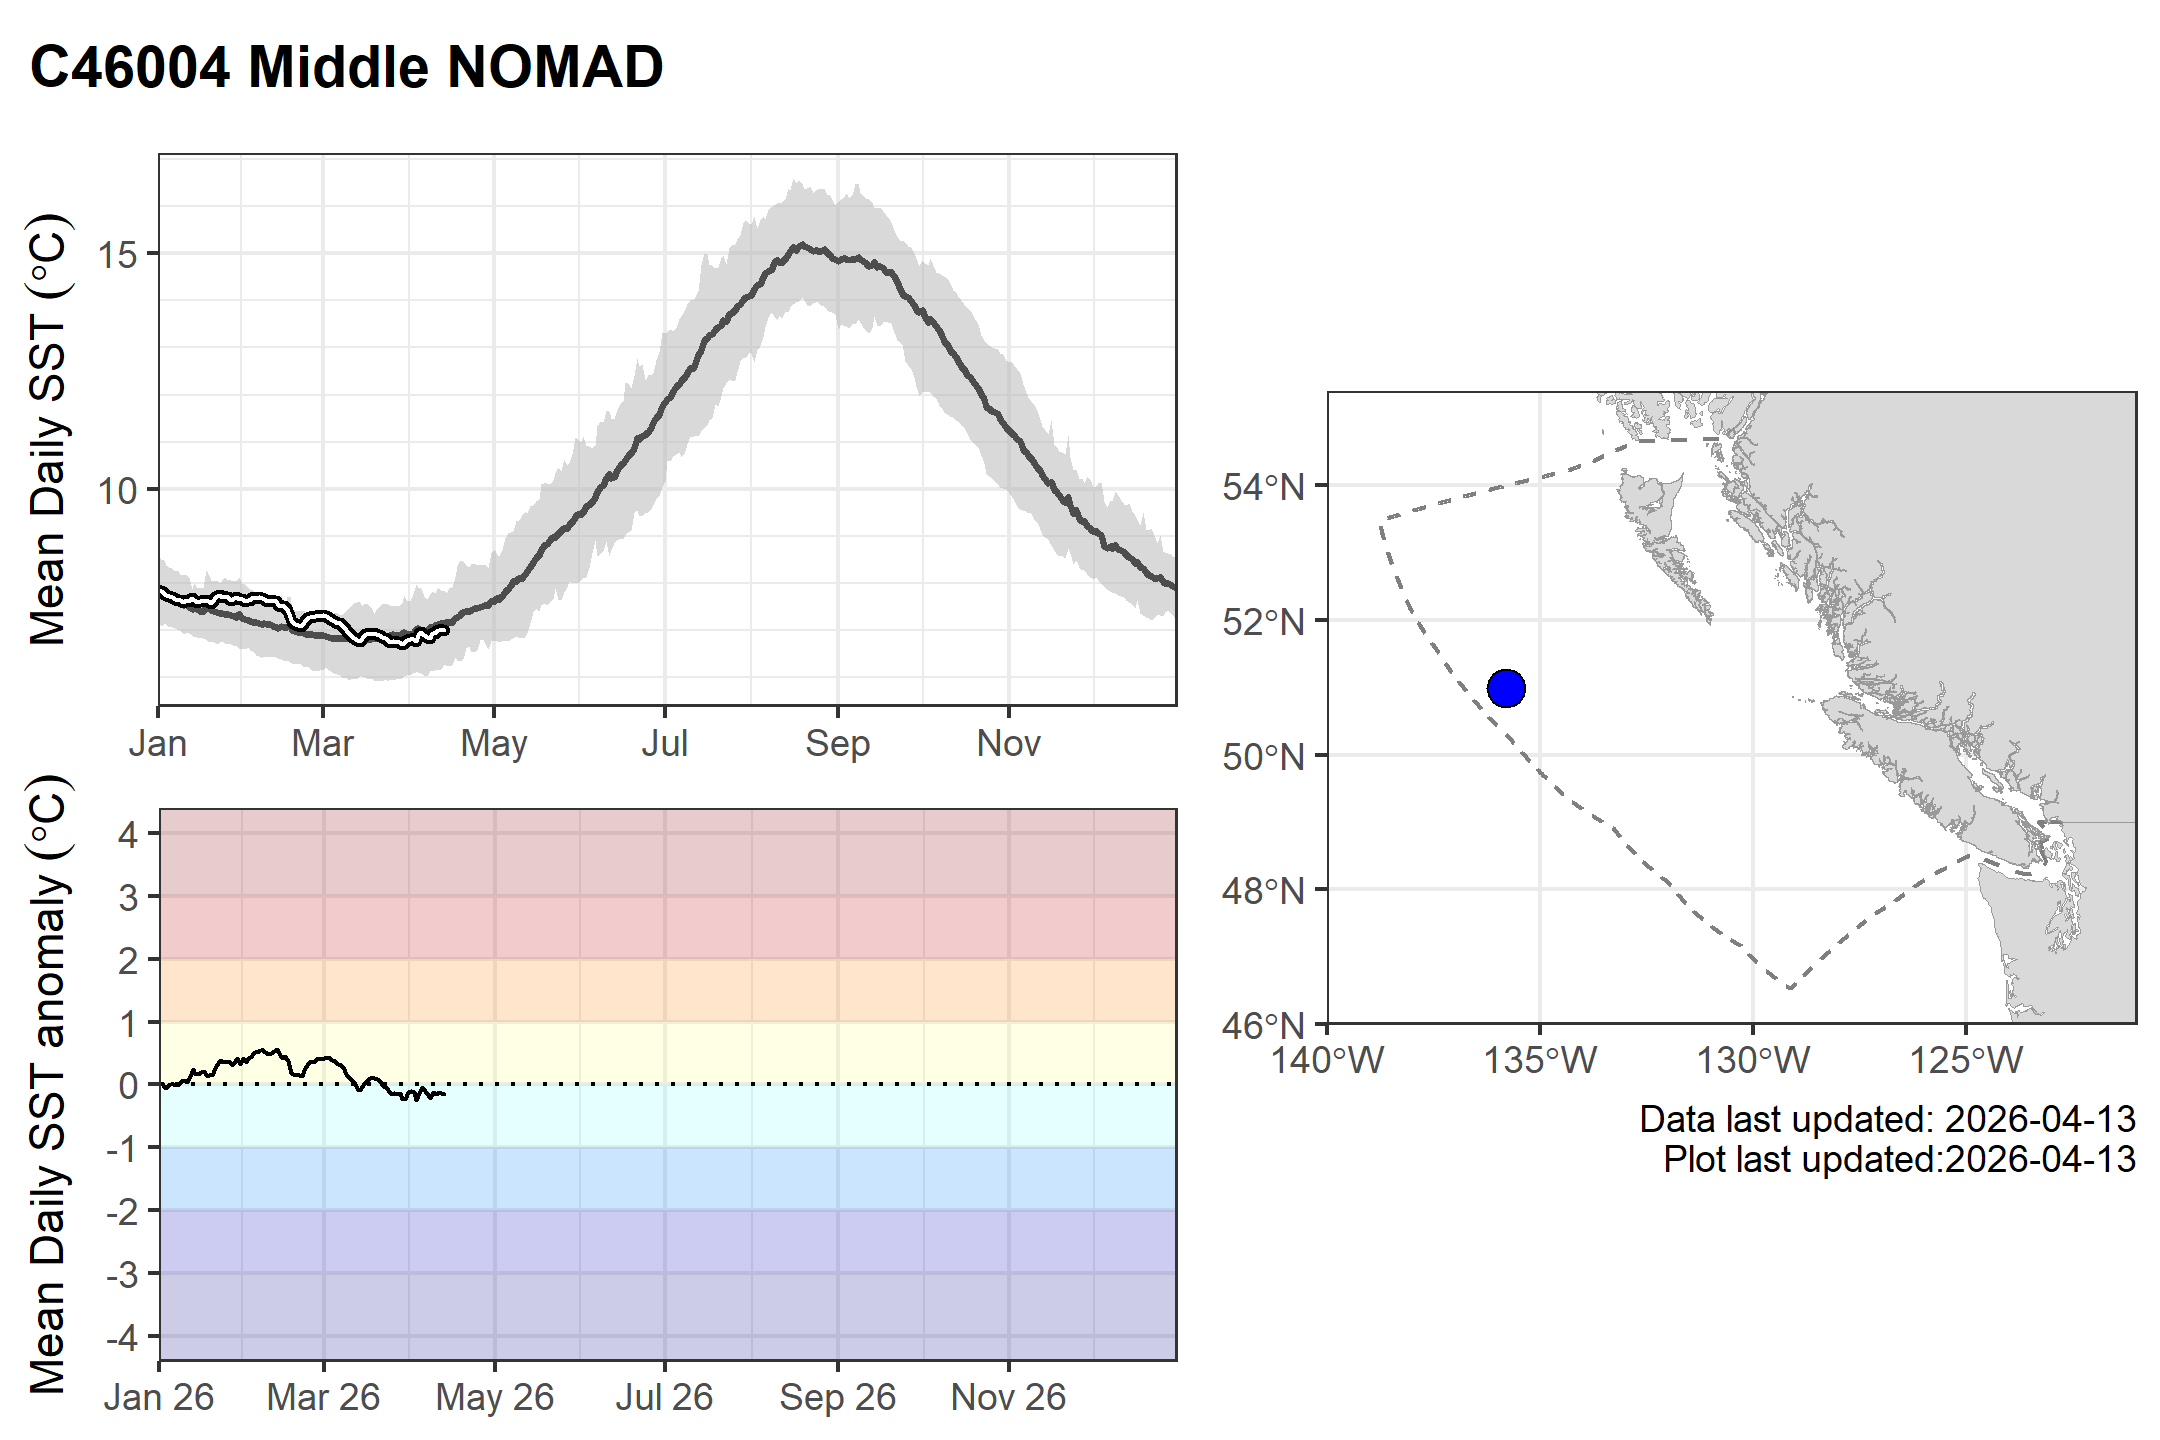
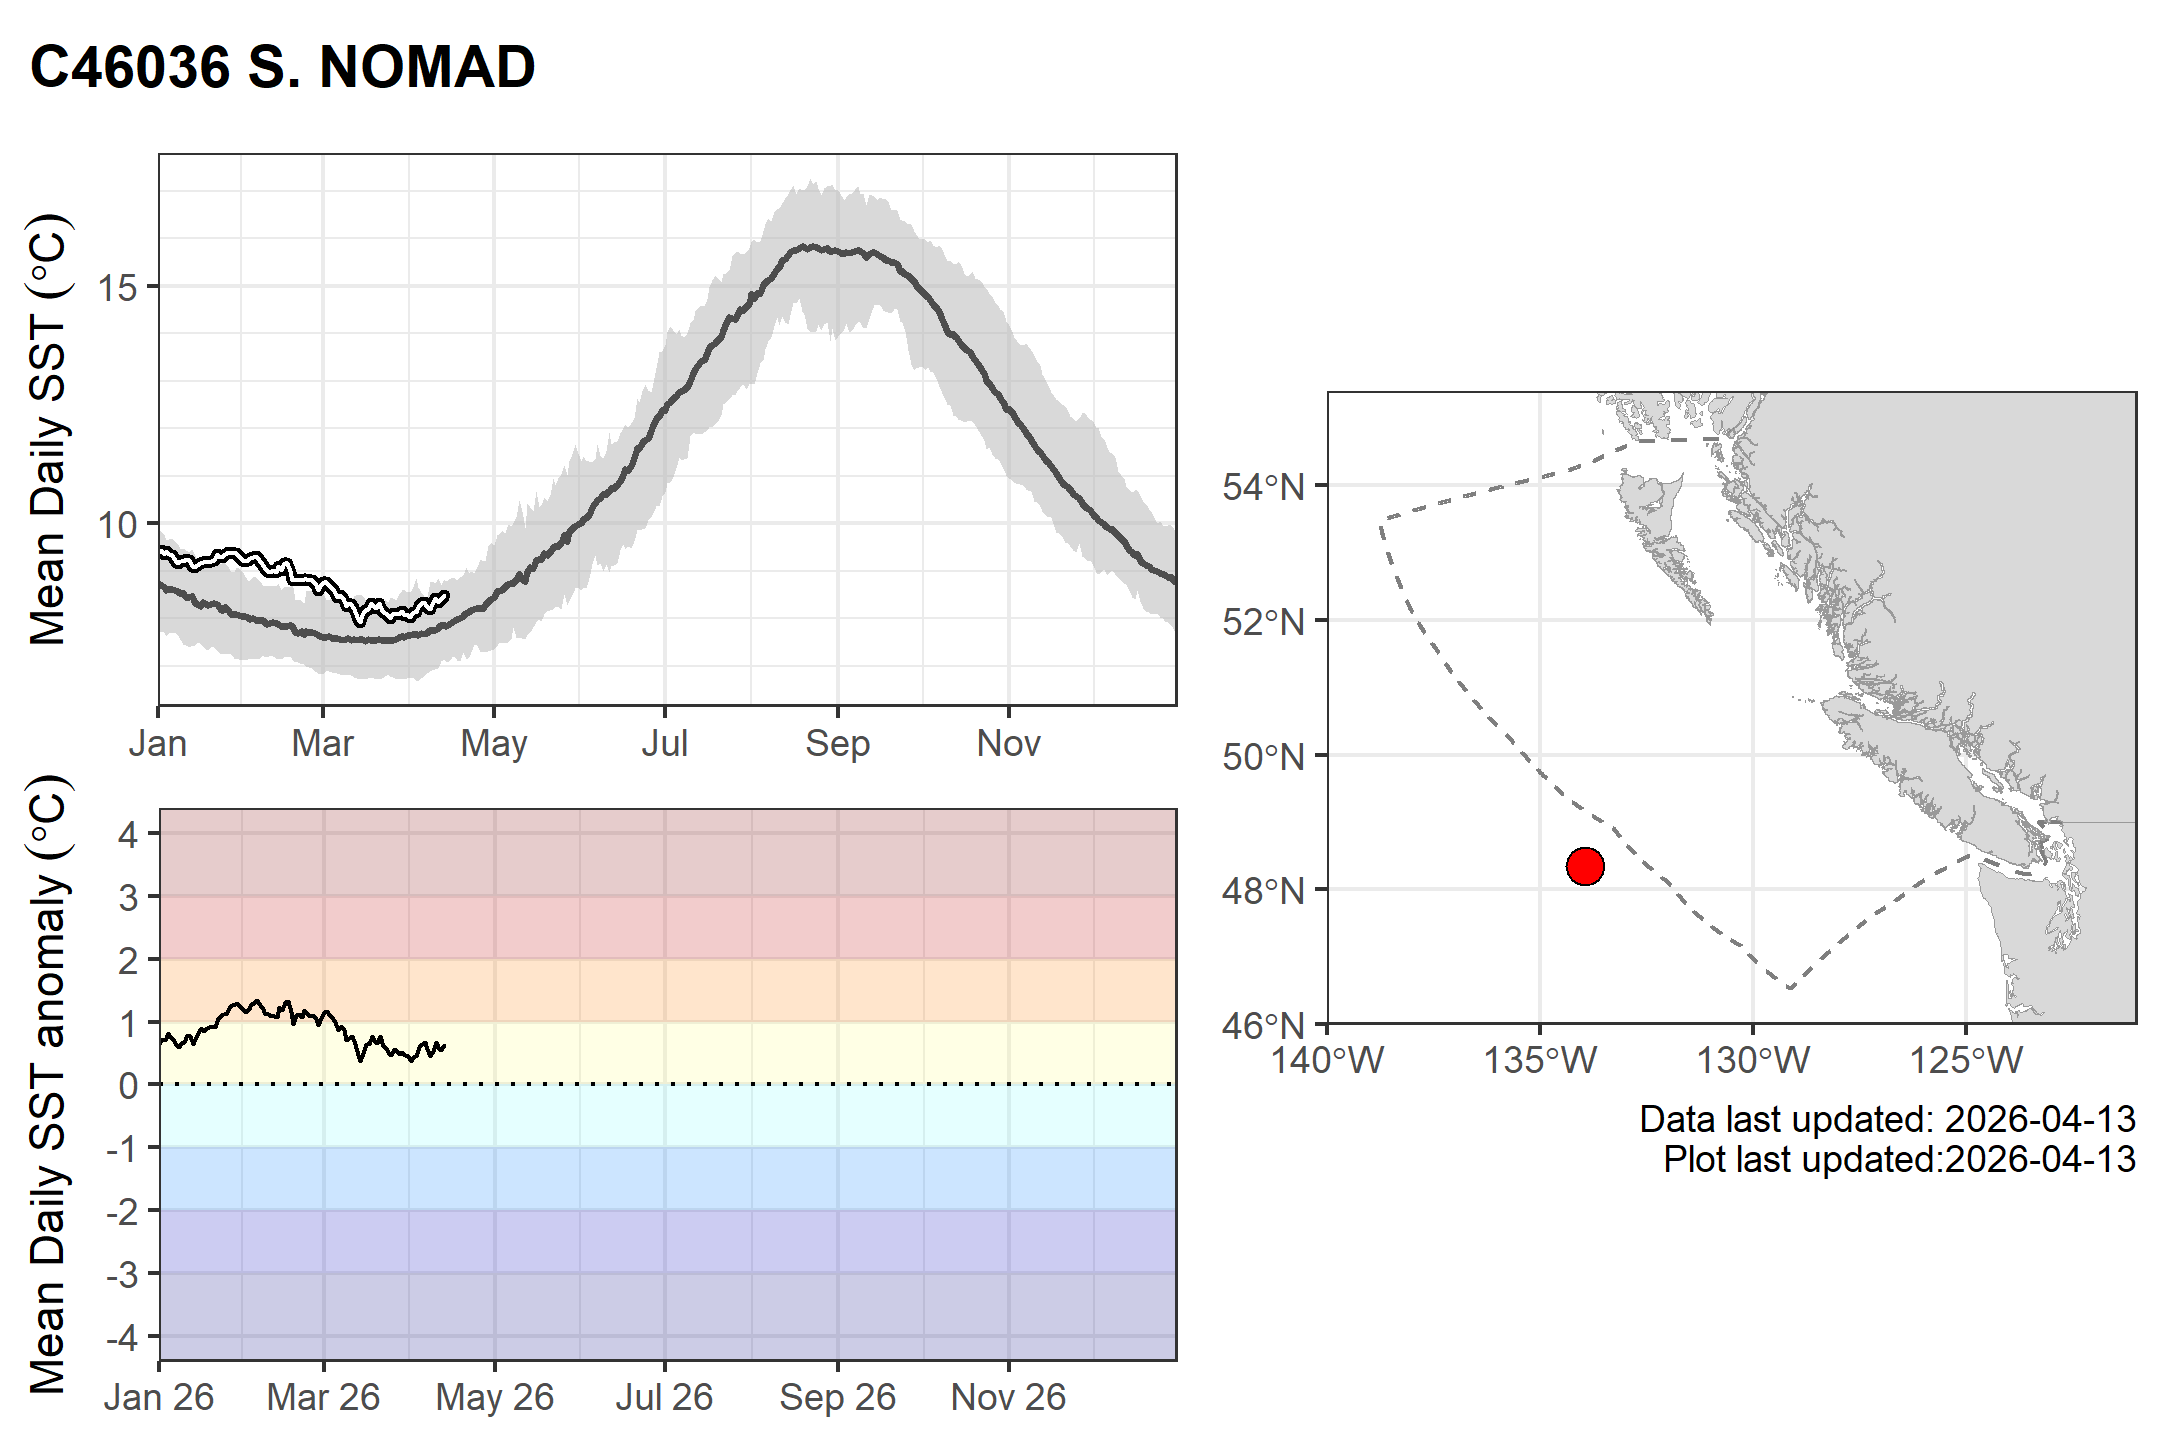
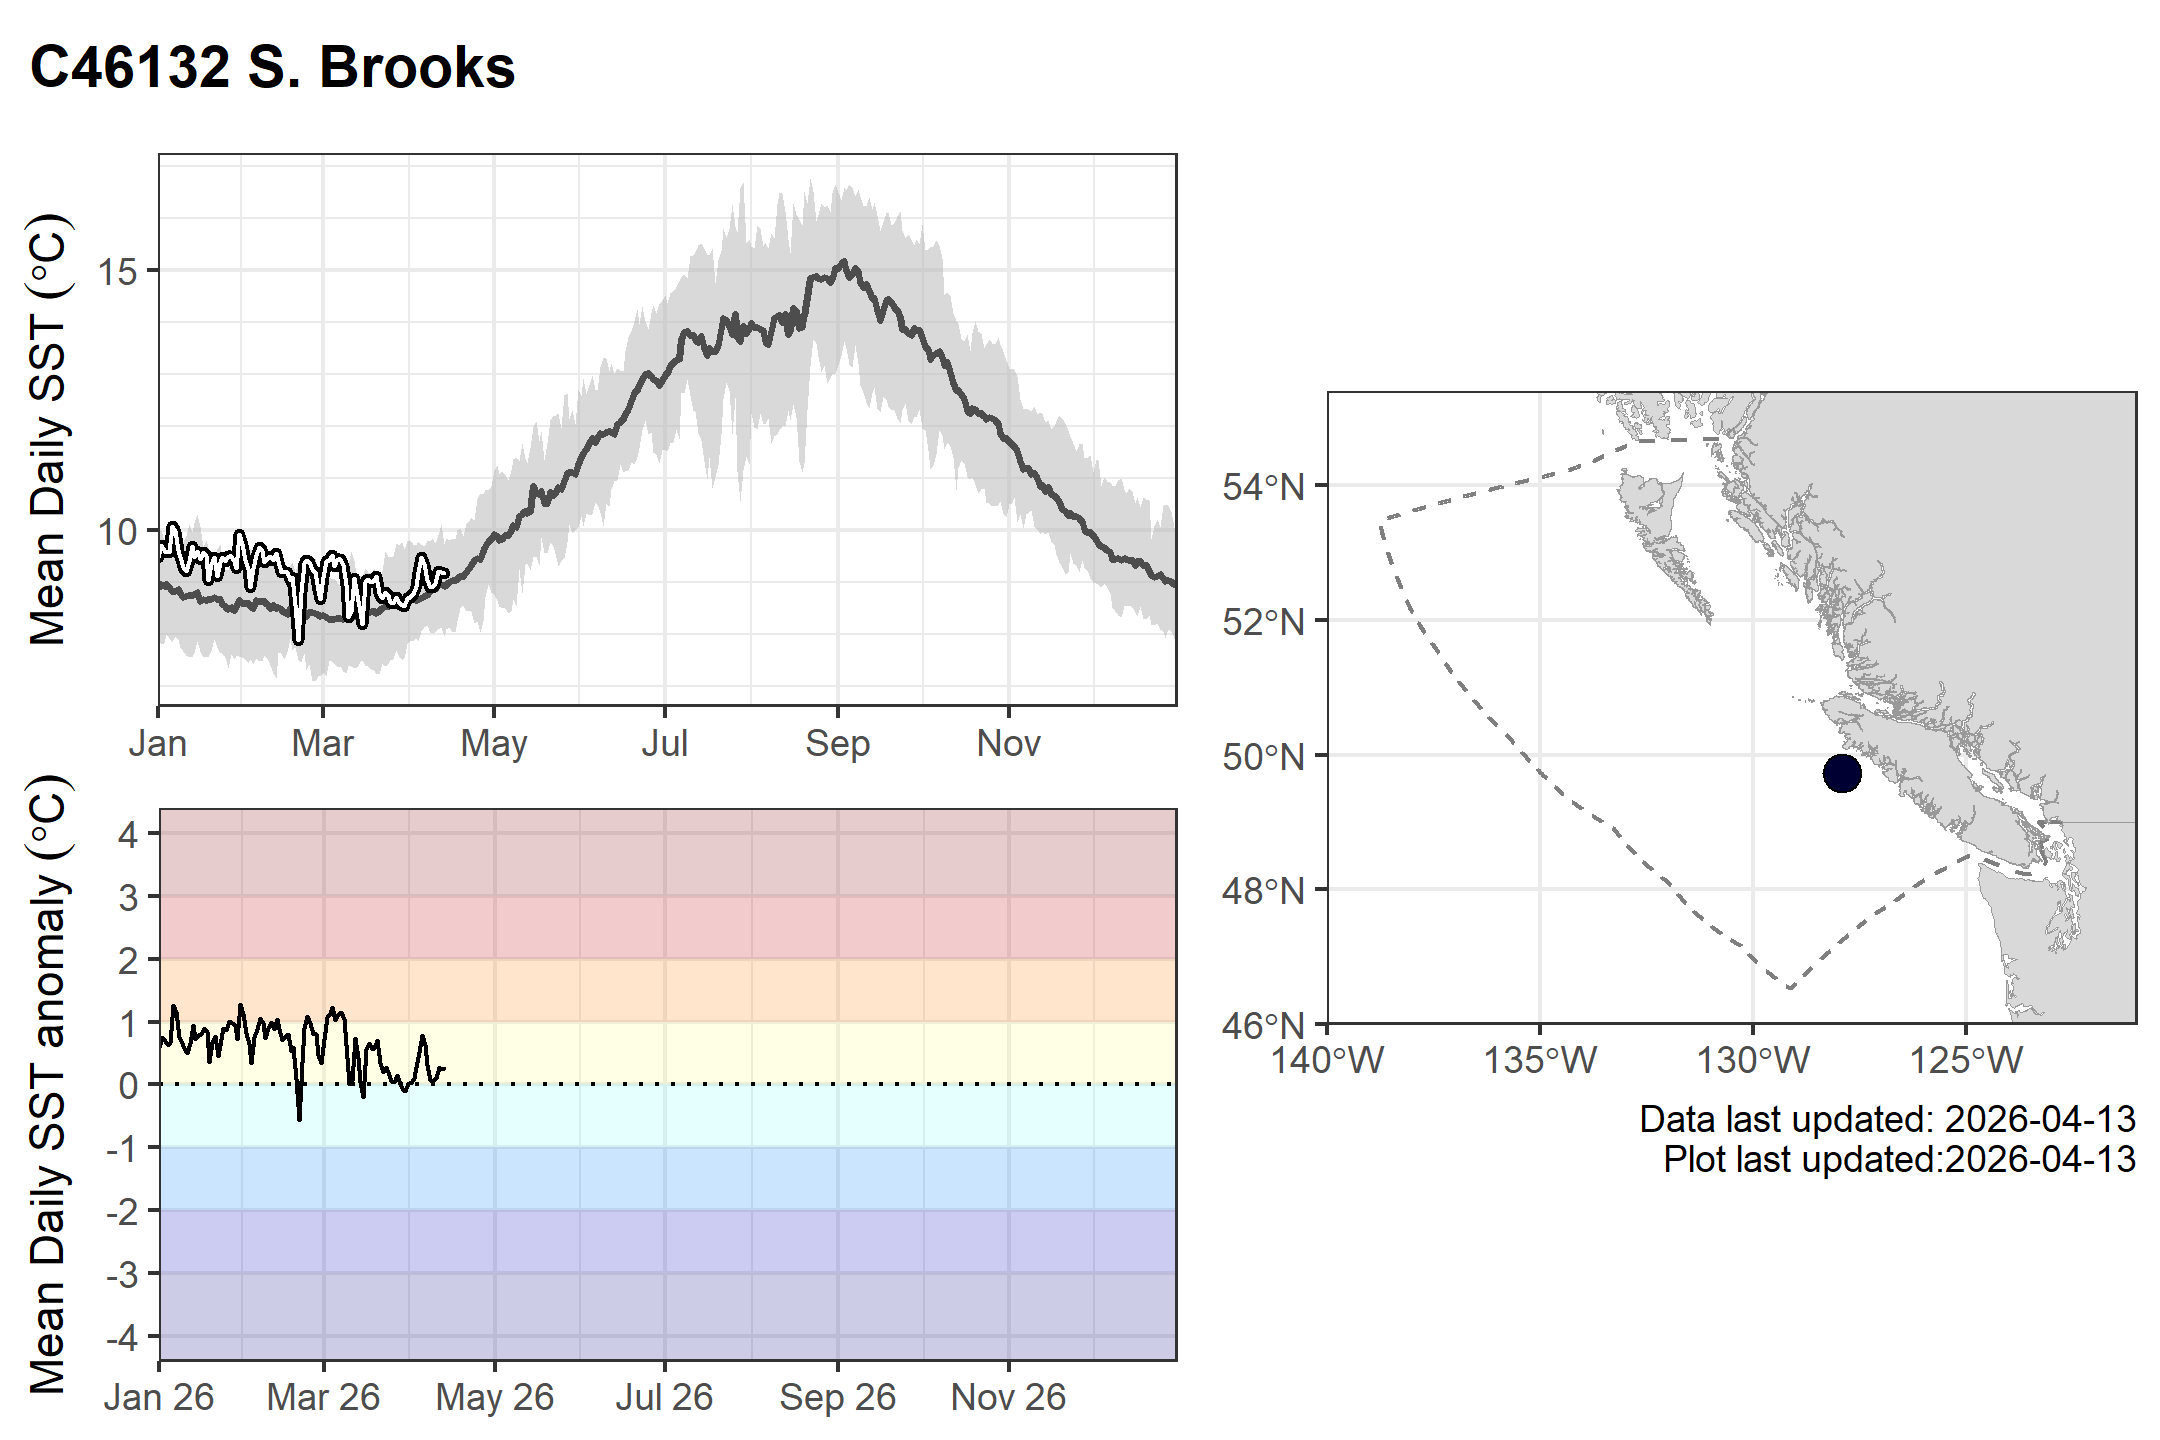
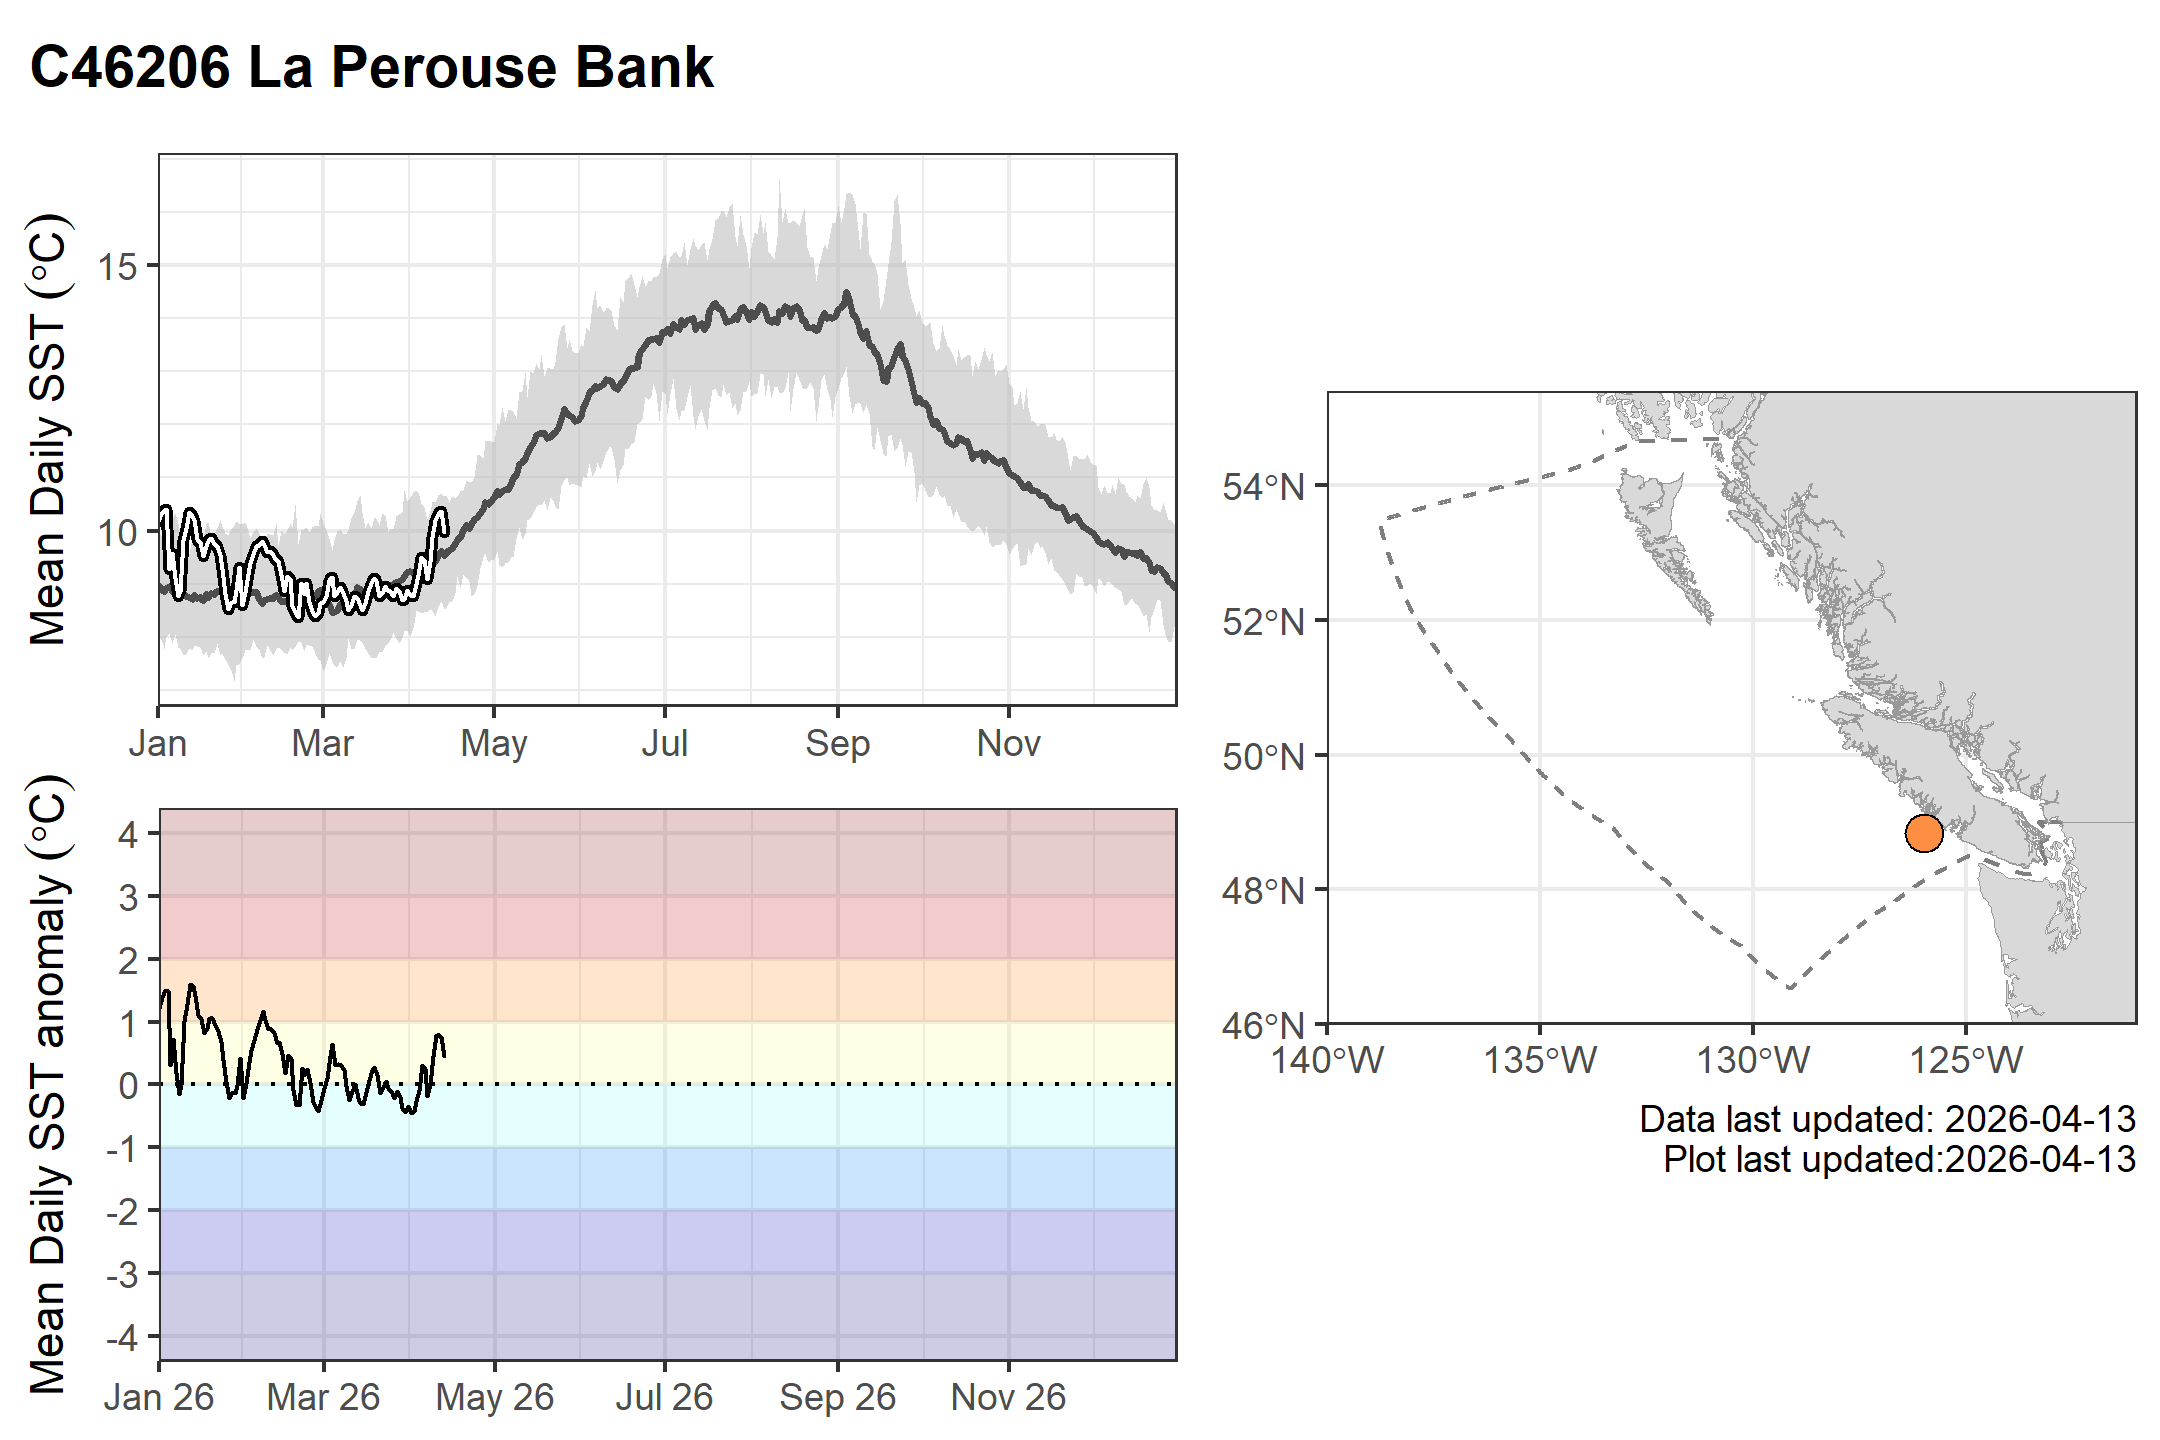
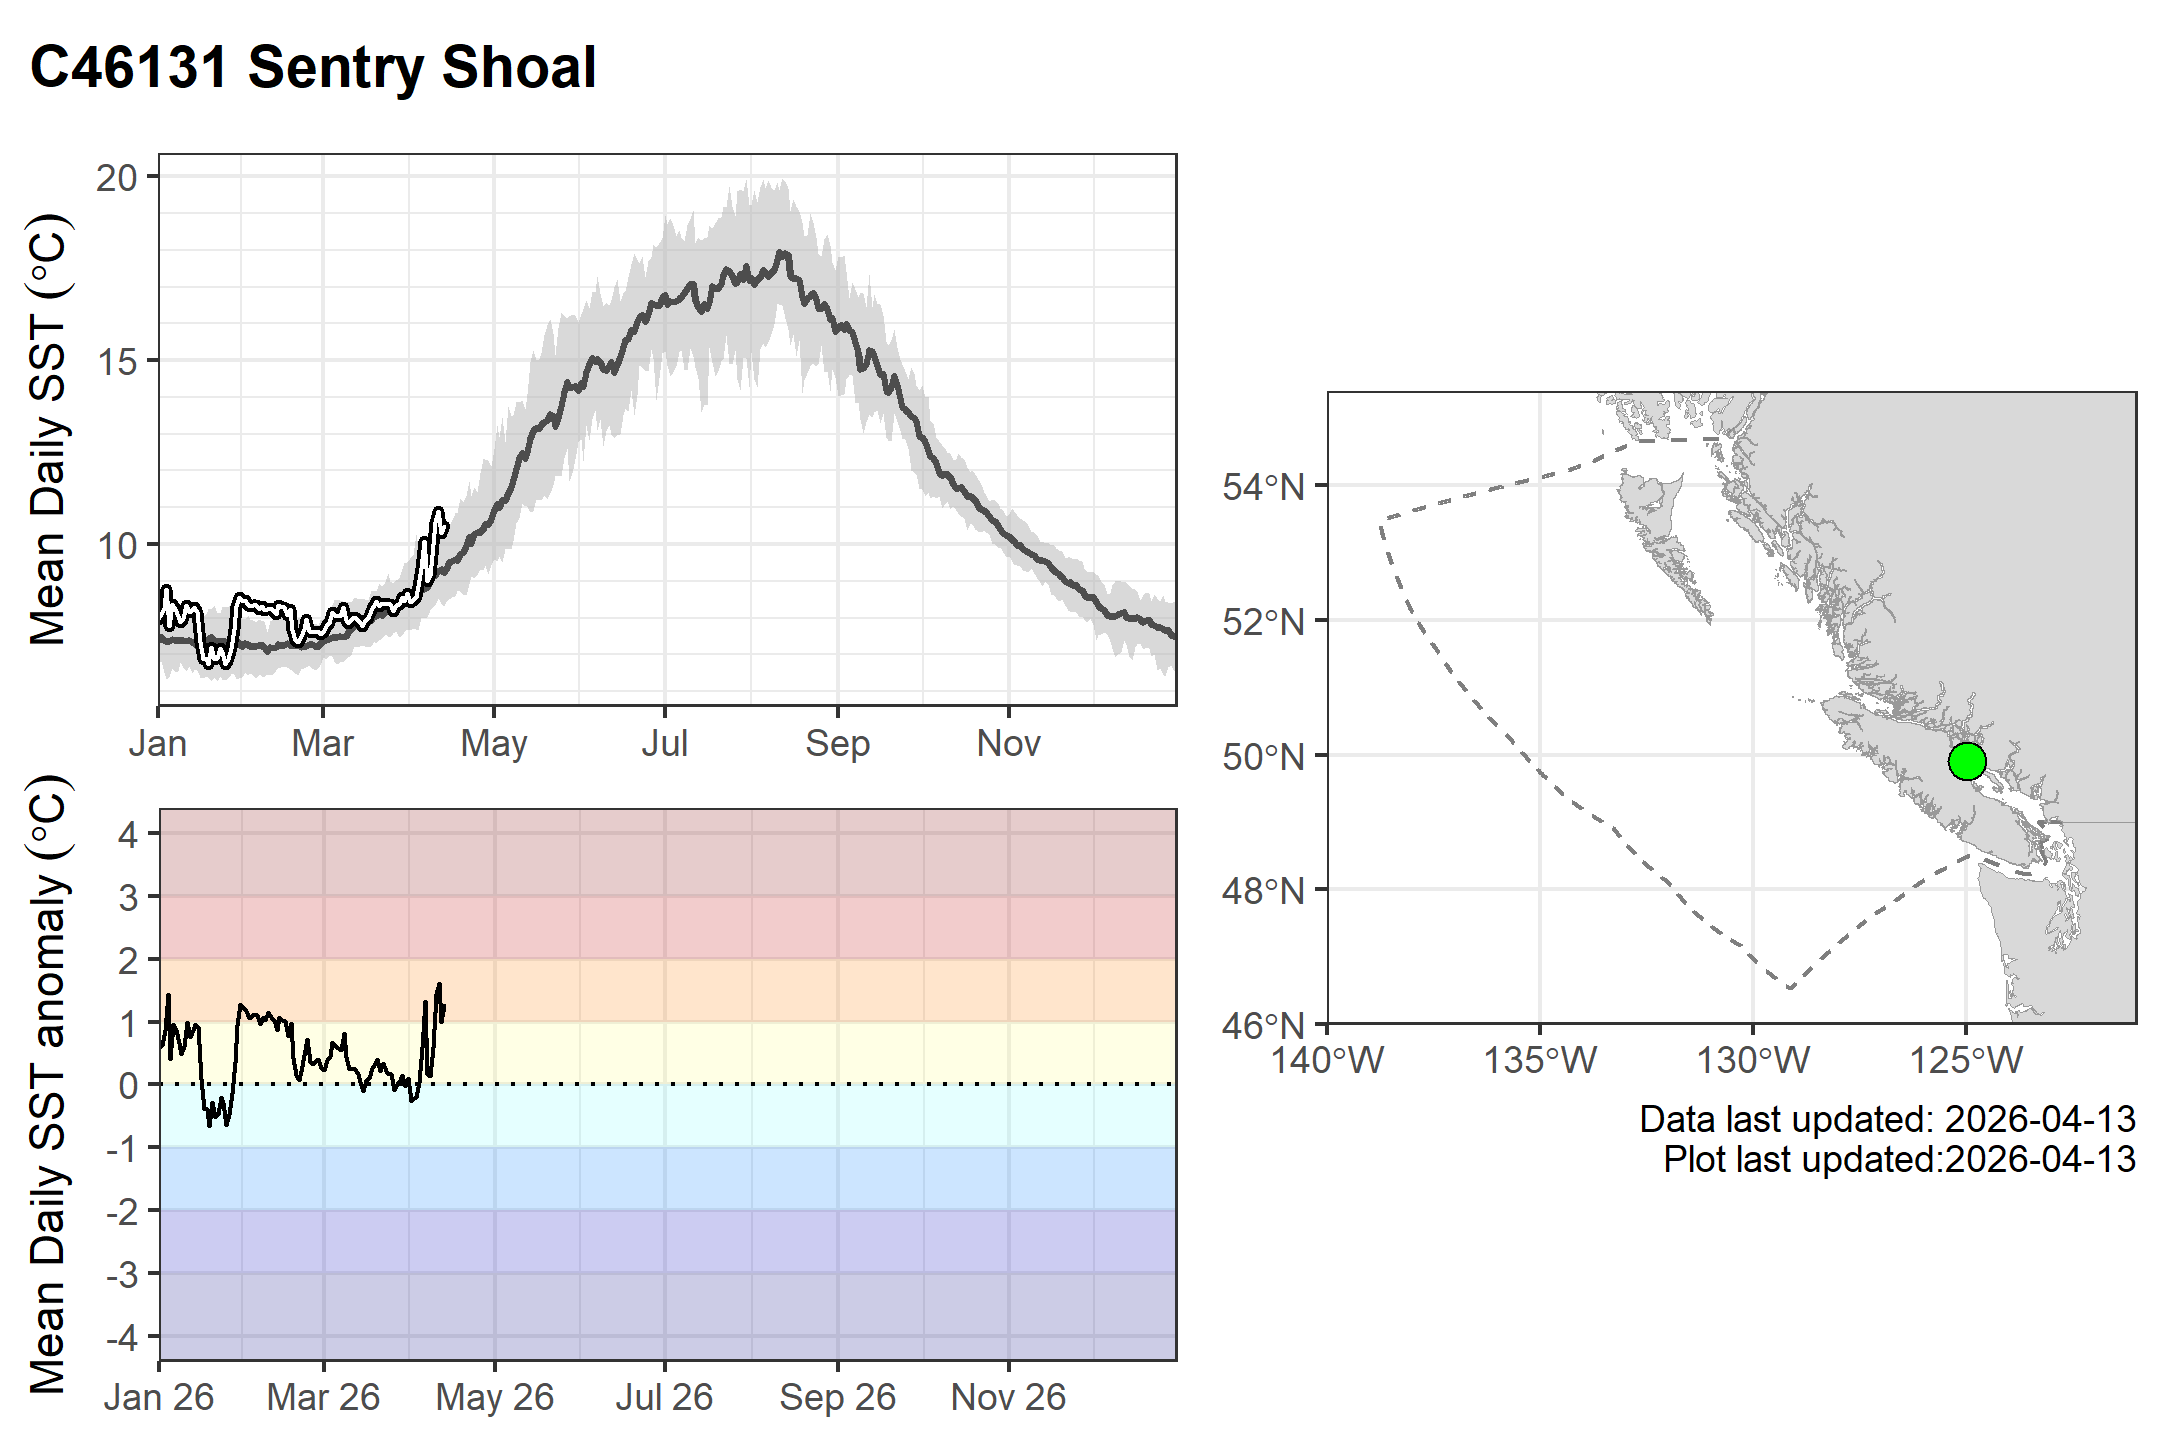
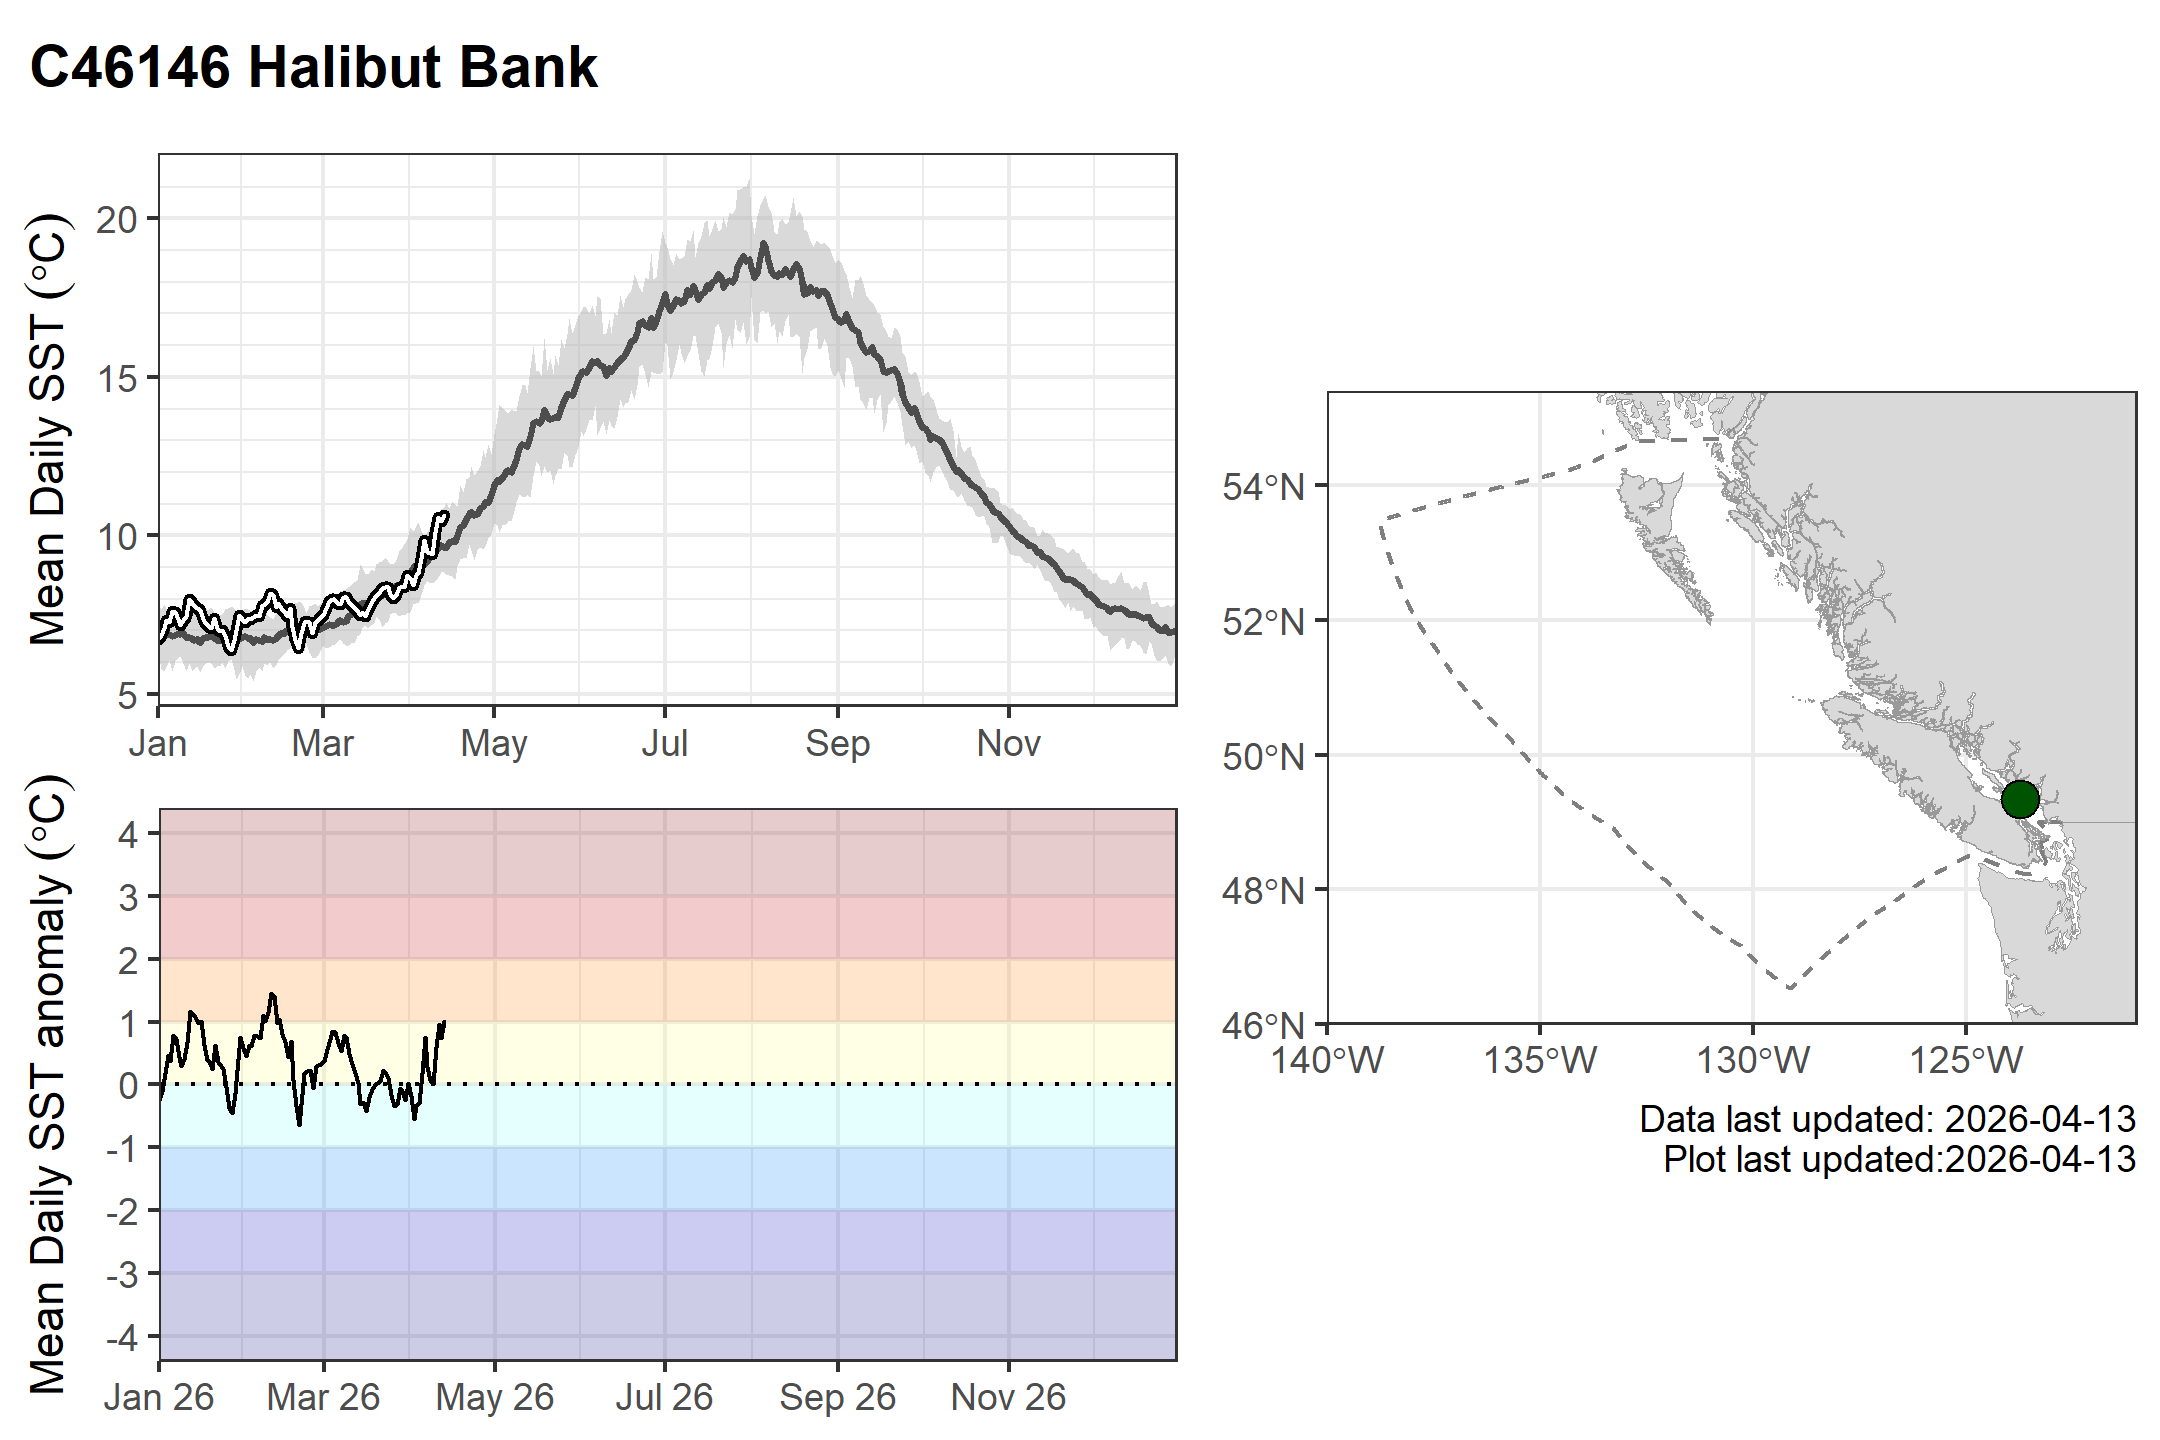
Note2026 ECCC buoy SST and SST anomalies

The white lines outlined in black are daily mean observations from 2026. The buoy climatological mean (grey line) is plotted with 10th and 90th percentiles (grey shading). The climatology spans 1991–2020, though some buoys began collecting data later: C46146 Halibut Bank, C46131 Sentry Shoal, C46147 South Moresby and C46132 South Brooks.

There are no climatologies for C46303 South Georgia Strait and C46304 Entrance English Bay as they were installed in 2019.

NoteClick here to view buoy details

The start dates listed here may not correspond with other sources (e.g., the ECCC website) but represent the data record available at the sources listed above, as of December 2023.

An up-to-date buoy status report can be viewed here: https://collaboration.cmc.ec.gc.ca/cmc/wbs/bplatstat.html

Stn ID Start Date Longitude (°) Latitude (°)
C46004 Middle NOMAD 1988-08-04 -136.10 50.93
C46036 South NOMAD 1987-09-22 -133.94 48.35
C46131 Sentry Shoal 1992-10-20 -124.99 49.91
C46132 South Brooks 1994-05-05 -127.93 49.74
C46145 Central Dixon Entrance 1991-04-16 -132.42 54.38
C46146 Halibut Bank 1992-03-13 -123.73 49.34
C46147 South Moresby 1993-06-17 -131.23 51.83
C46181 Nanakwa Shoal 1988-11-22 -128.84 53.82
C46183 North Hecate Strait 1991-05-15 -131.14 53.57
C46184 North NOMAD 1987-09-20 -138.85 53.92
C46185 South Hecate Strait 1991-09-12 -129.79 52.42
C46204 West Sea Otter 1989-09-07 -128.77 51.38
C46205 West Dixon Entrance 1988-11-22 -134.32 54.19
C46206 La Perouse Bank 1988-11-22 -126.00 48.83
C46207 East Dellwood 1989-10-18 -129.91 50.88
C46208 West Moresby 1990-07-12 -132.69 52.51
C46303 South Georgia Strait* 2019-10-01 -123.43 49.025
C46304 Entrance English Bay* 2019-10-01 -123.357 49.302

* Note that these buoys do not have MEDS webpages with data

Northeast Pacific buoy temperatures

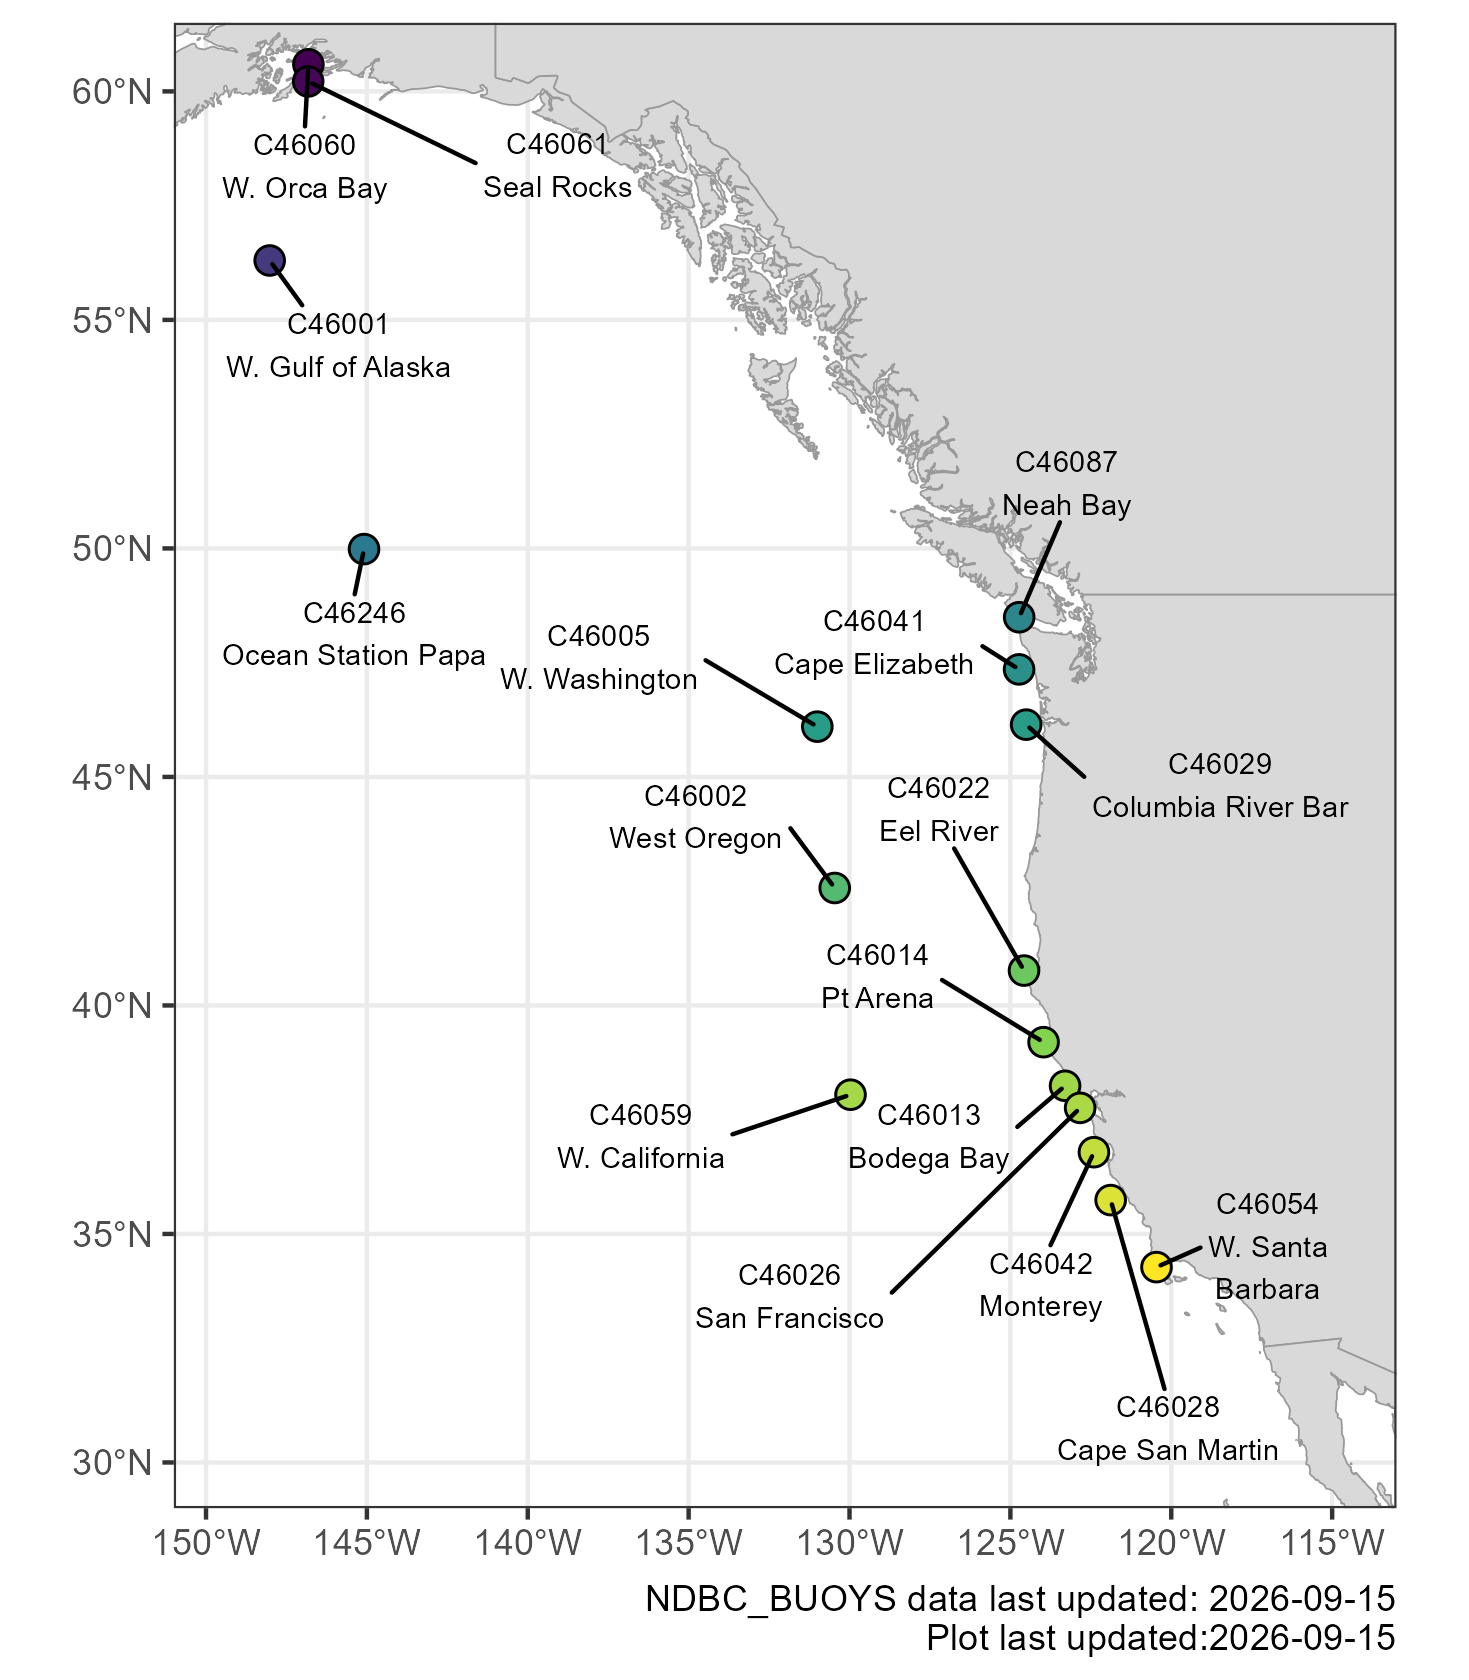
In addition to the ECCC buoy data, NOAA’s National Buoy Data Center reports temperature data from buoys, with many time series dating back more than 30 years. Data from NDBC buoys have been added below, so that we can view current SSTs and SST anomalies throughout the Northeast Pacific ocean.

NDBC buoy data

  • Dataset: NDBC Standard Meteorological Buoy Data
  • Data access: NOAA Coastwatch West Coast Regional Node ERDDAP cwwcNDBCMet record
  • Climatology period: 1991–2020 (where available)
NoteClick here to view map of buoys

NoteClick here to view 1991-2020 buoy surface temperature climatologies

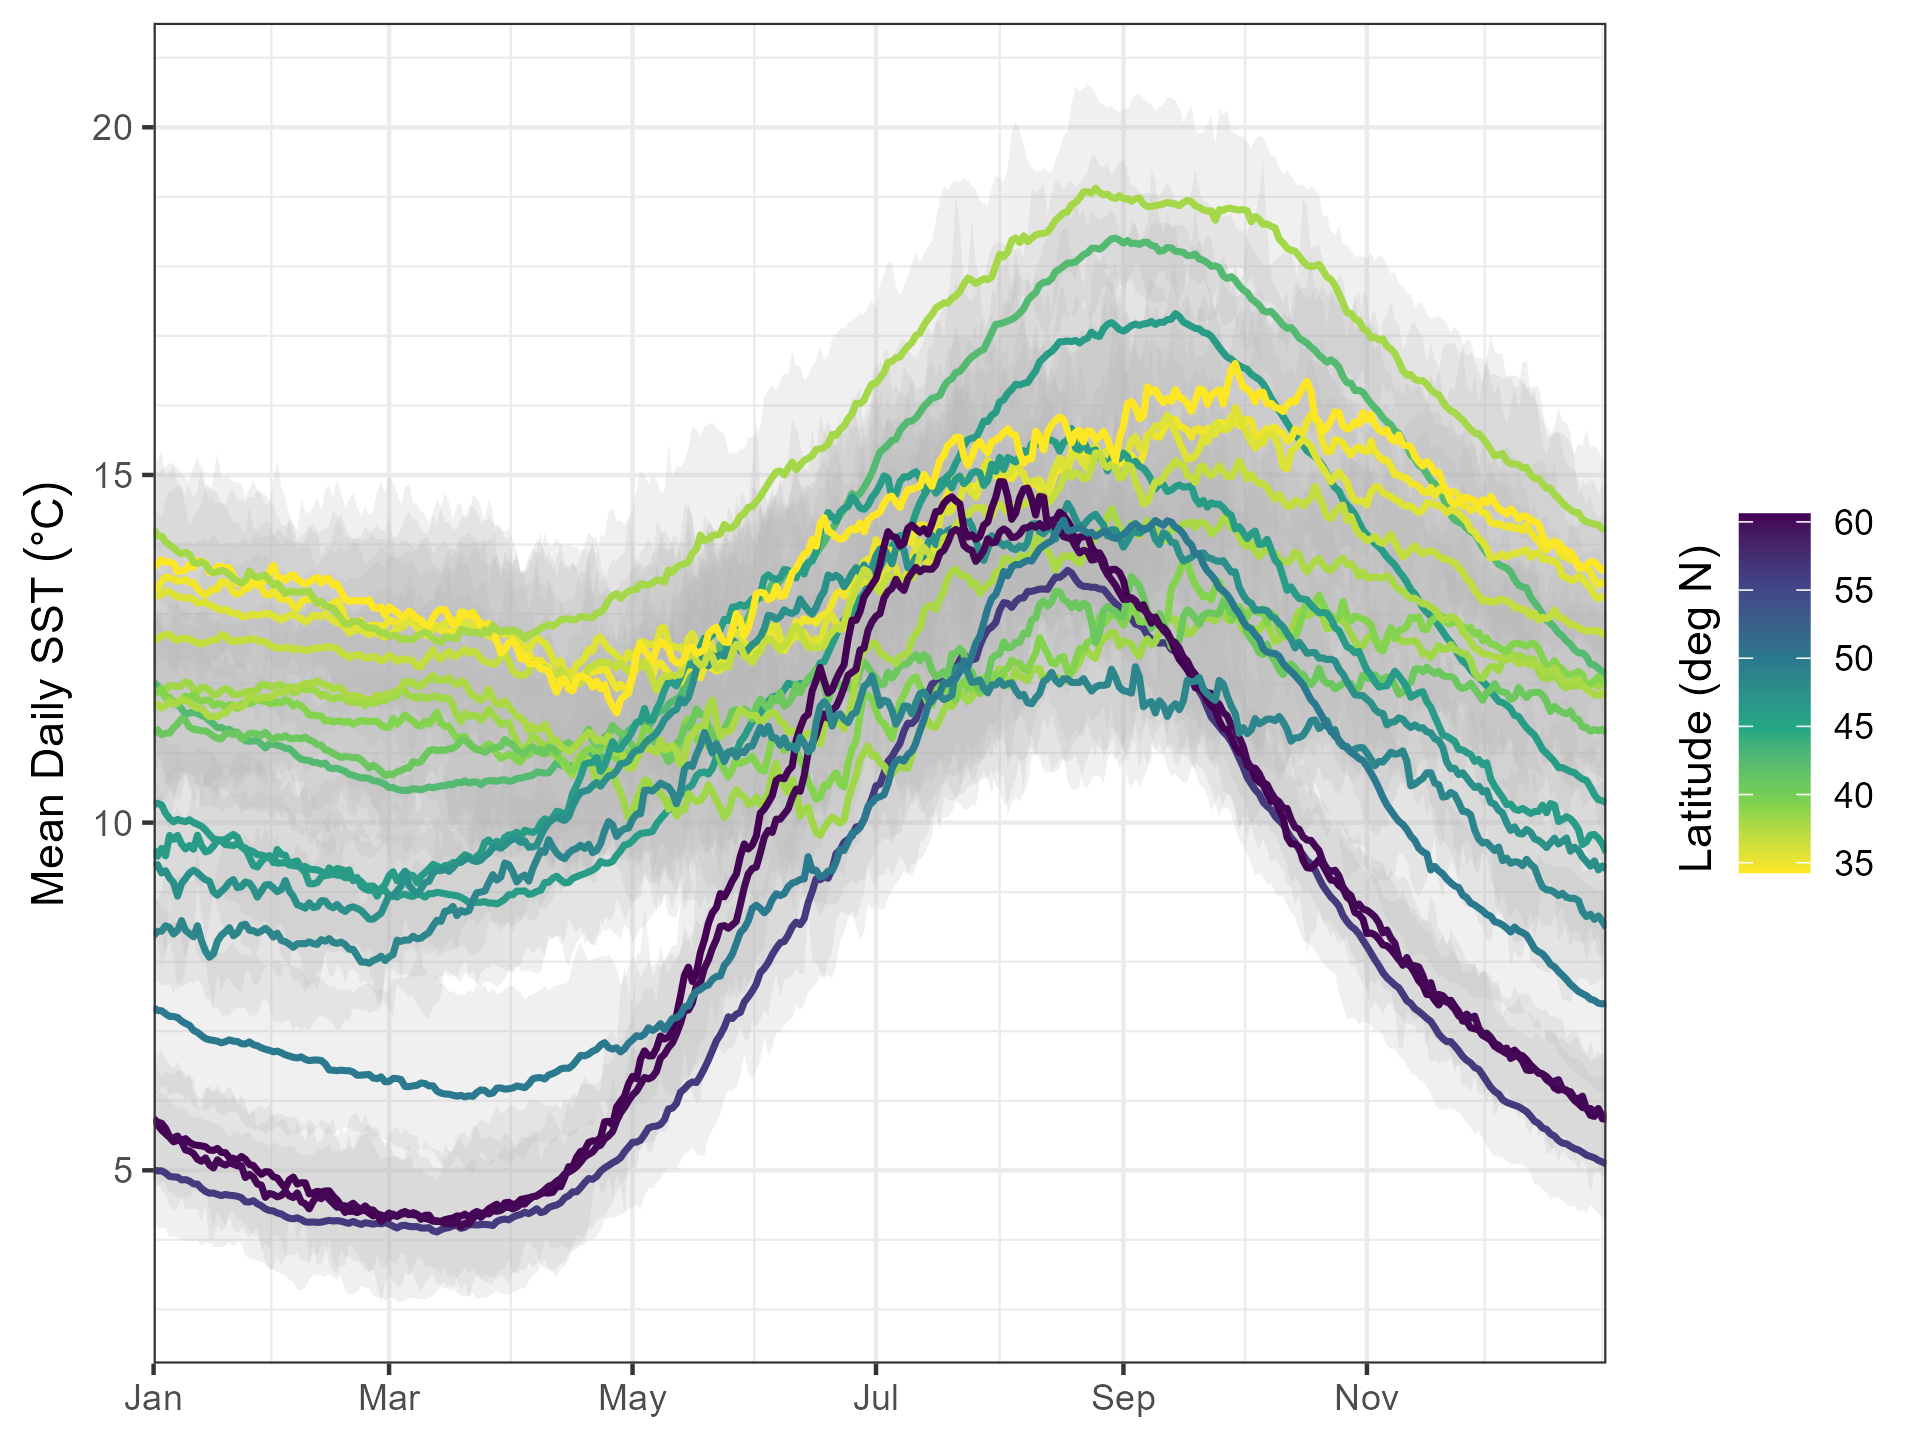
The 1991-2020 temperature climatologies of each buoy are shown. The lines are coloured by latitude, with yellow indicating the buoys located further south, and purple indicating the buoys located in the northern Gulf of Alaska.

The 1991-2020 temperature climatologies of each buoy are shown. The lines are coloured by latitude, with yellow indicating the buoys located further south, and purple indicating the buoys located in the northern Gulf of Alaska.

Latest week of data

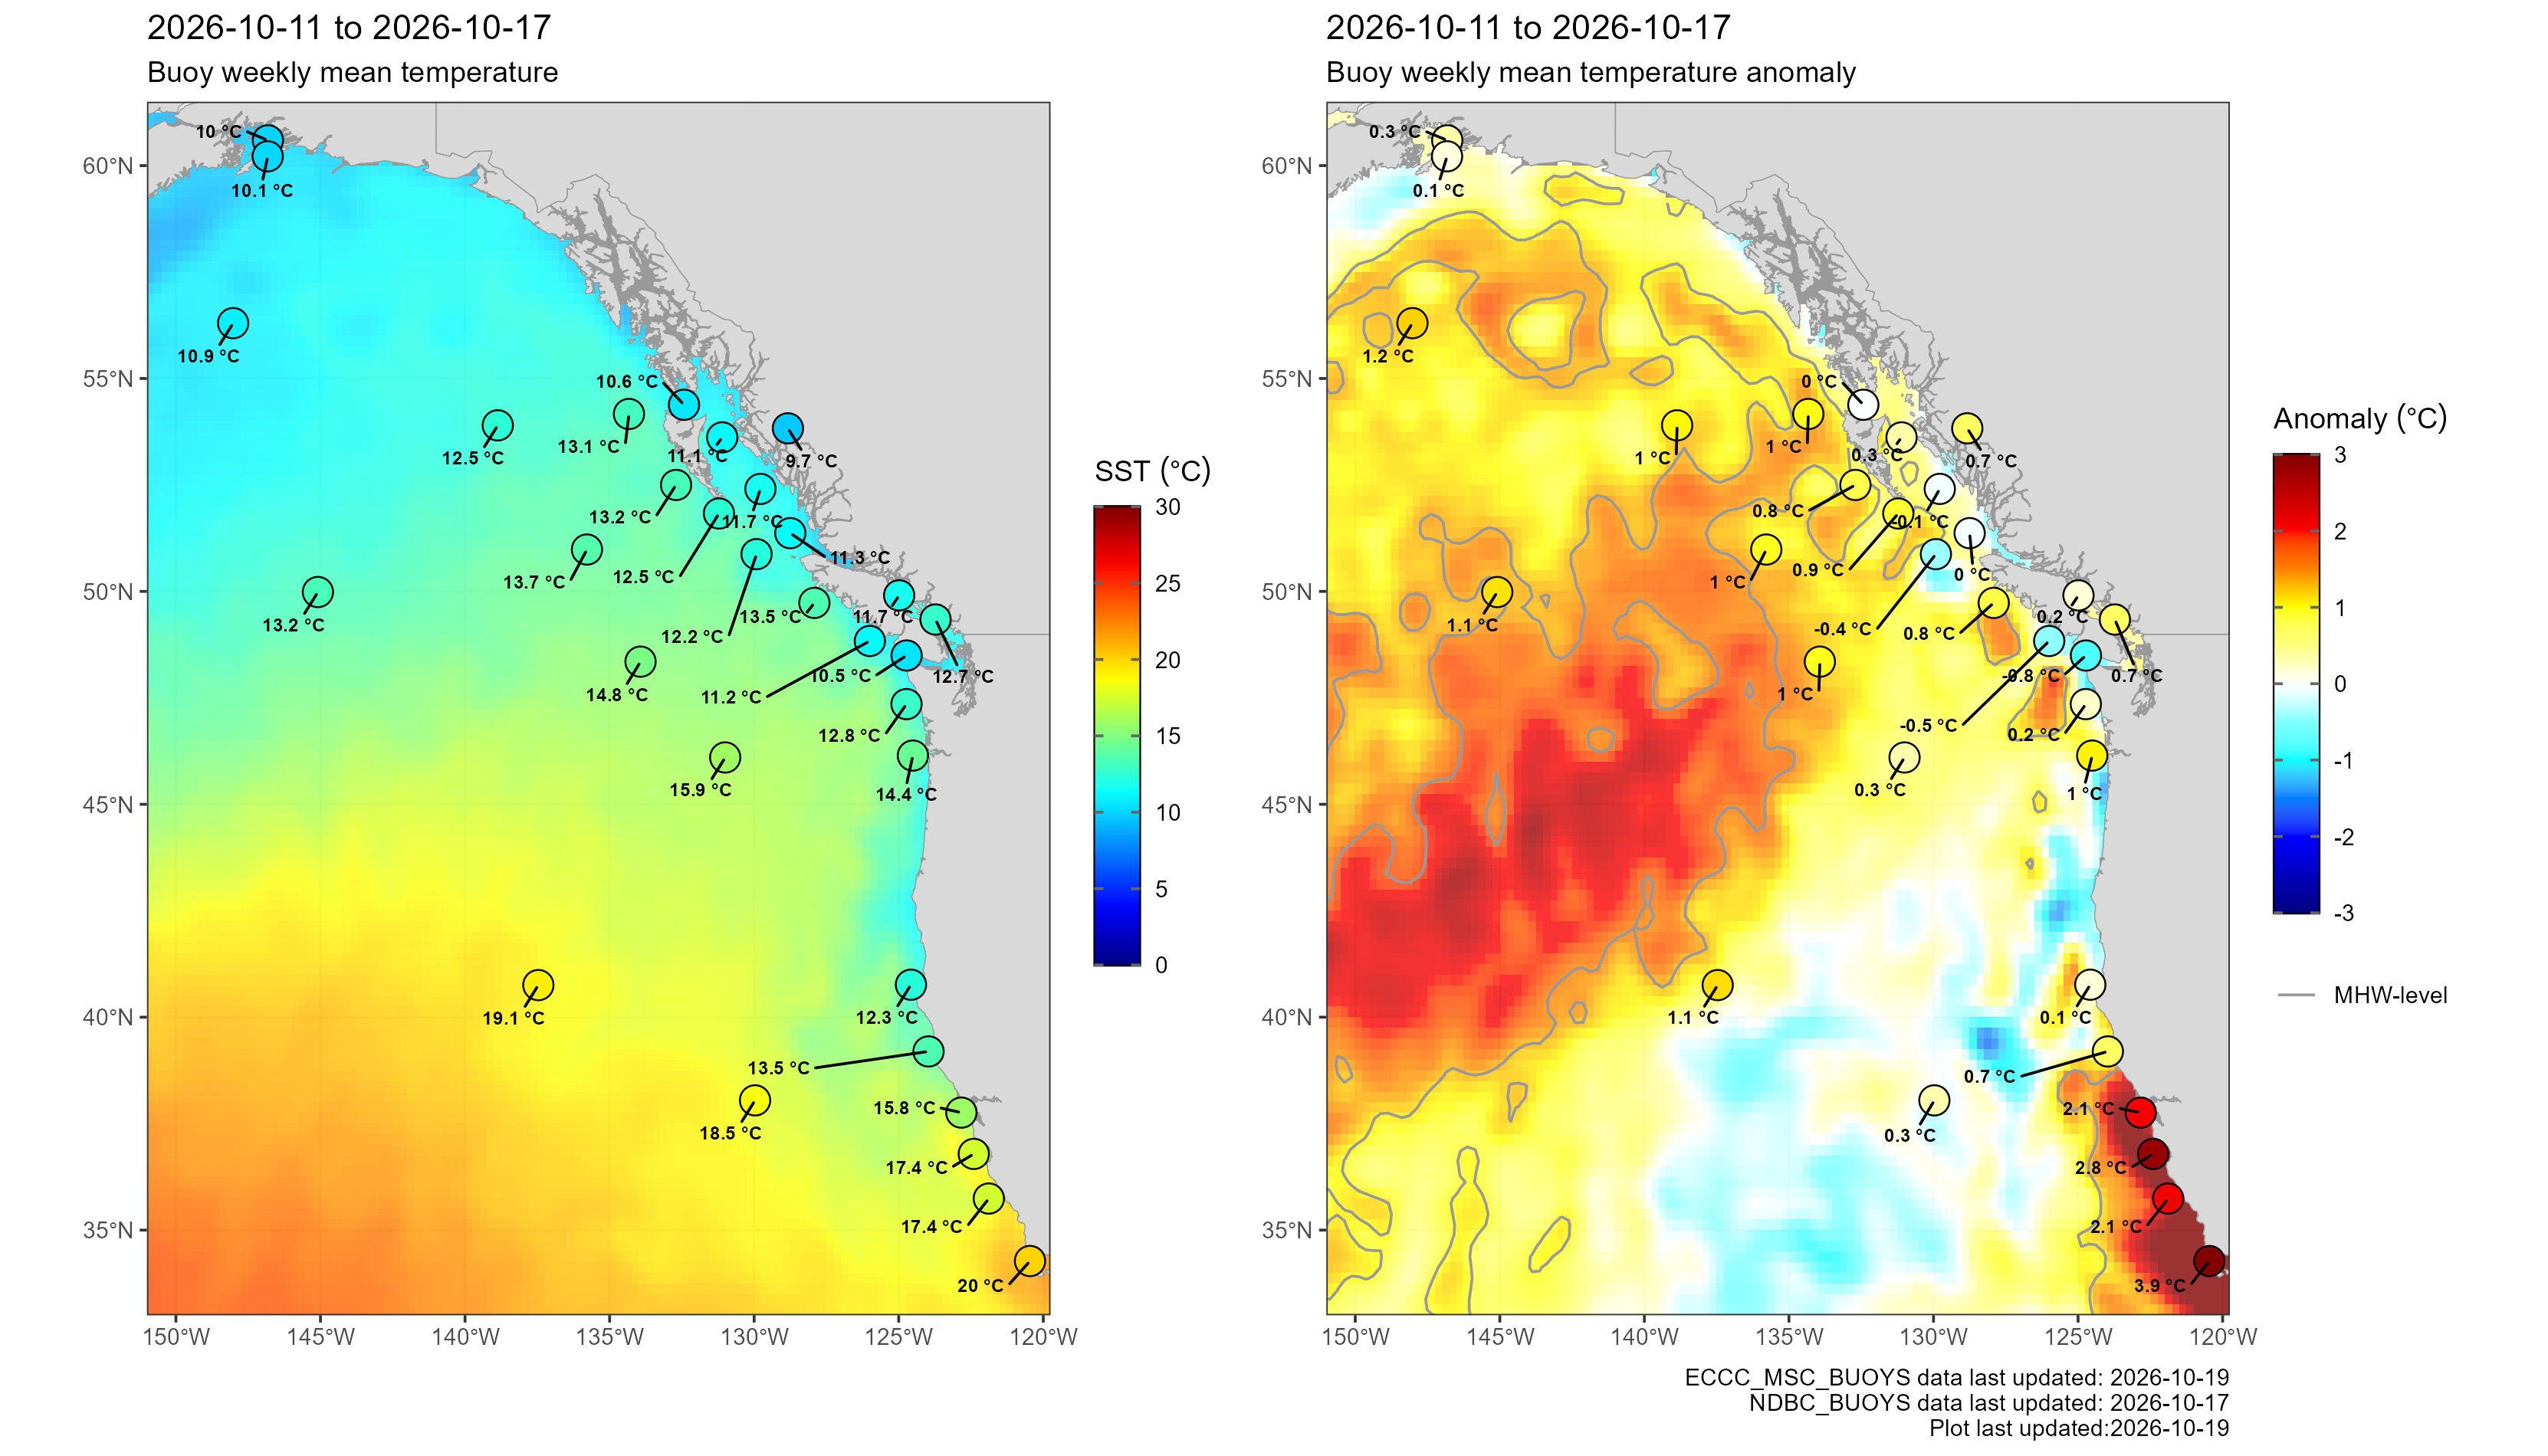
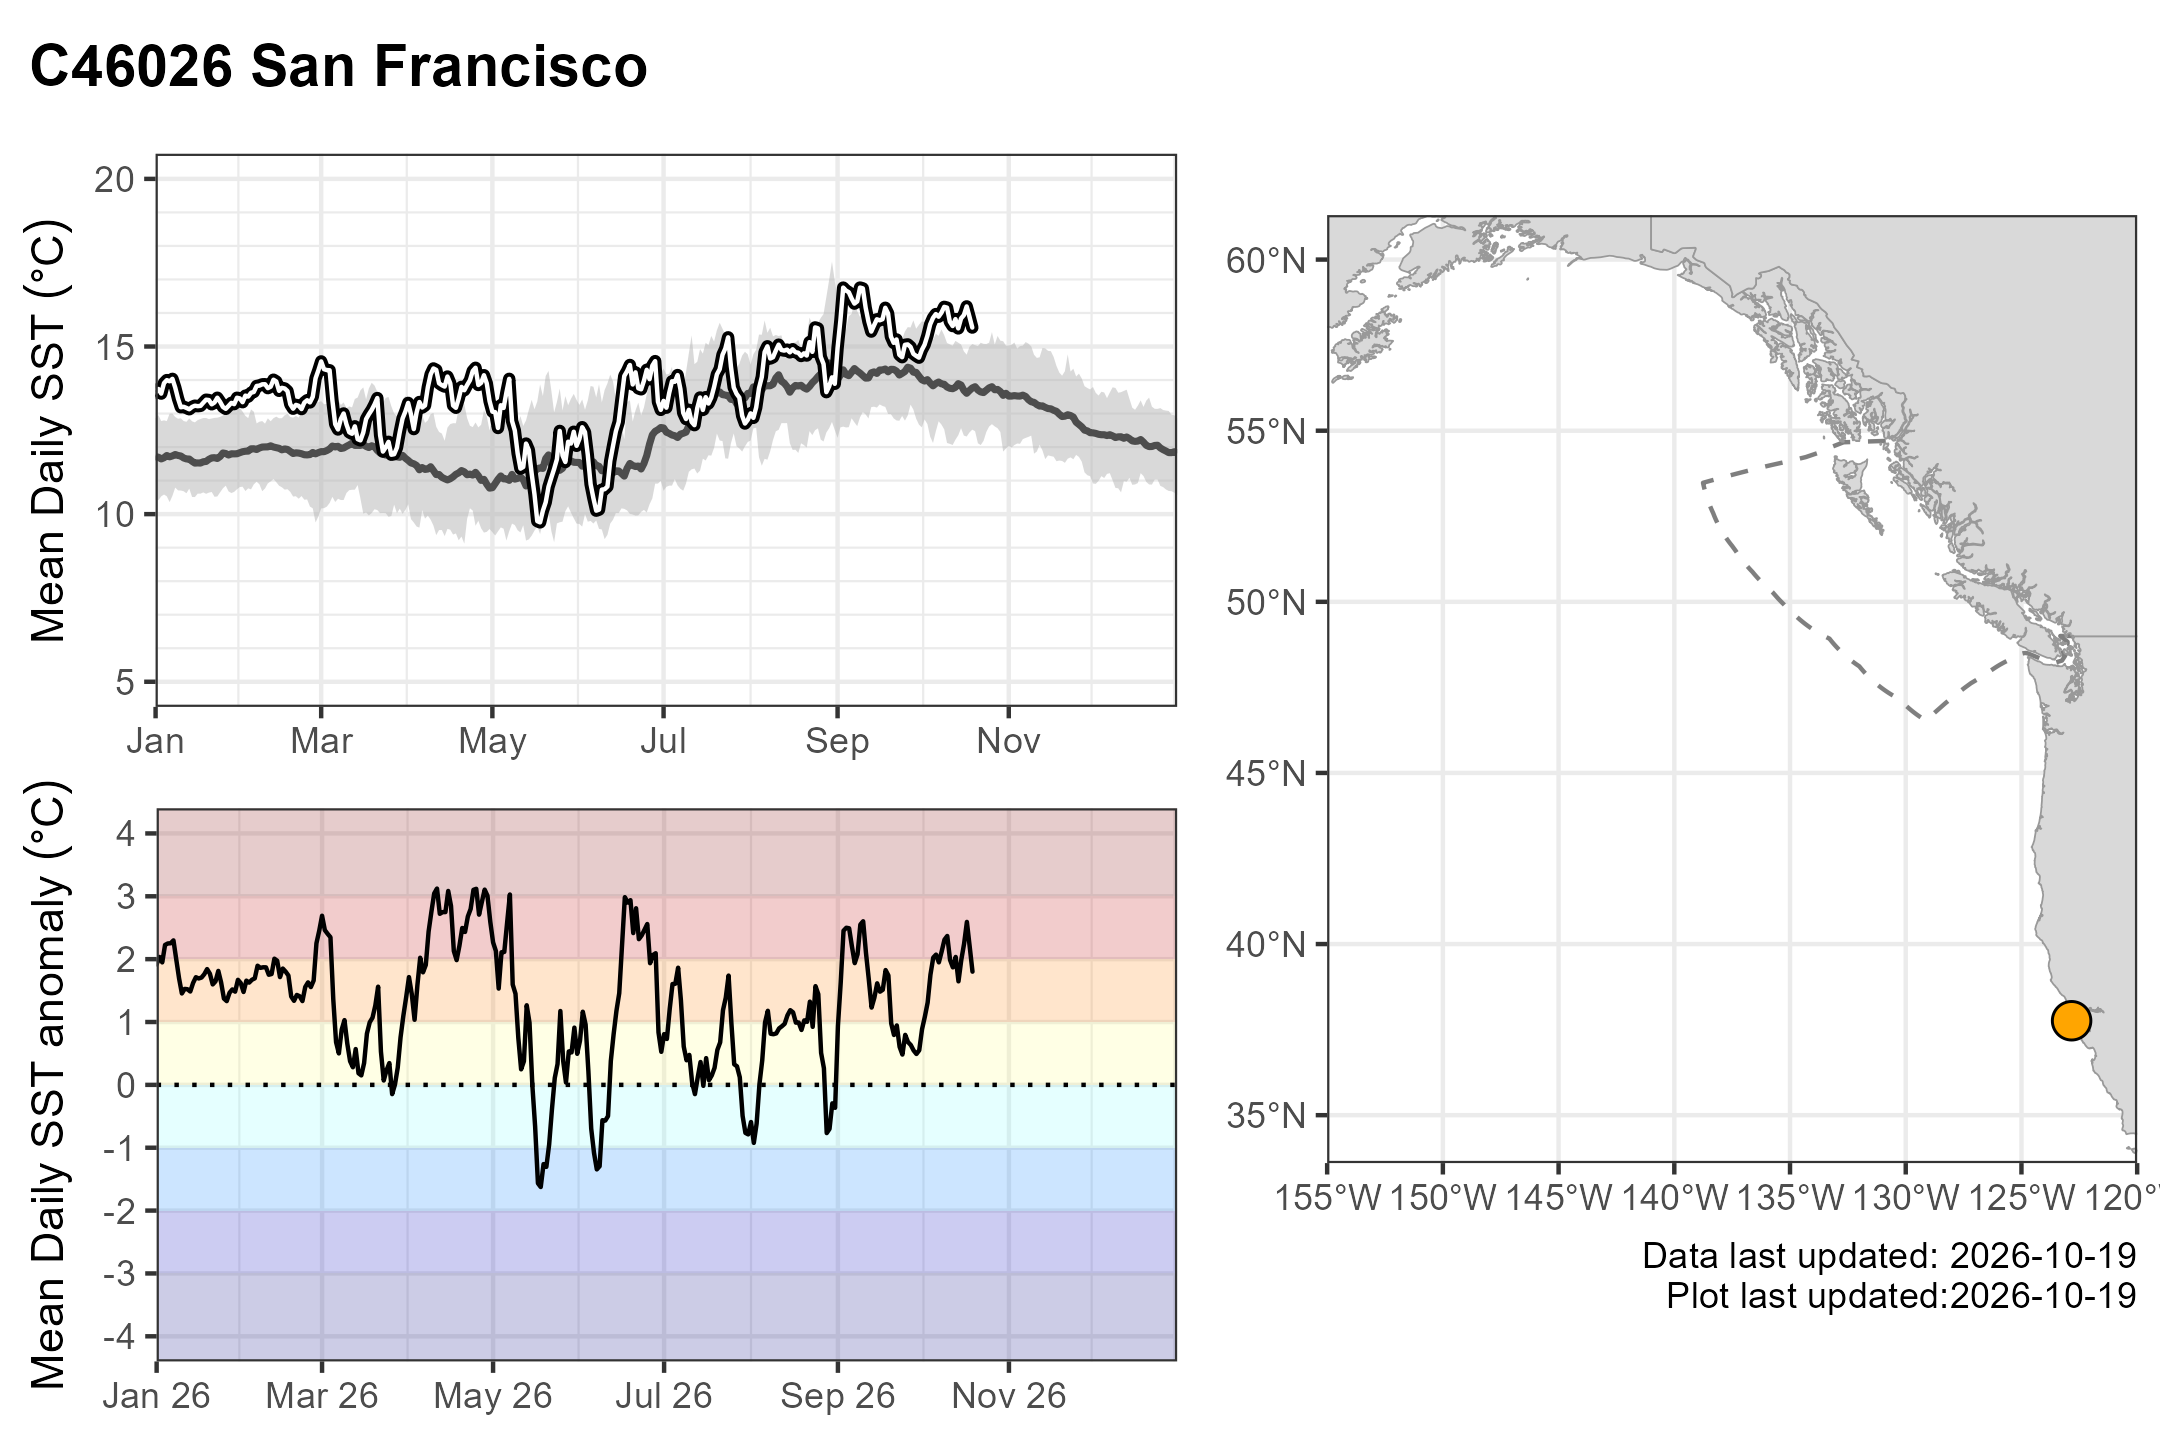
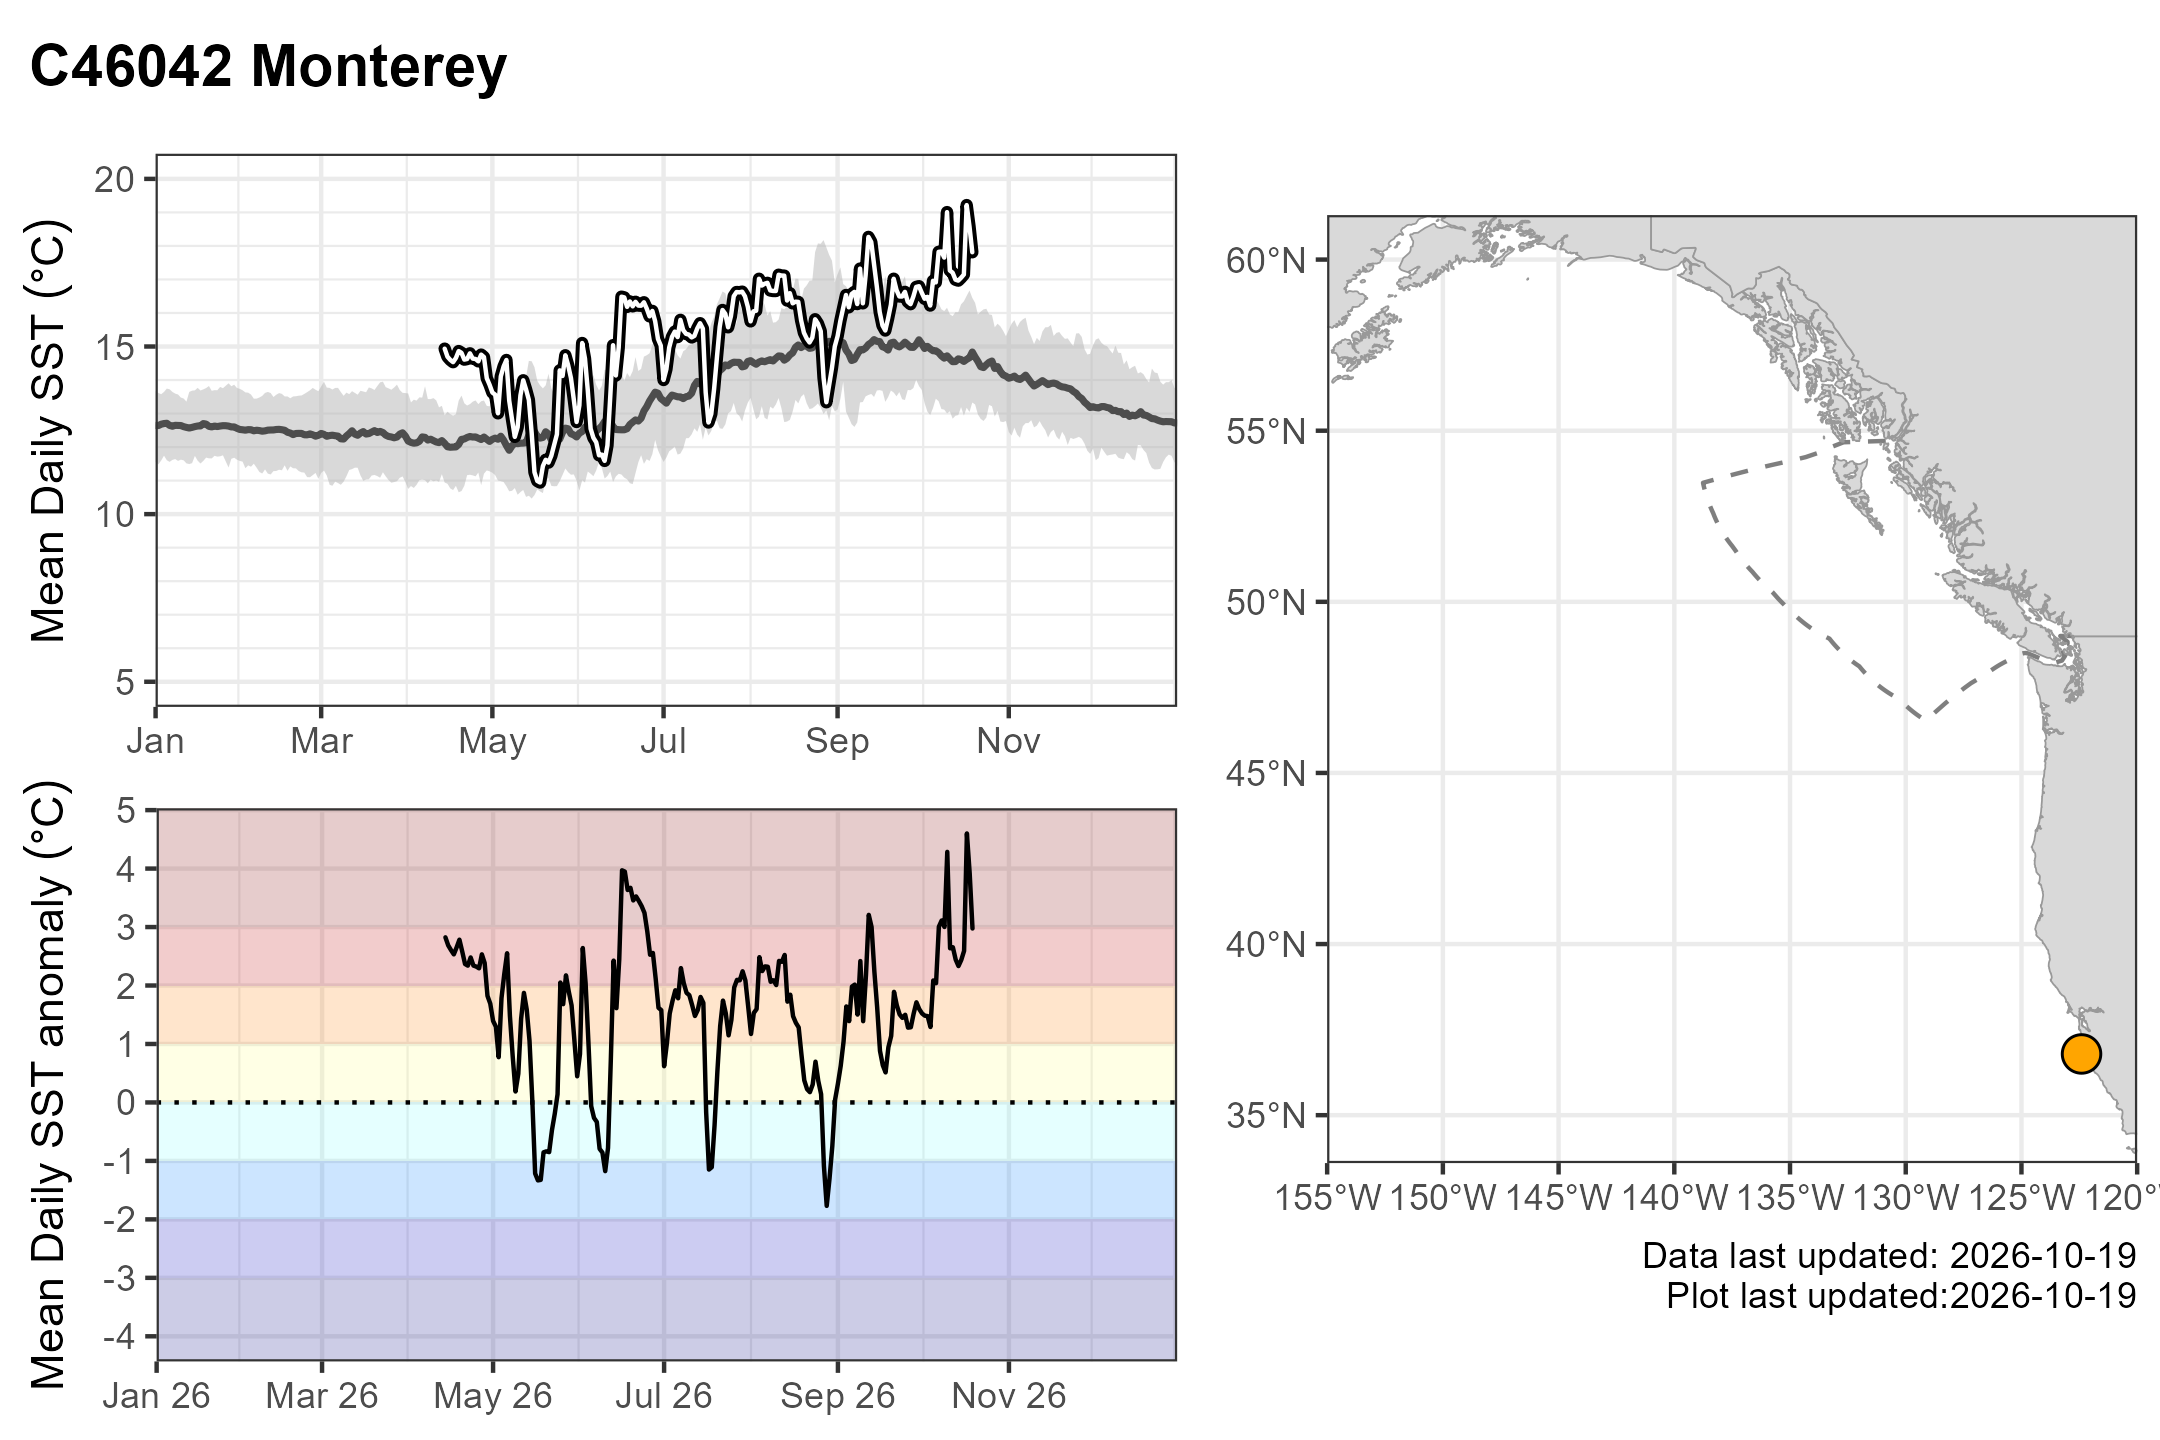
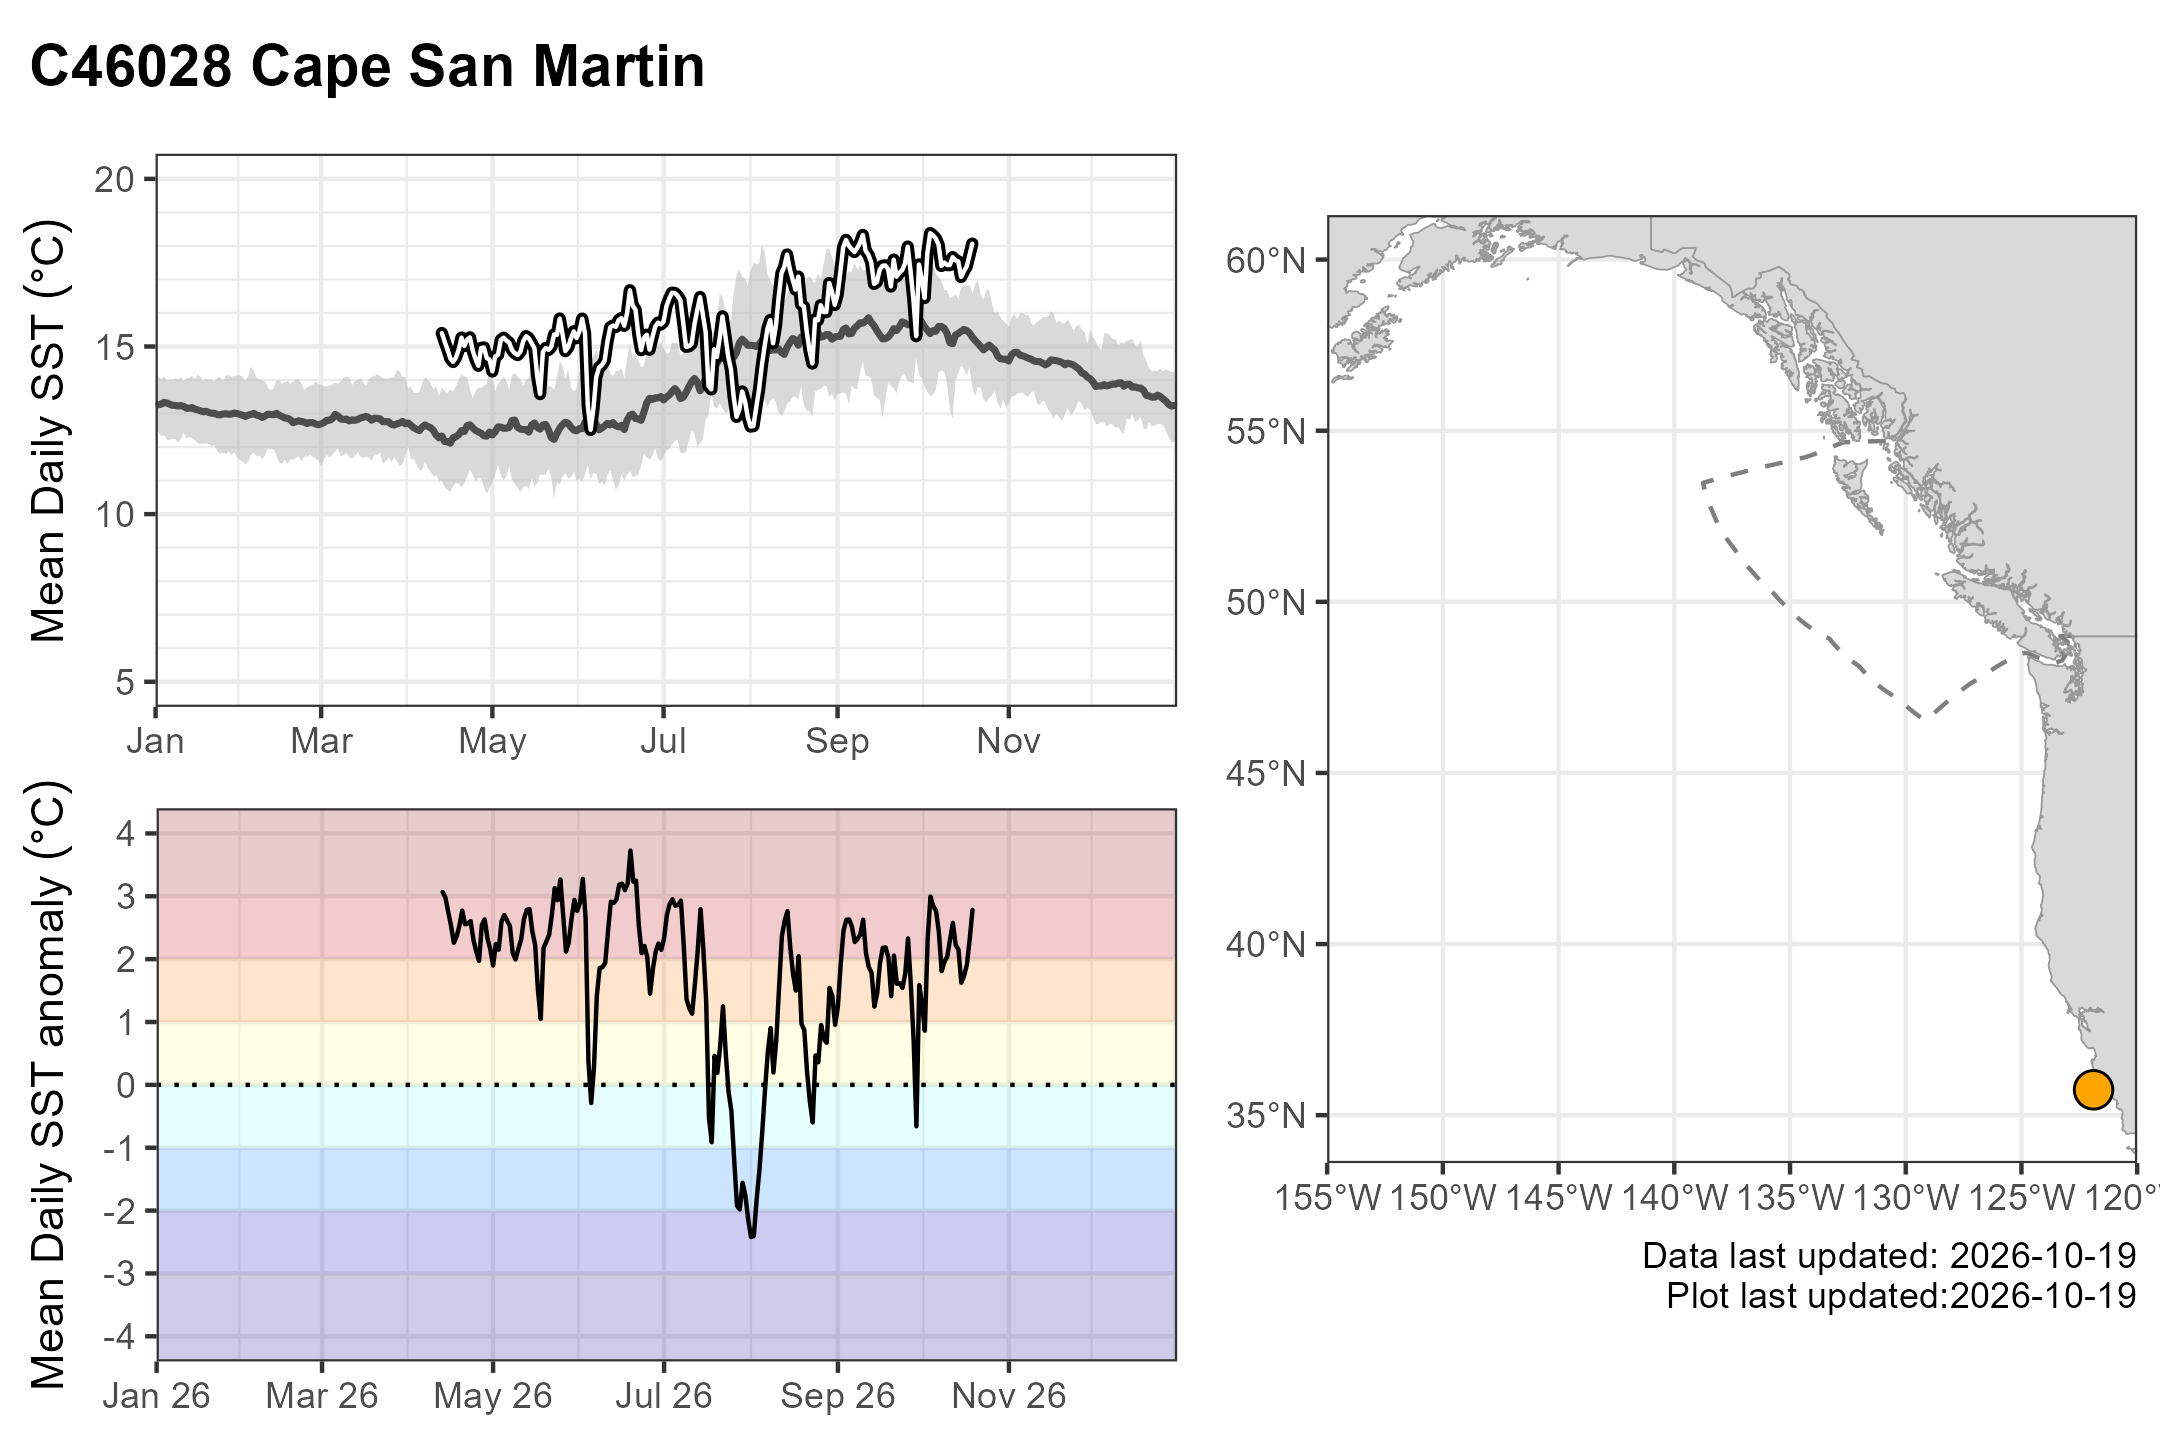
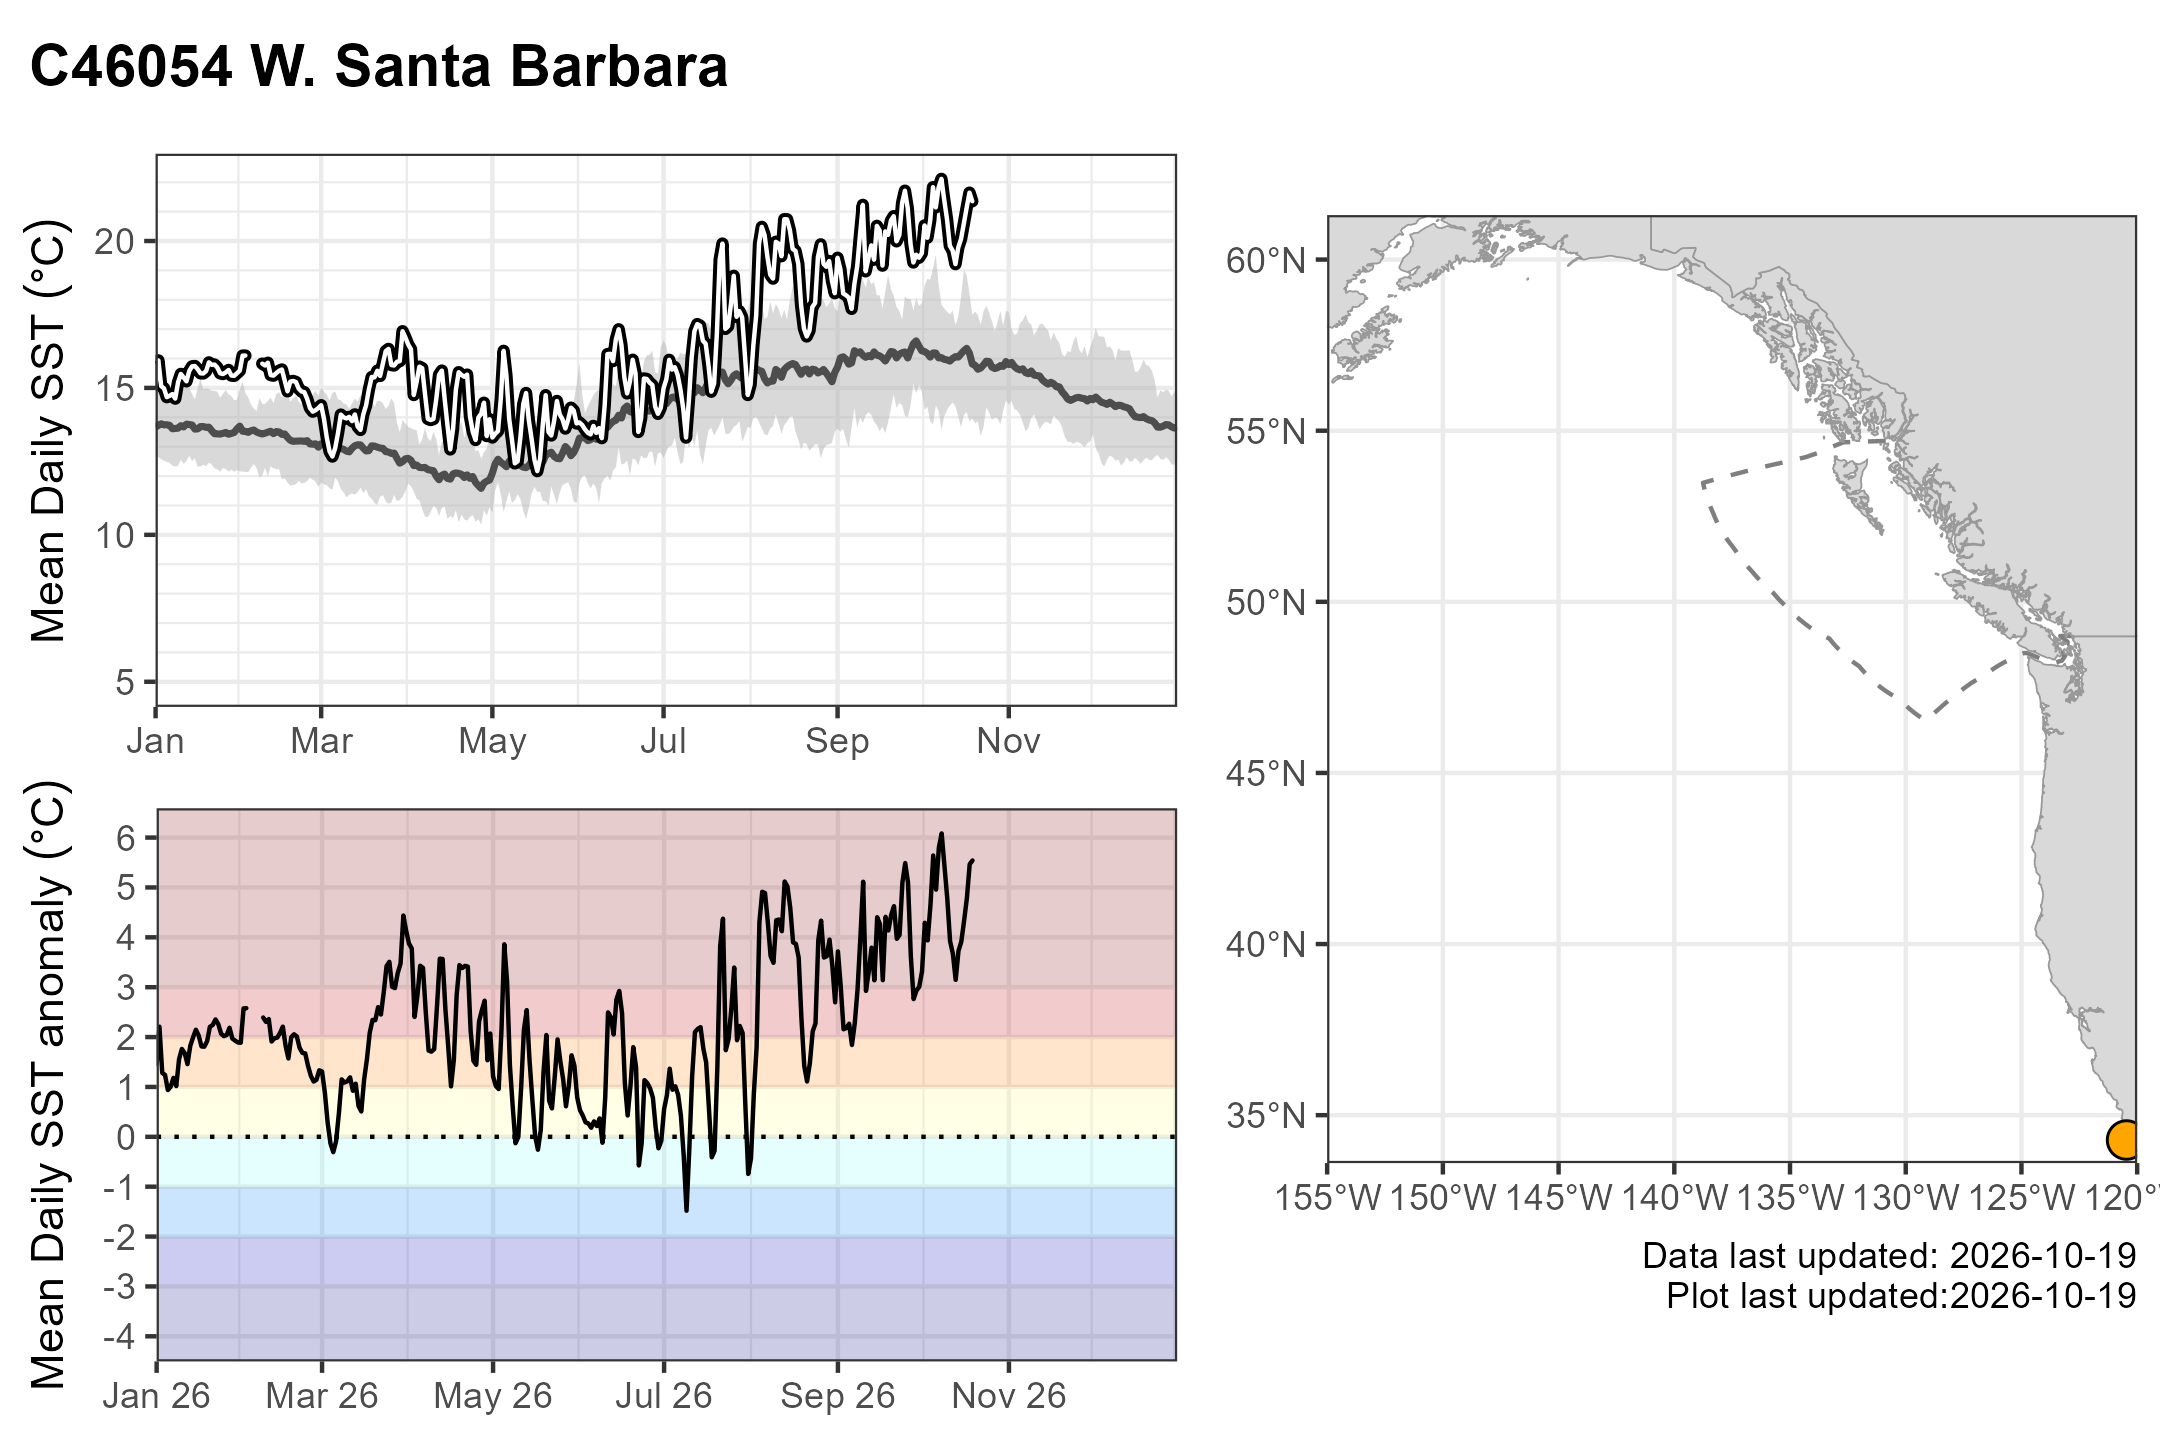
Coloured circles indicate the weekly SST and SST anomaly at buoy locations (see collapsed location maps above), averaged weekly to correspond to the OISST maps on the previous page.

Coloured circles indicate the weekly SST and SST anomaly at buoy locations (see collapsed location maps above), averaged weekly to correspond to the OISST maps on the previous page.
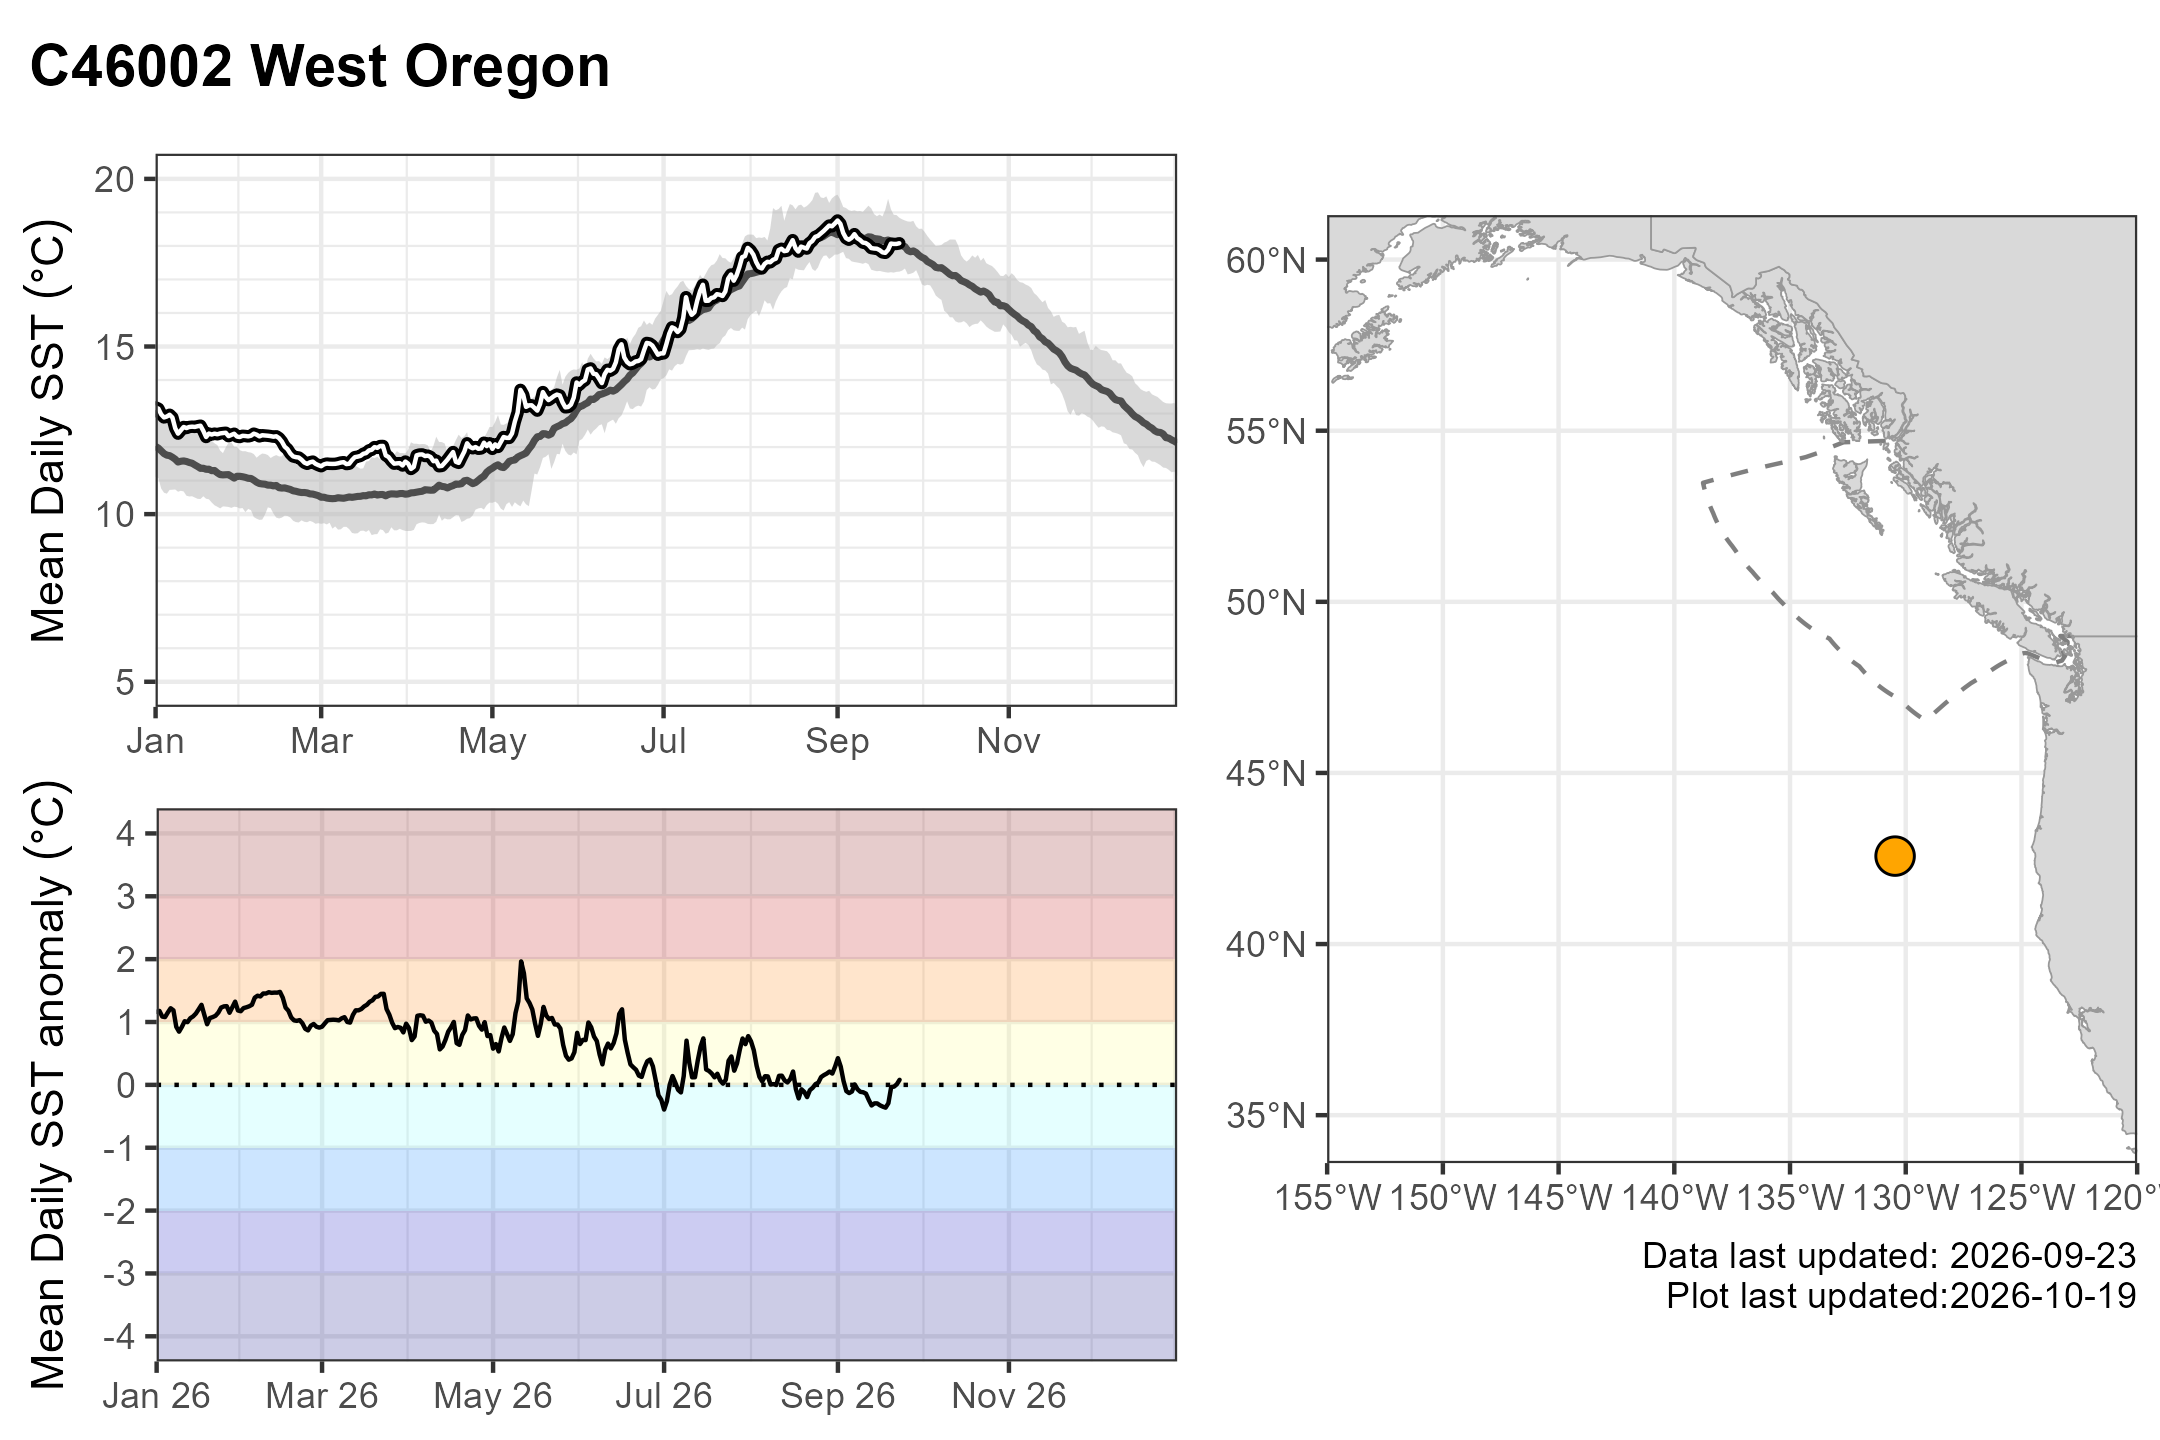
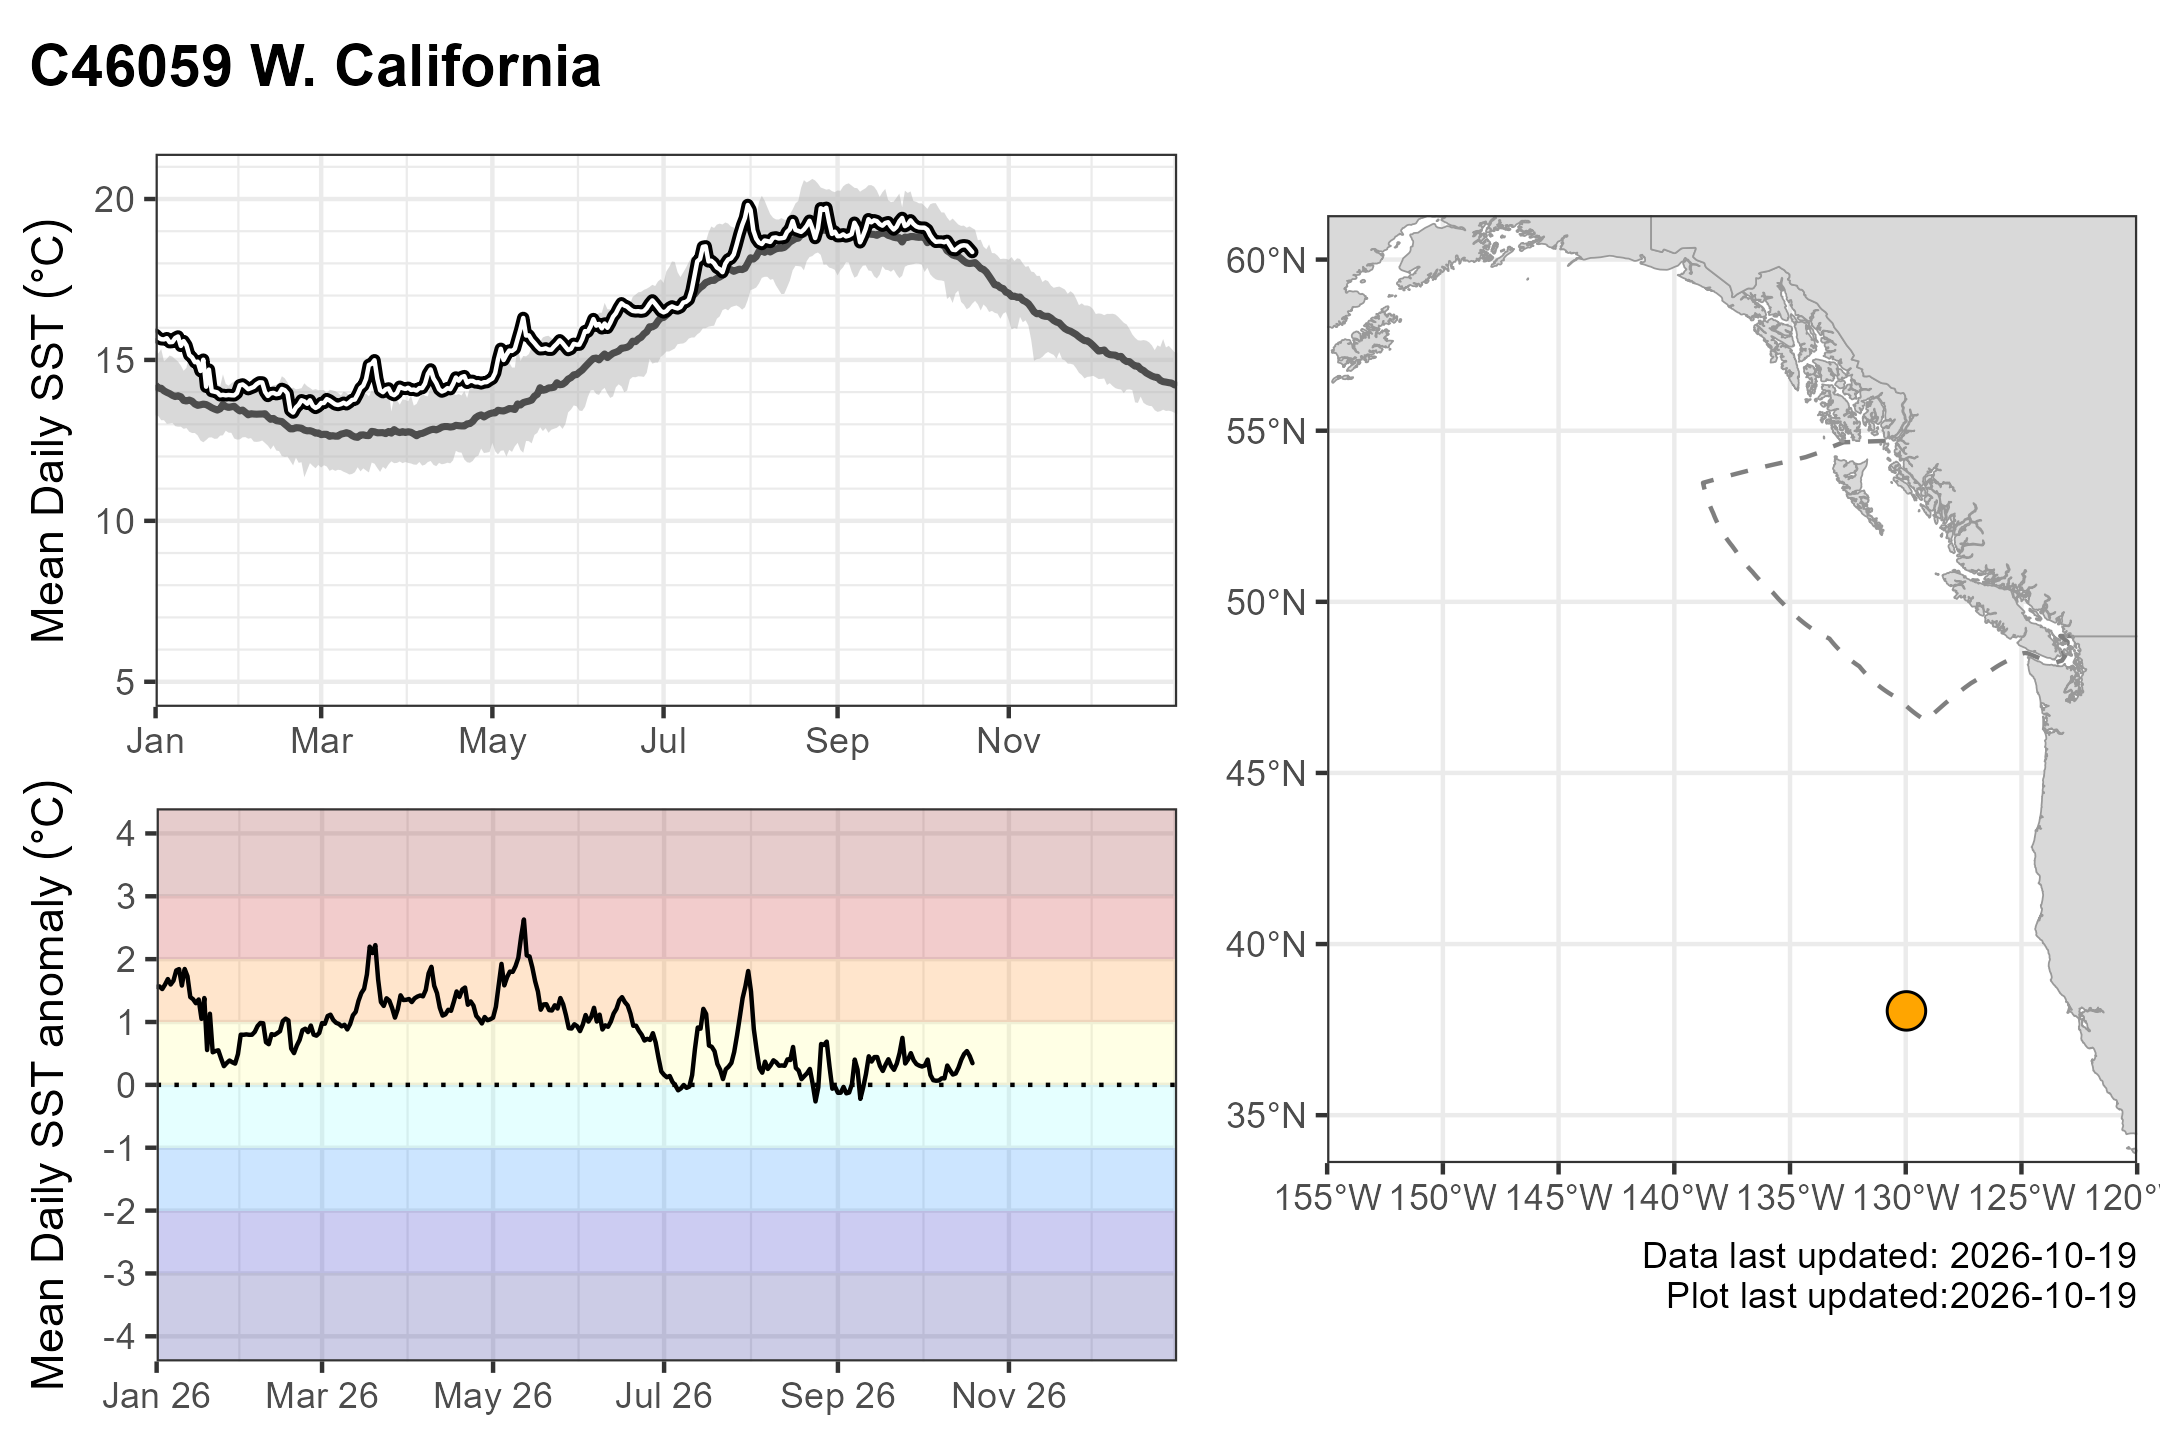
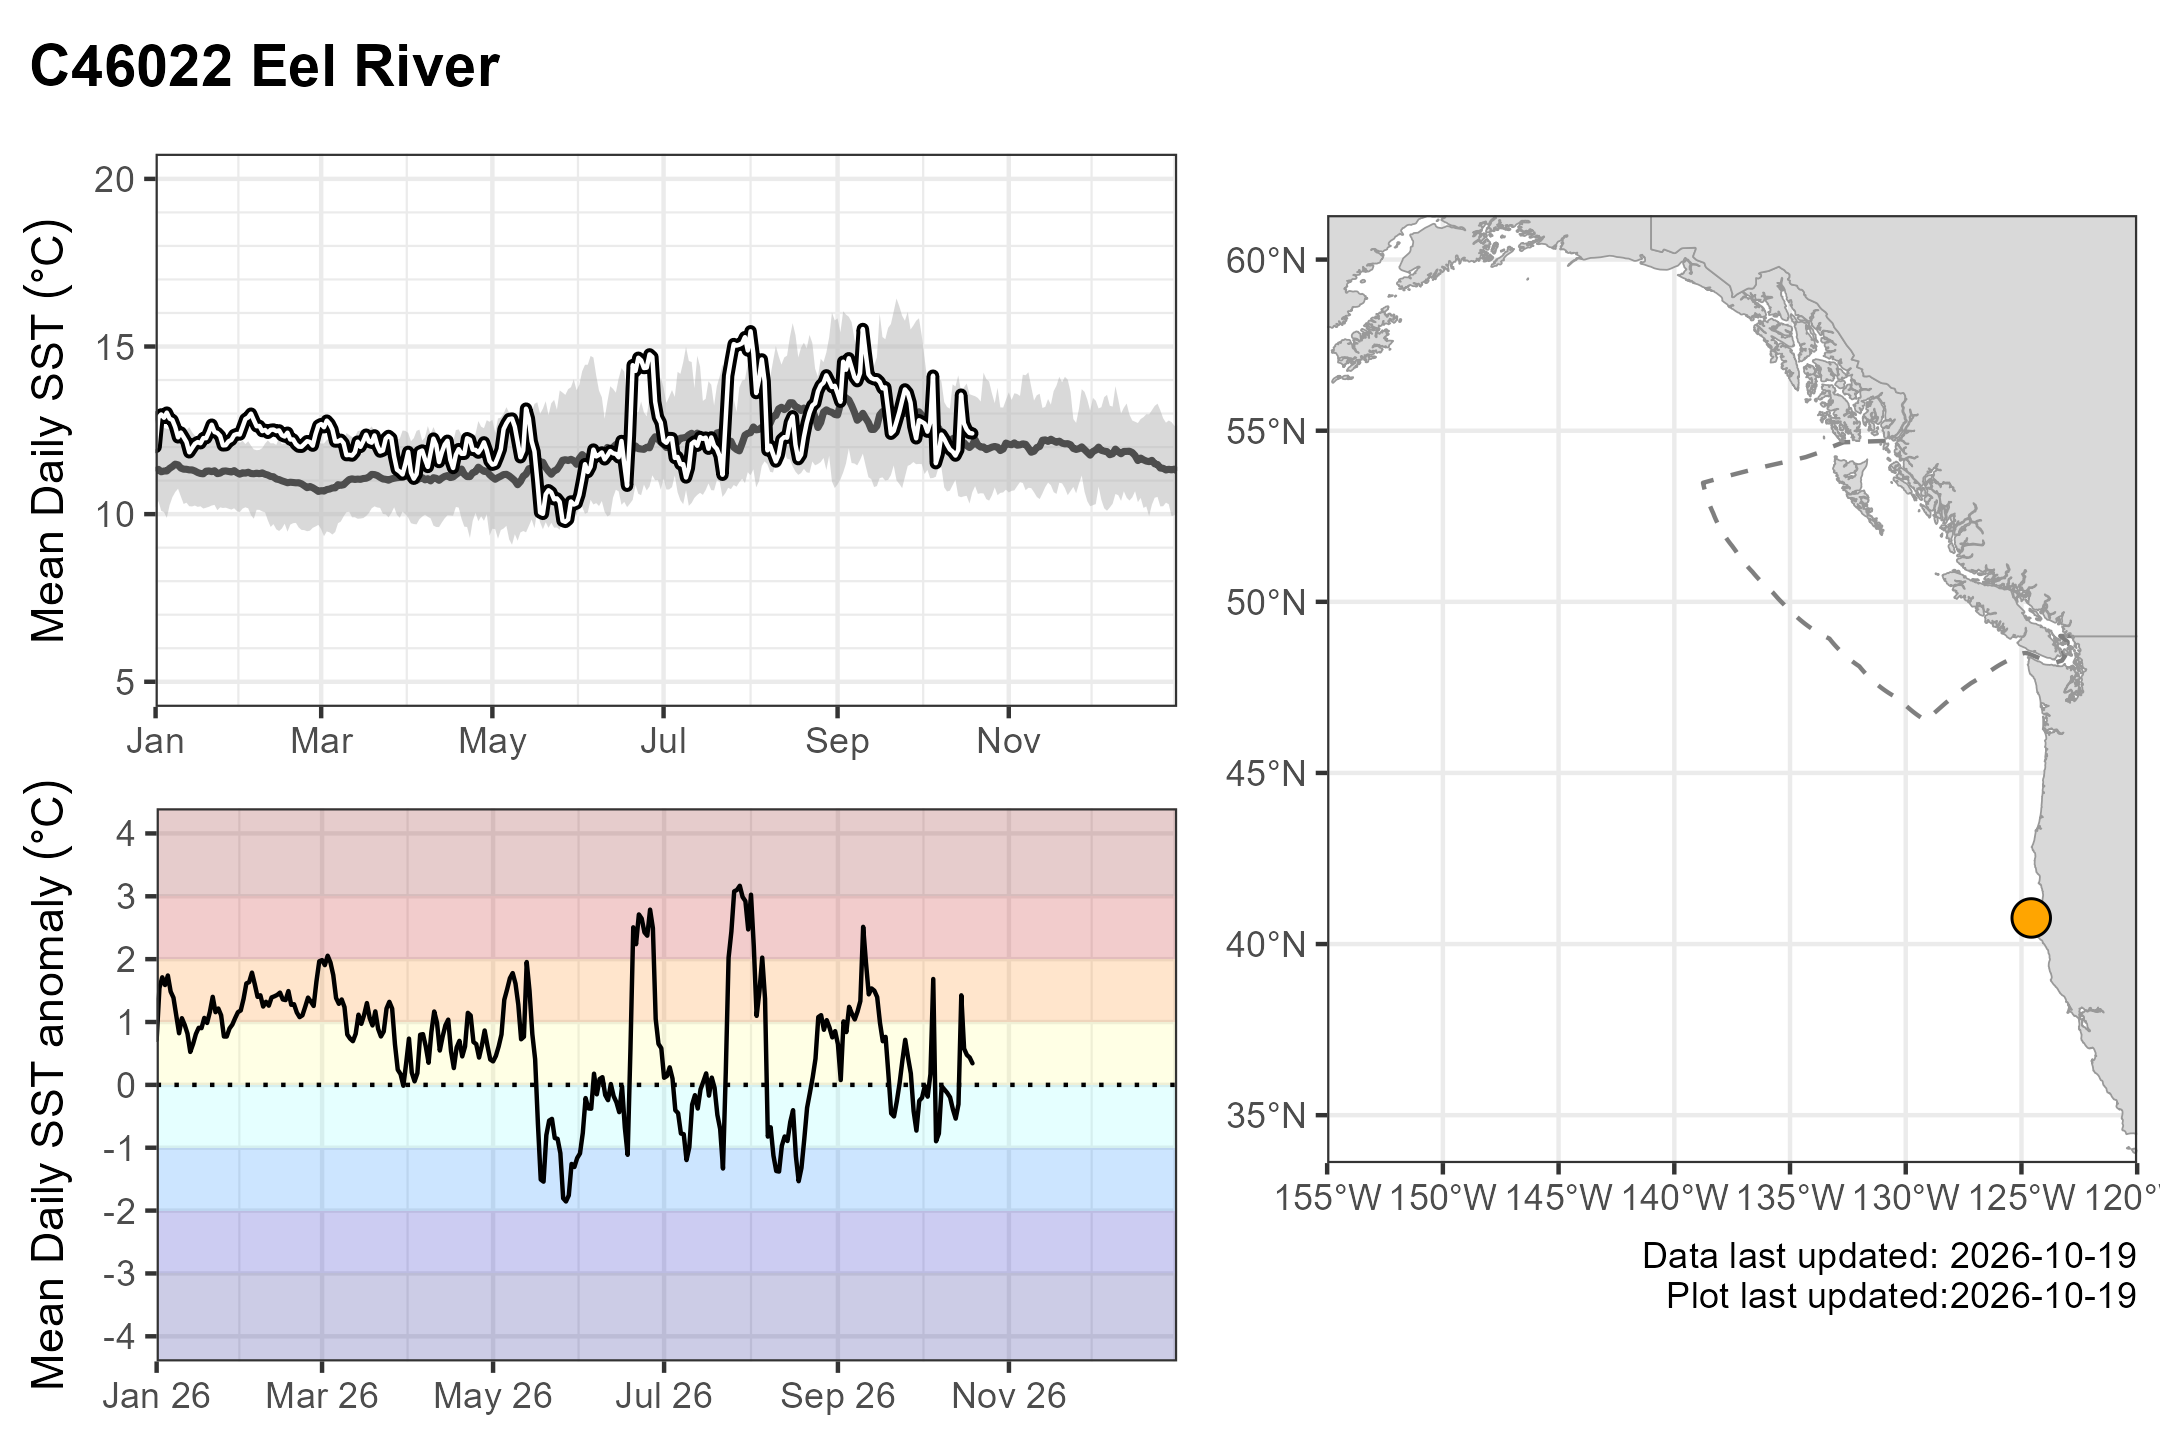
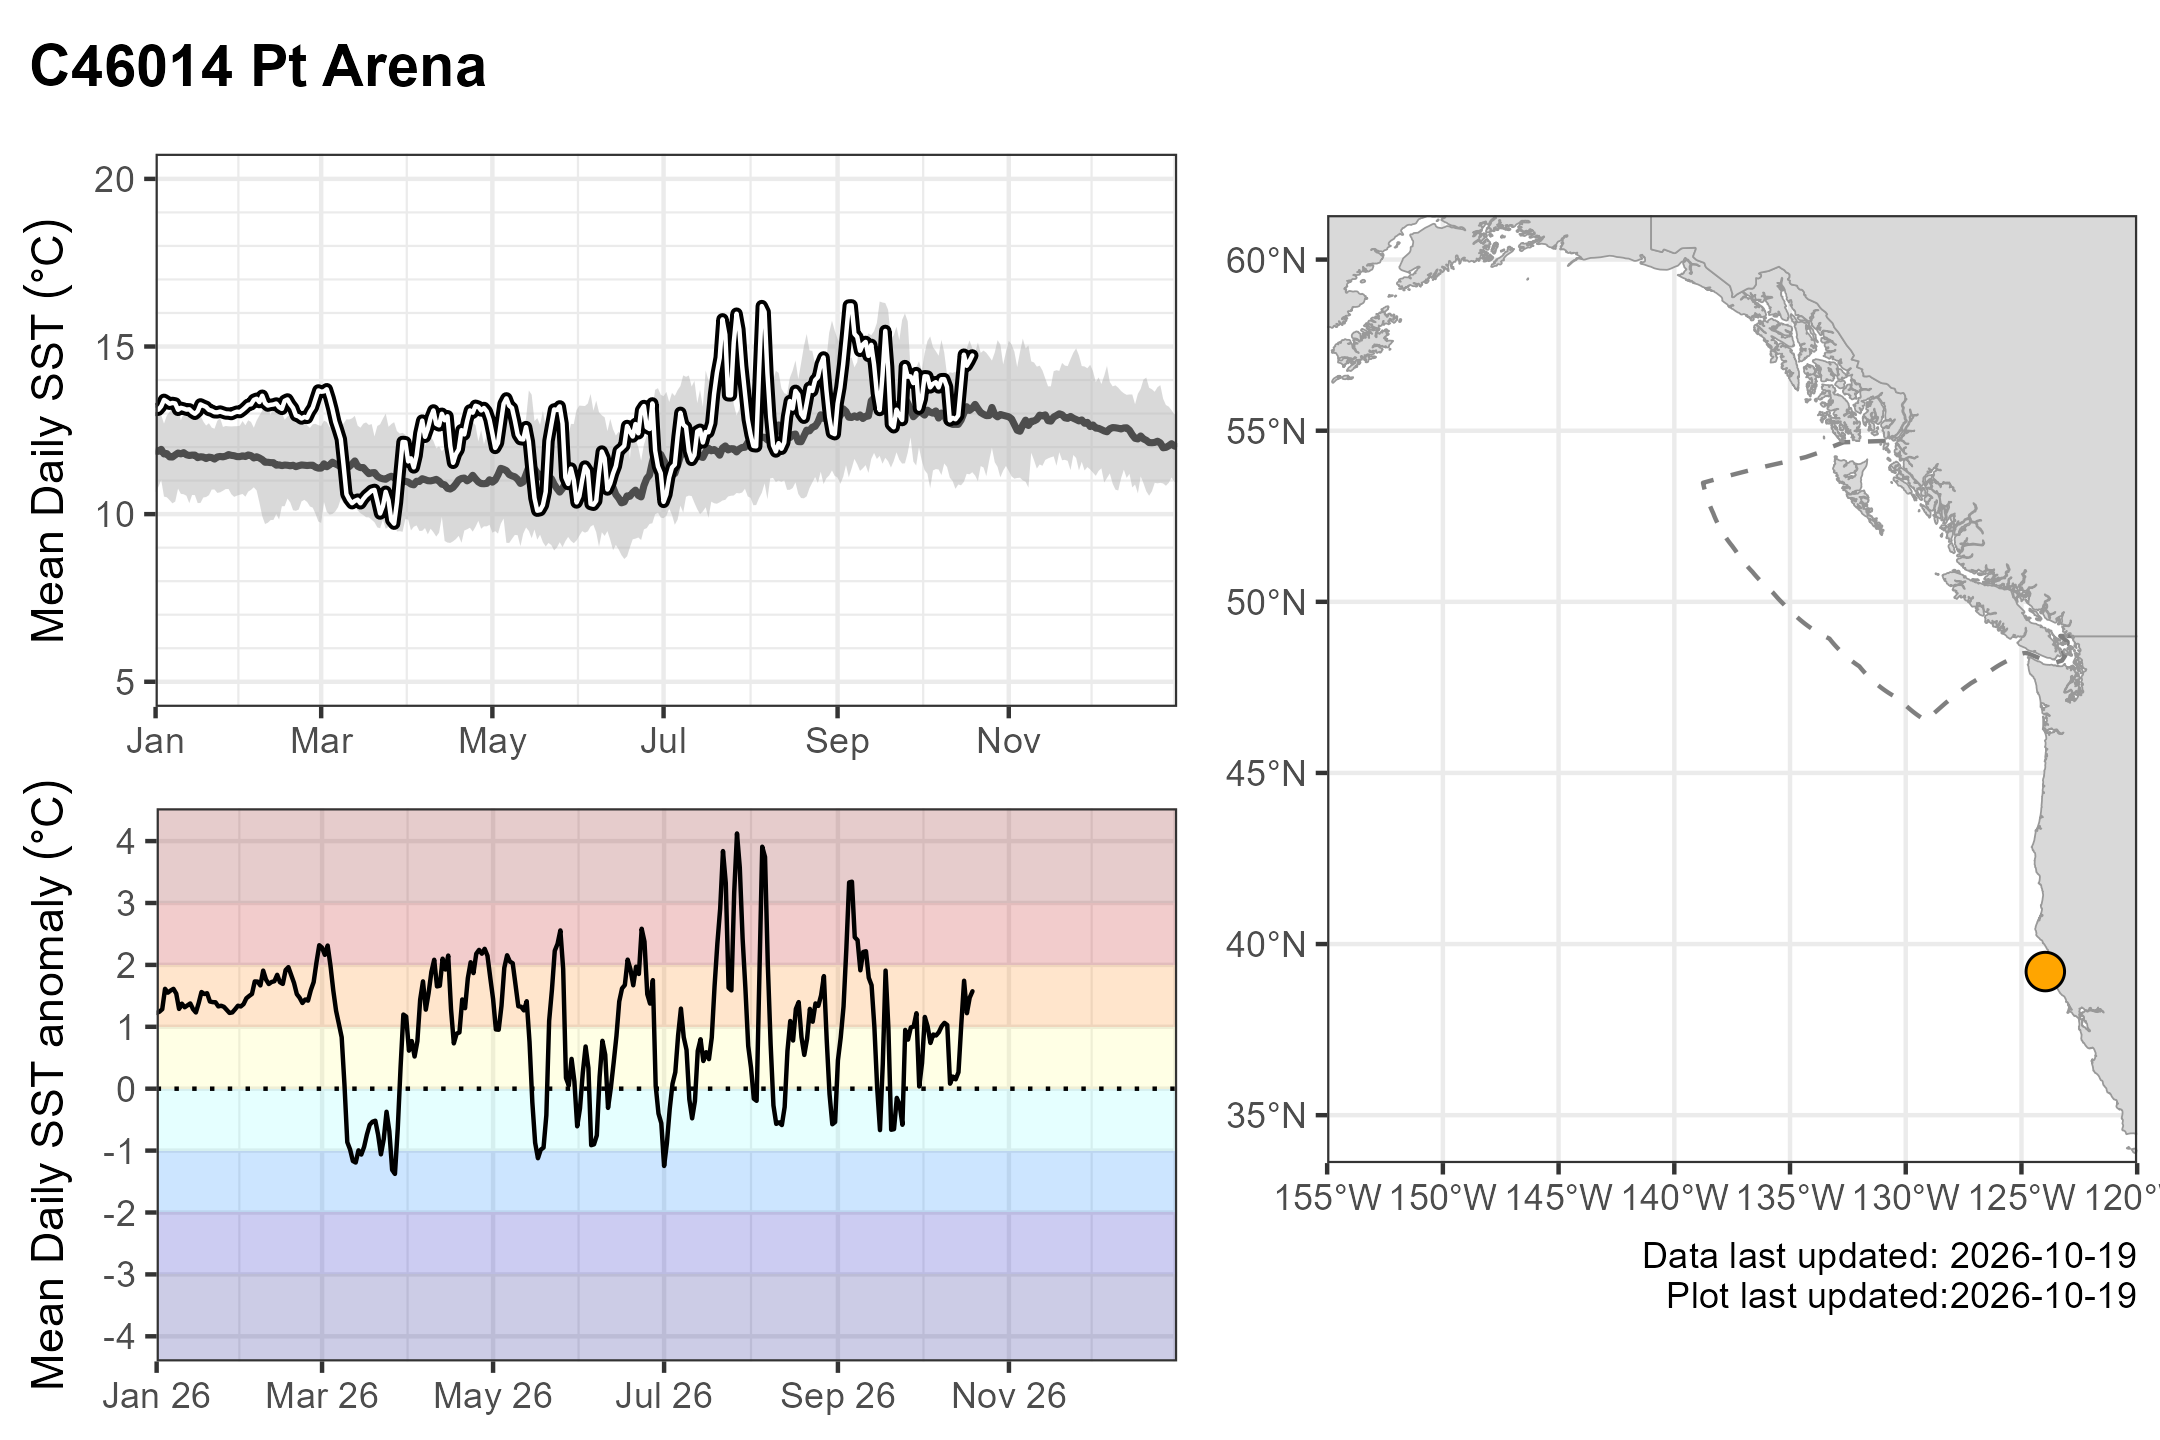
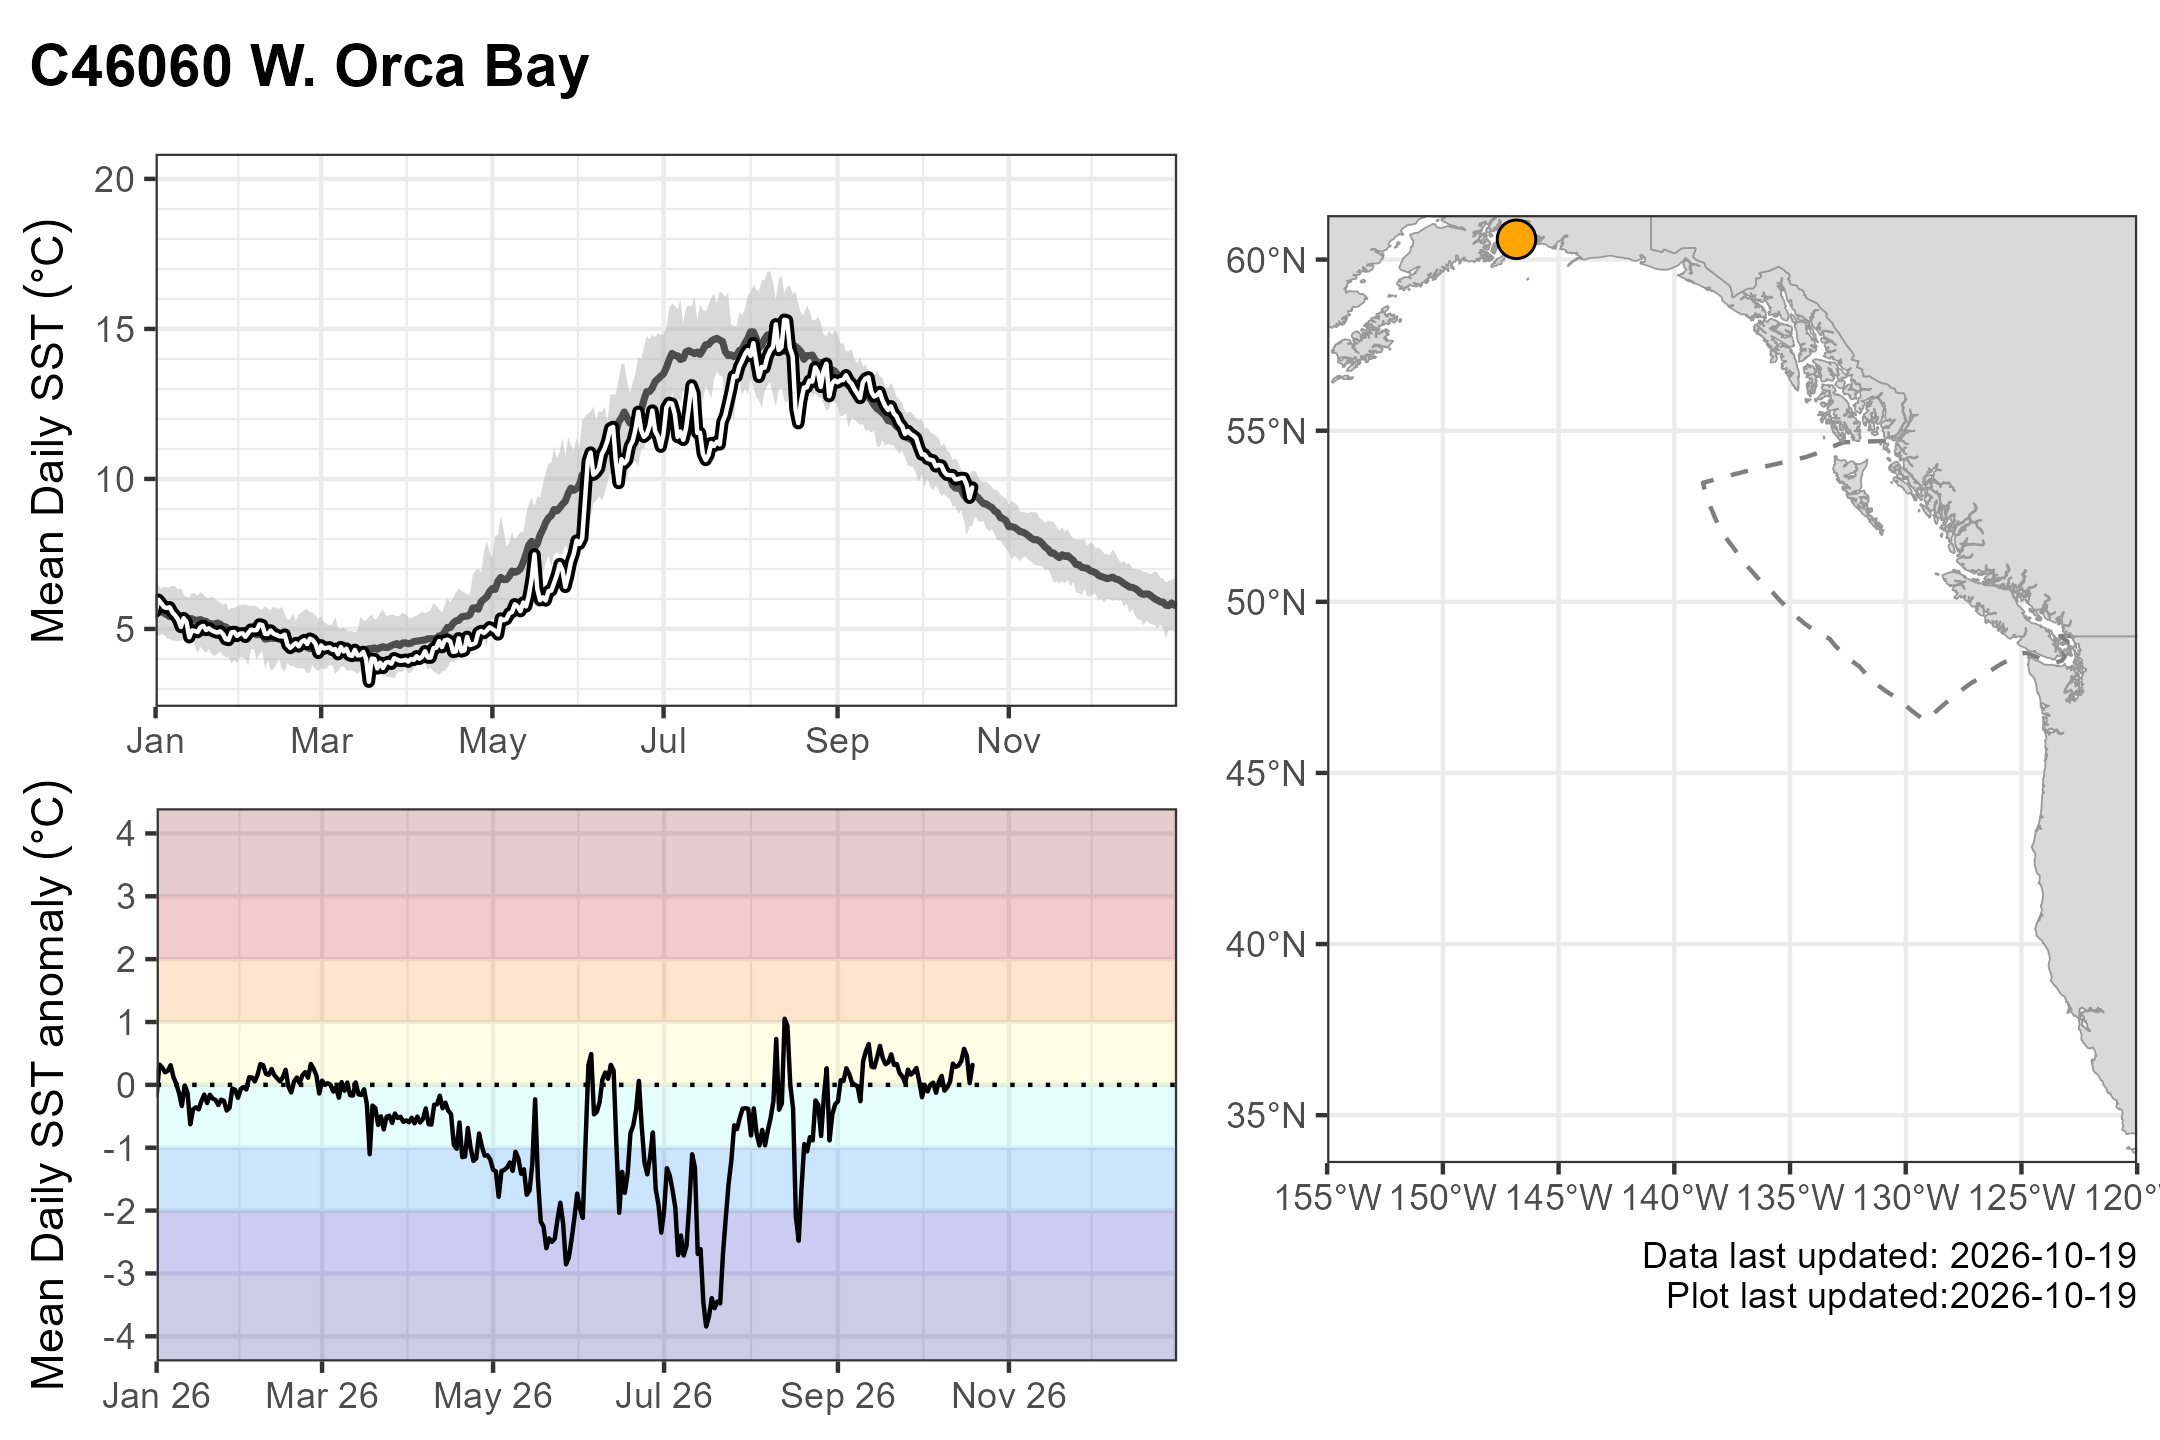
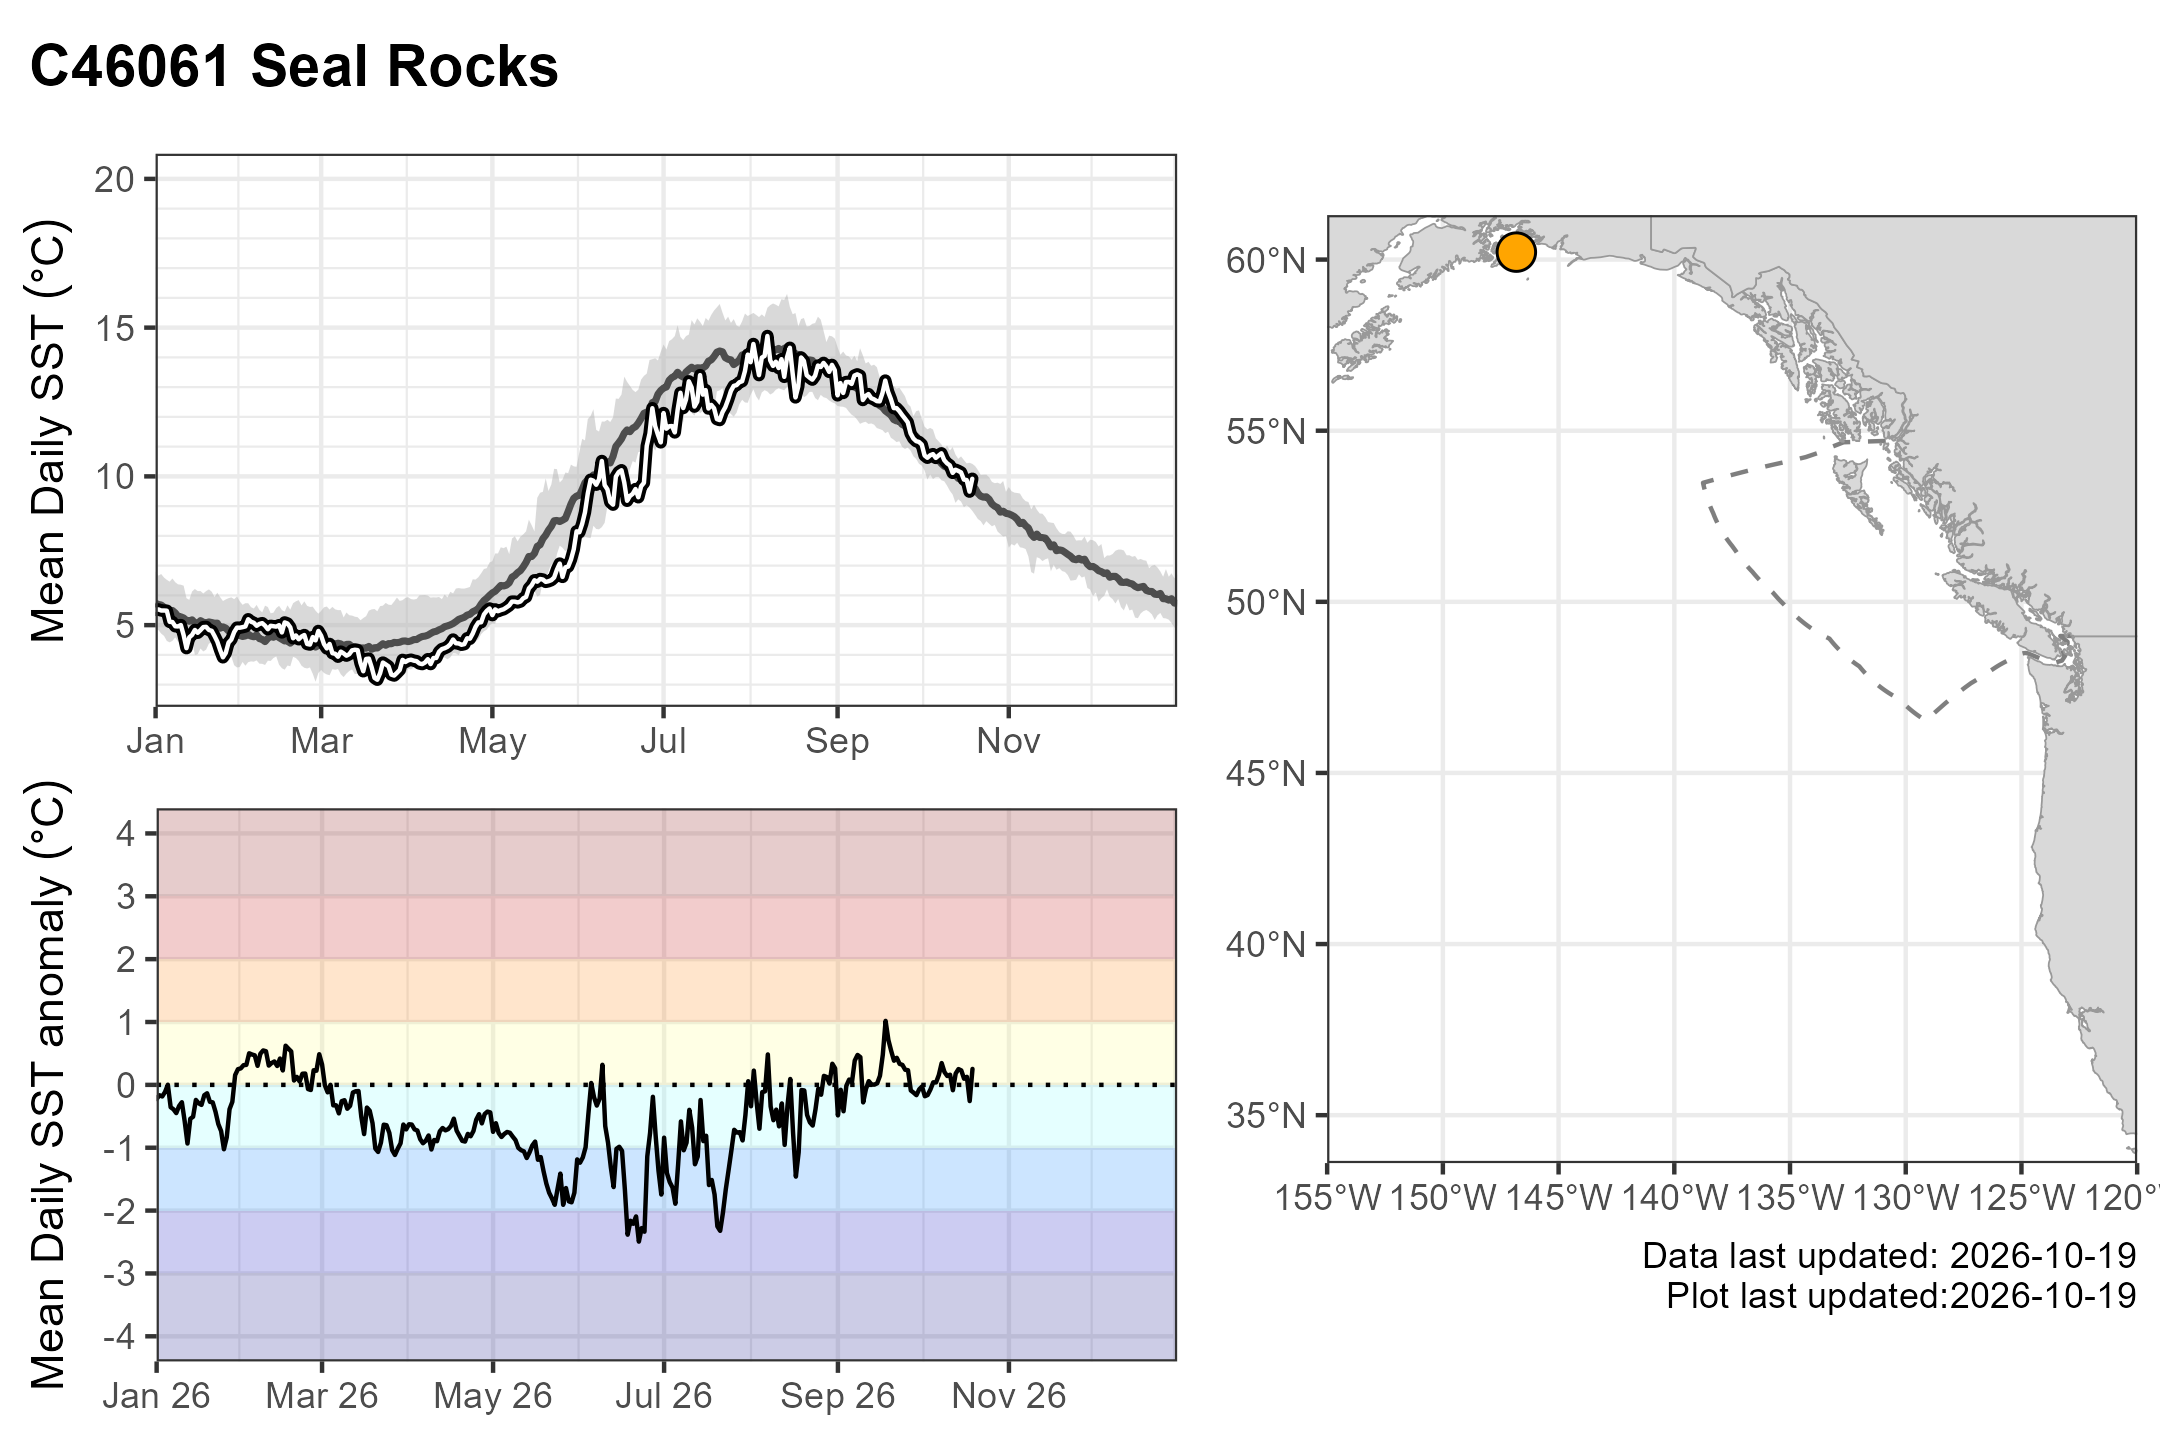
Note2026 NDBC buoy SST and SST anomalies

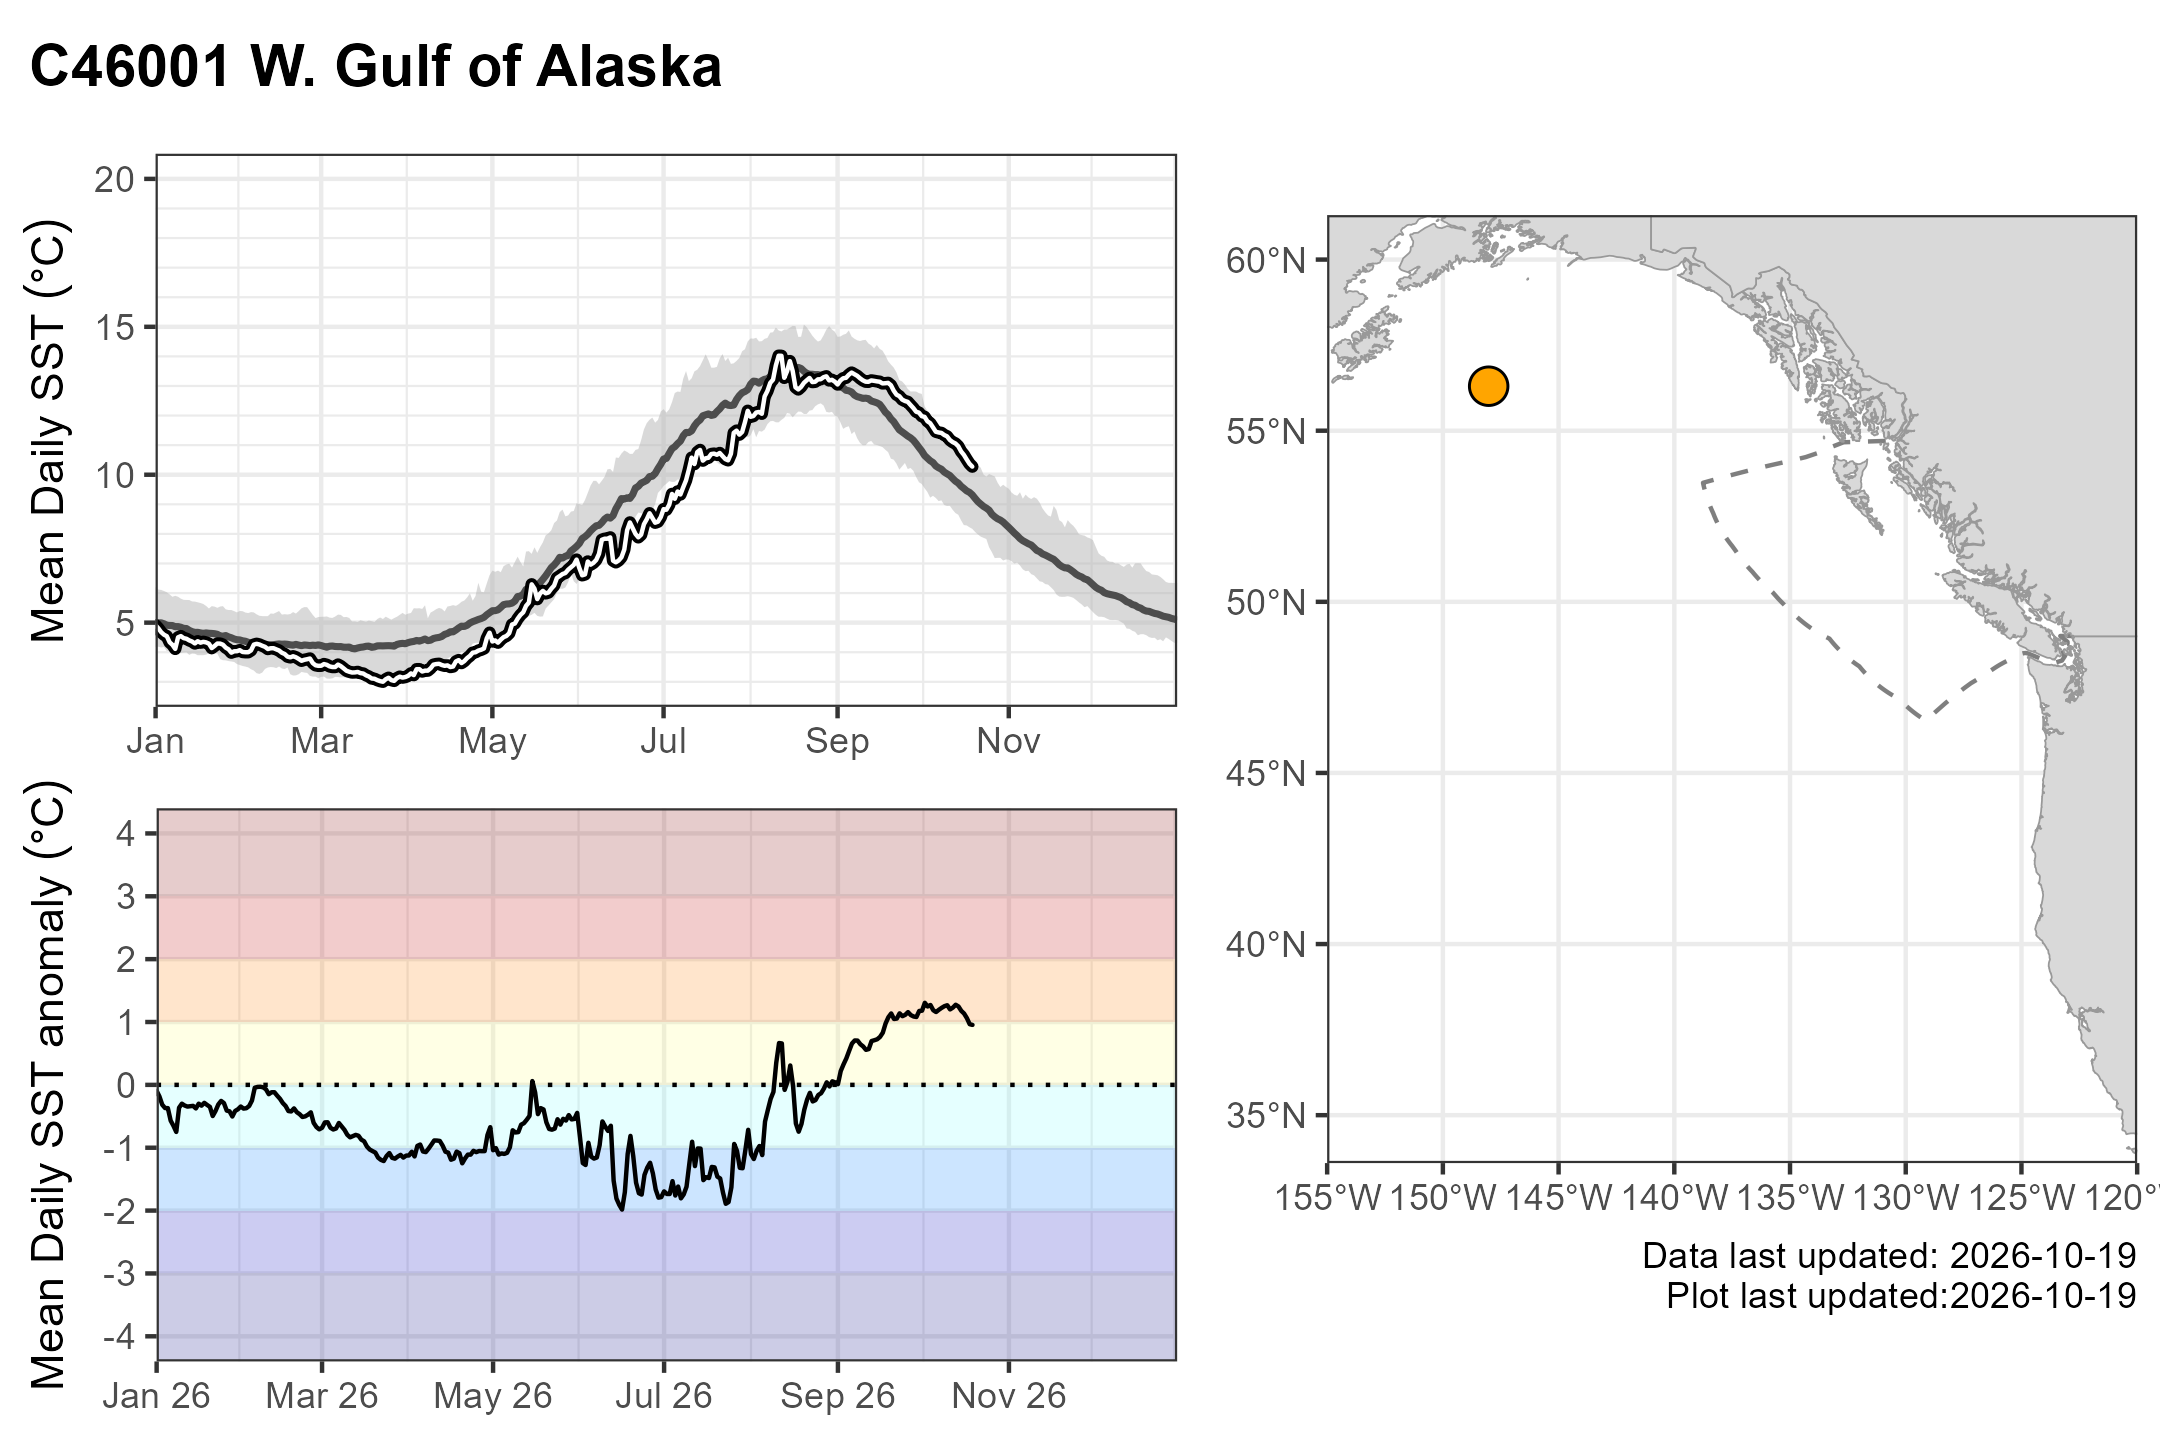
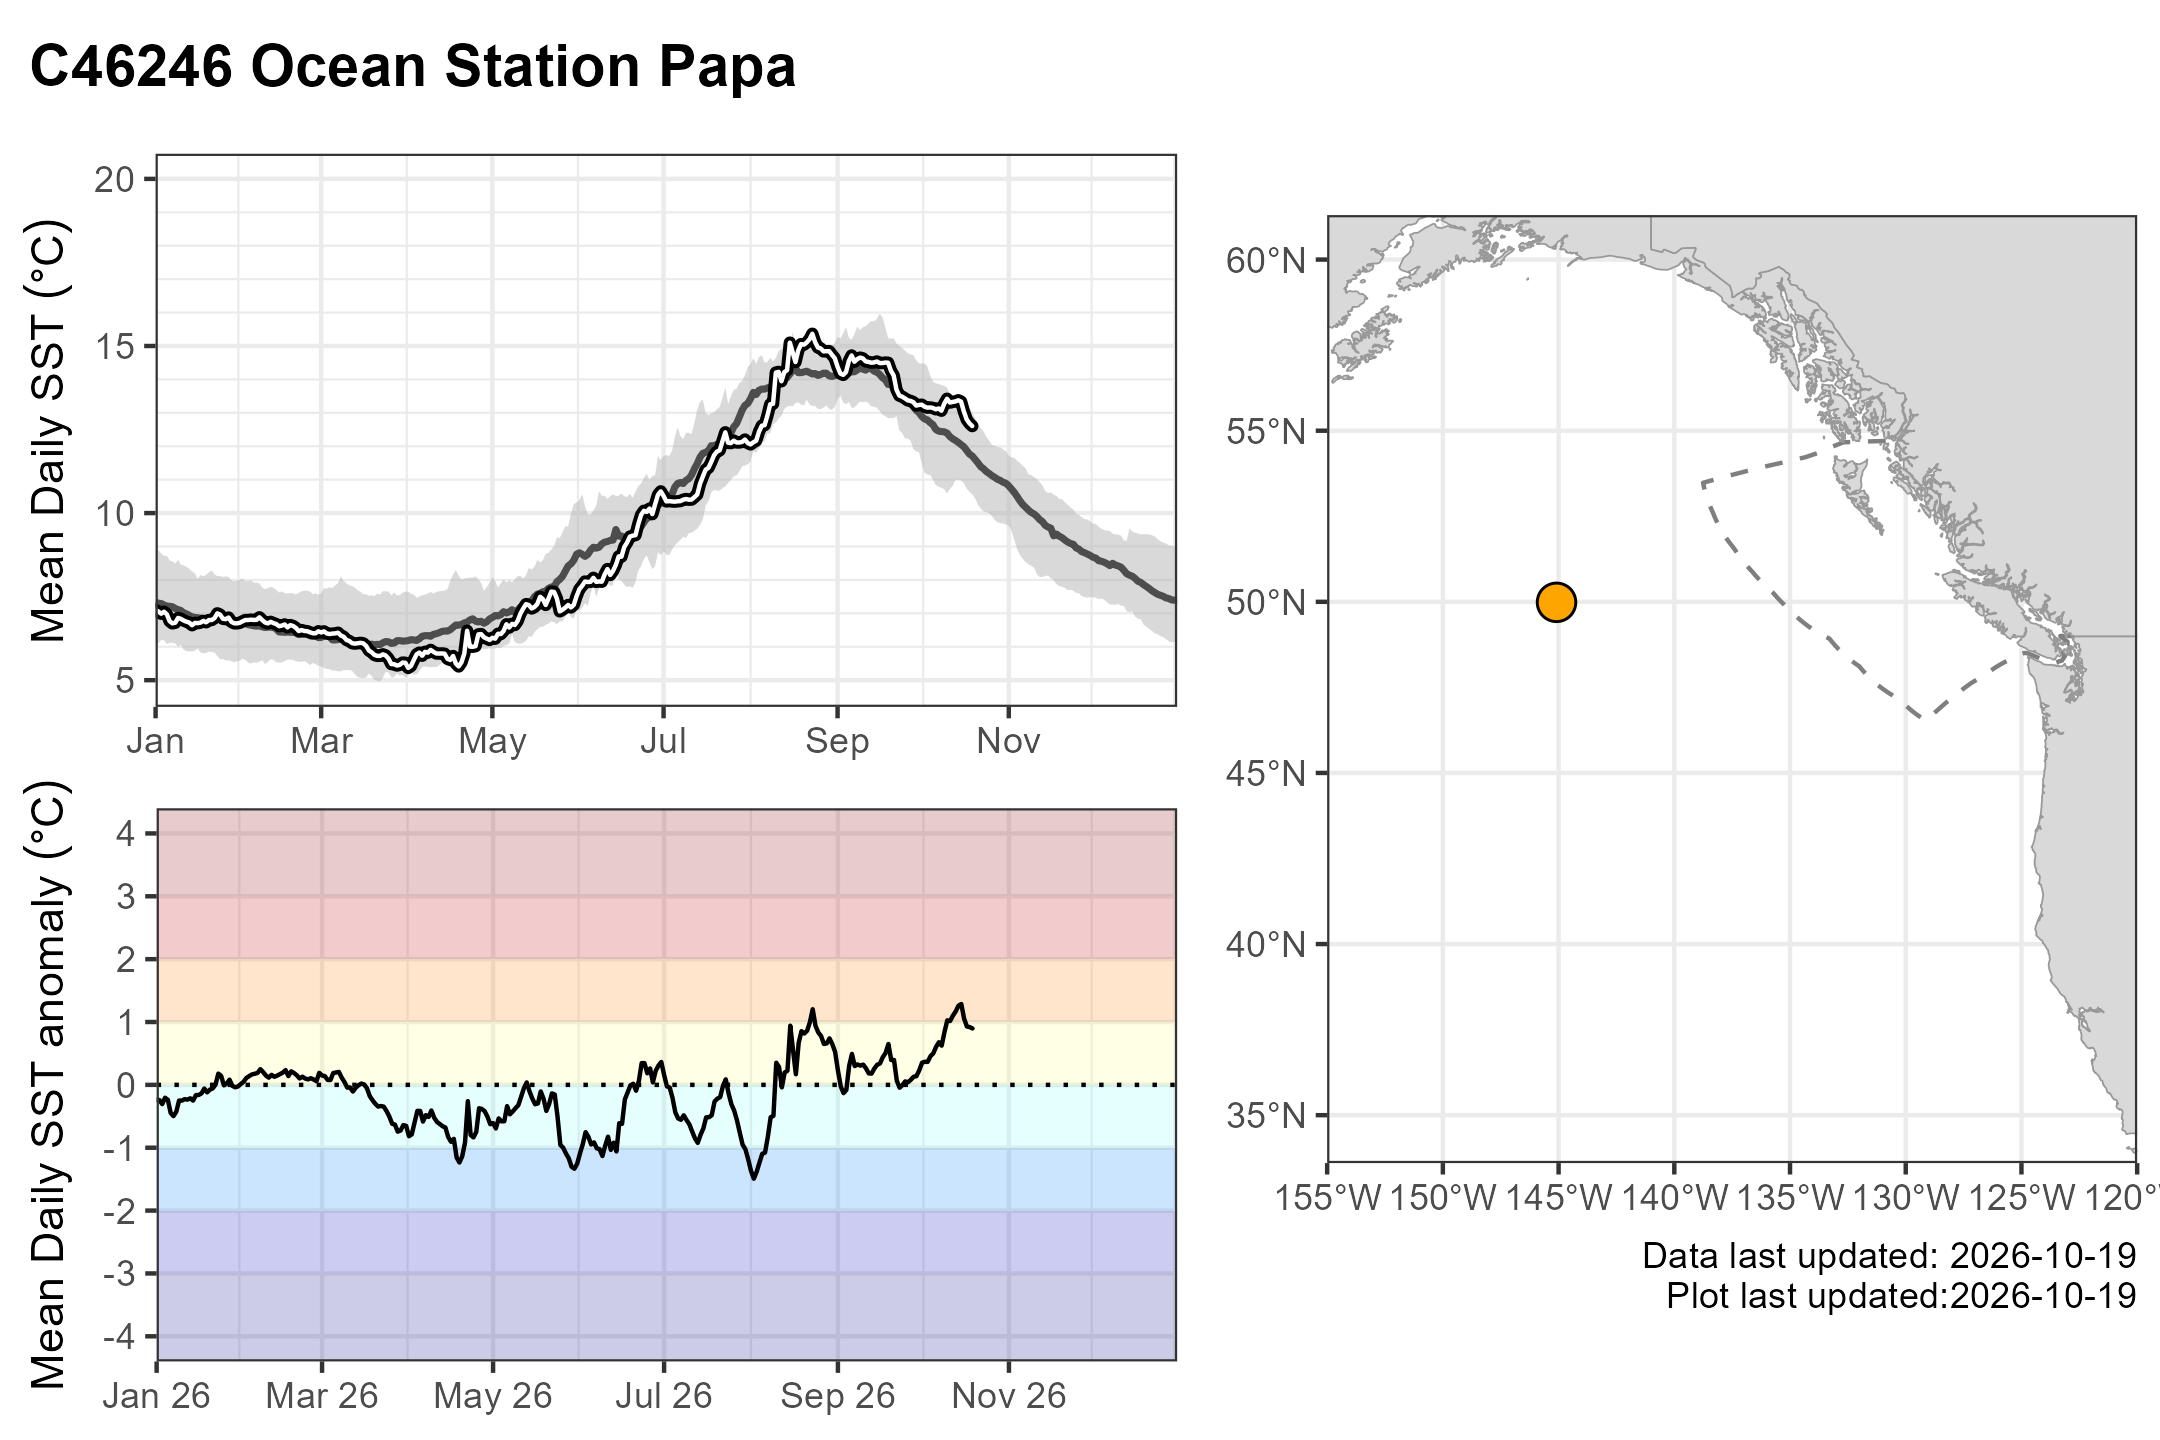
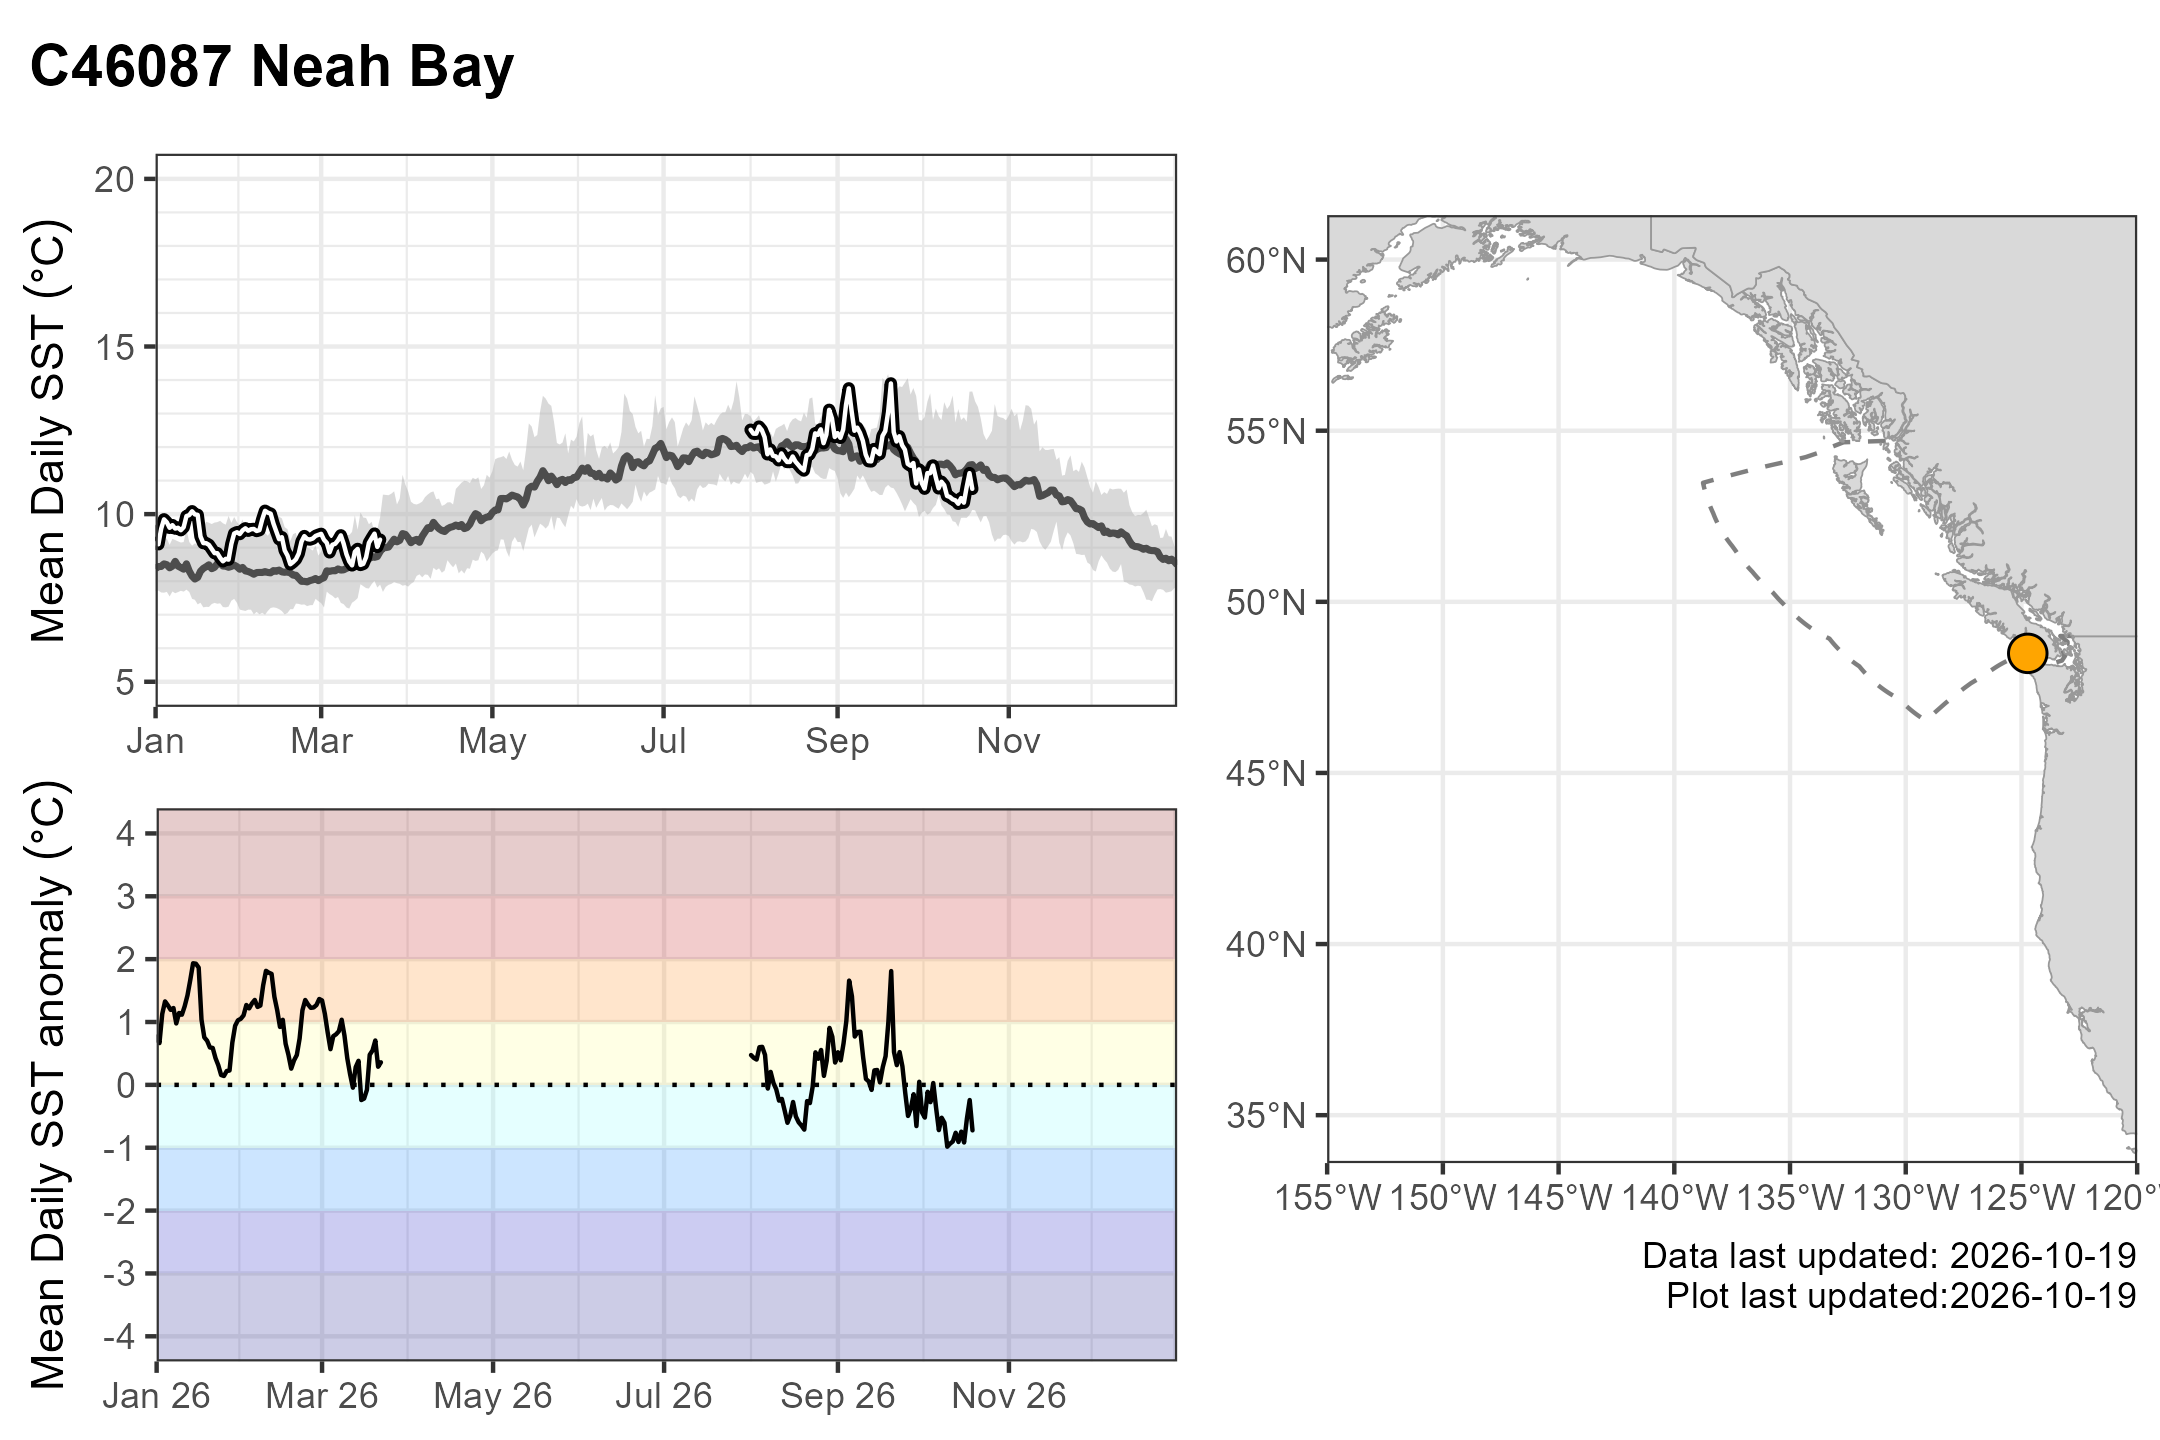
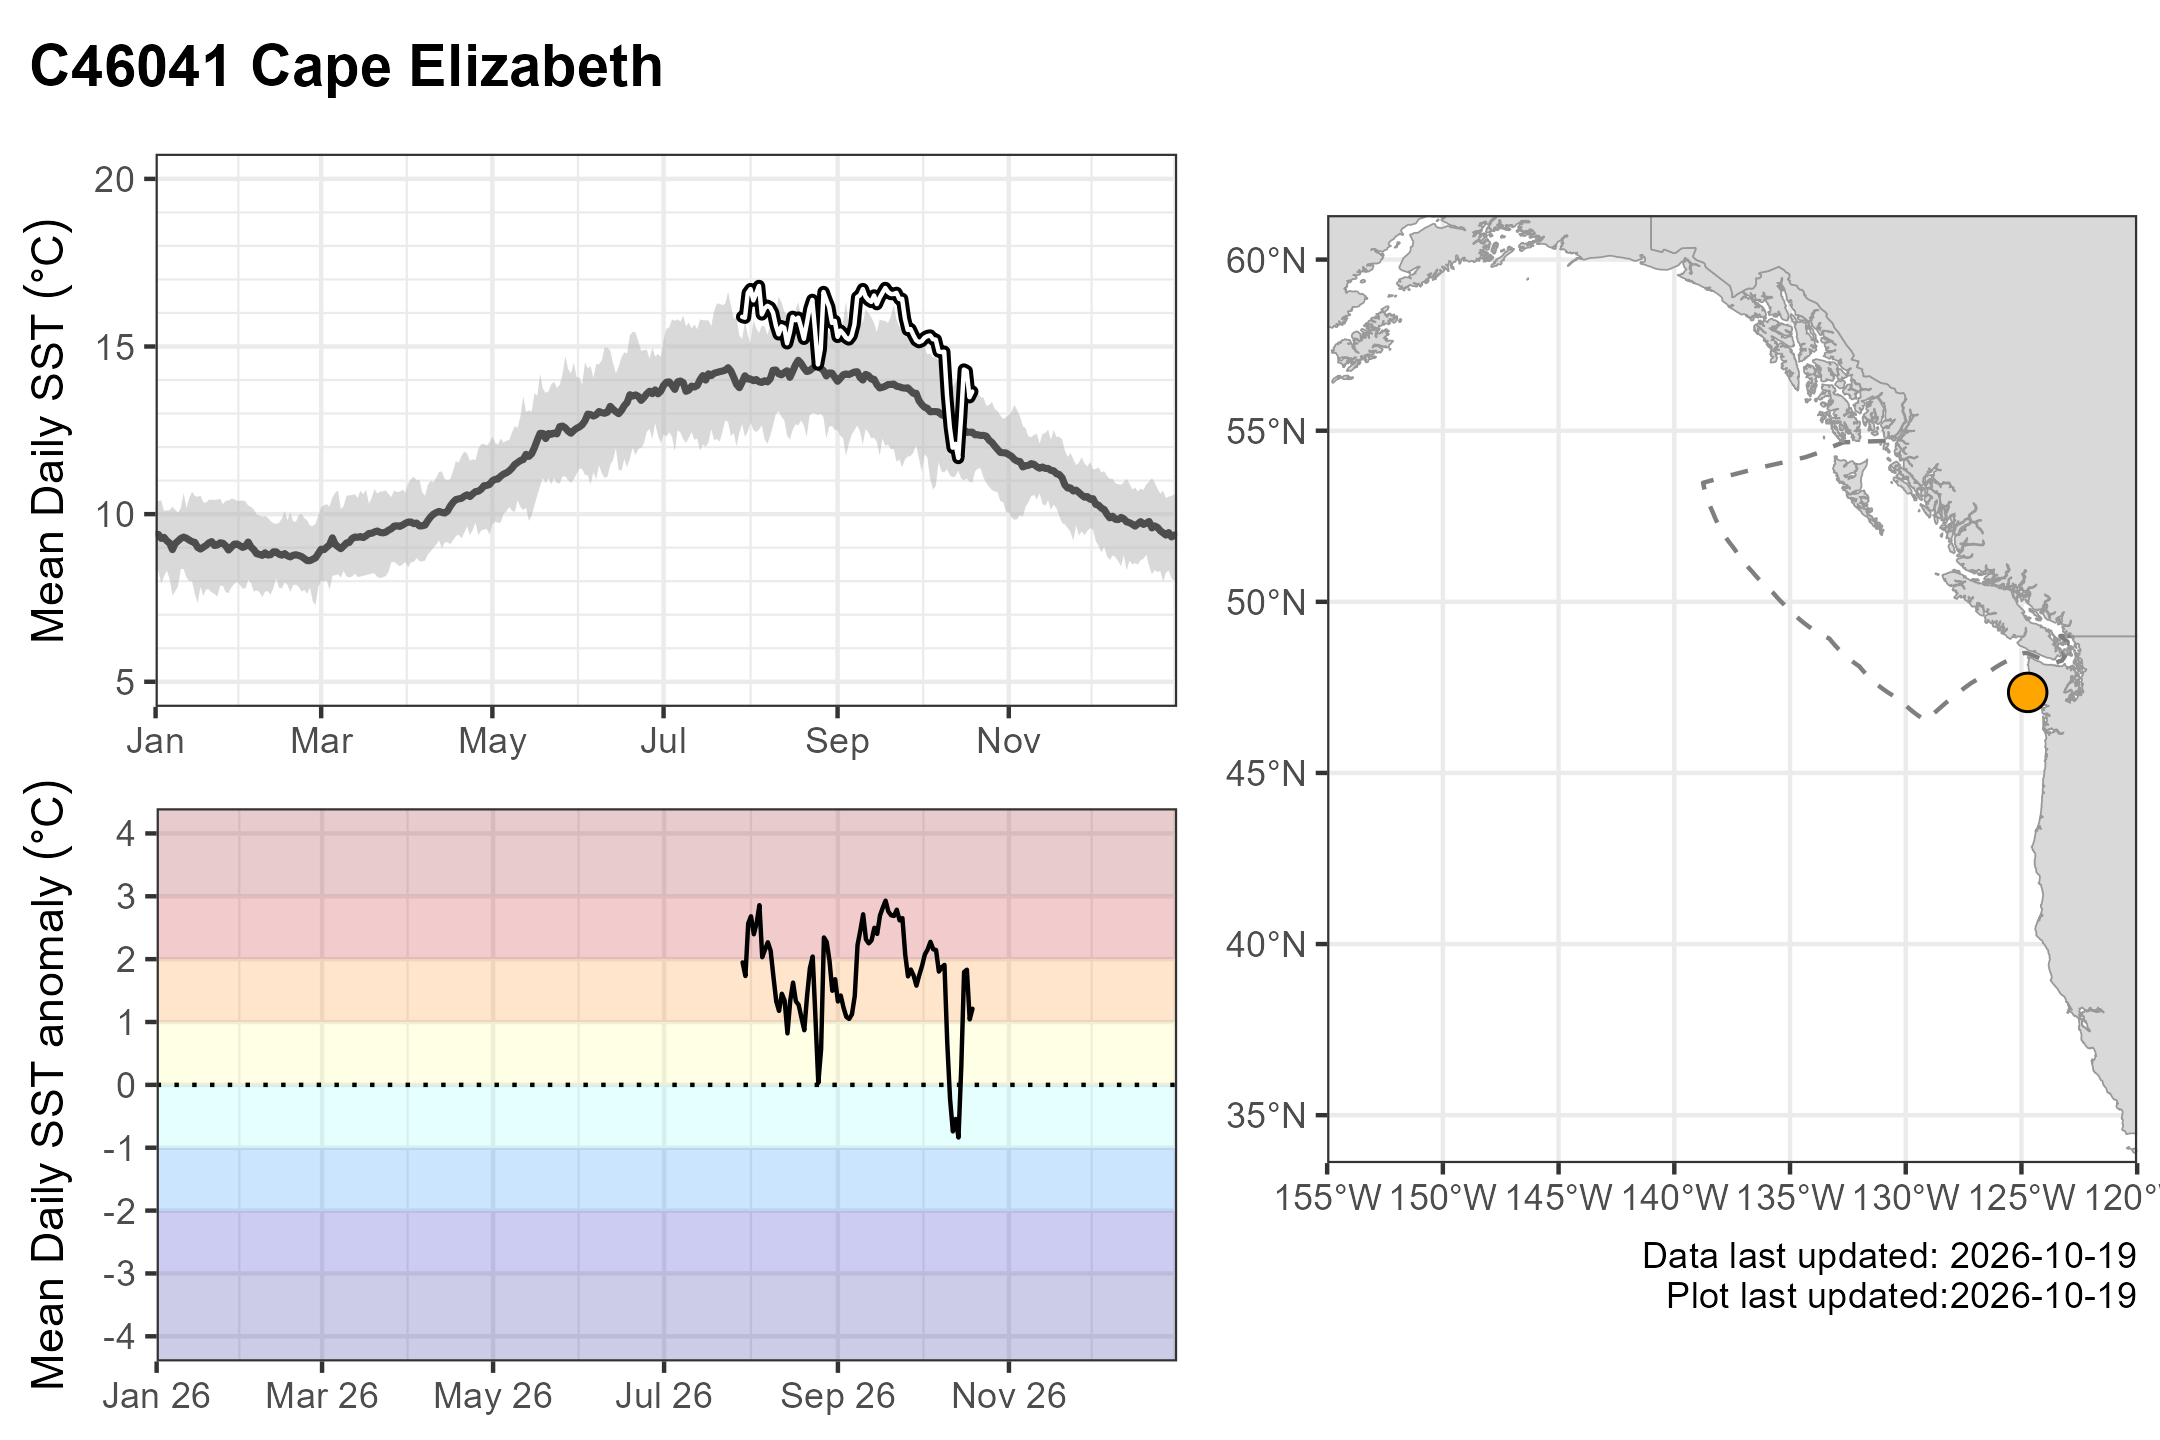
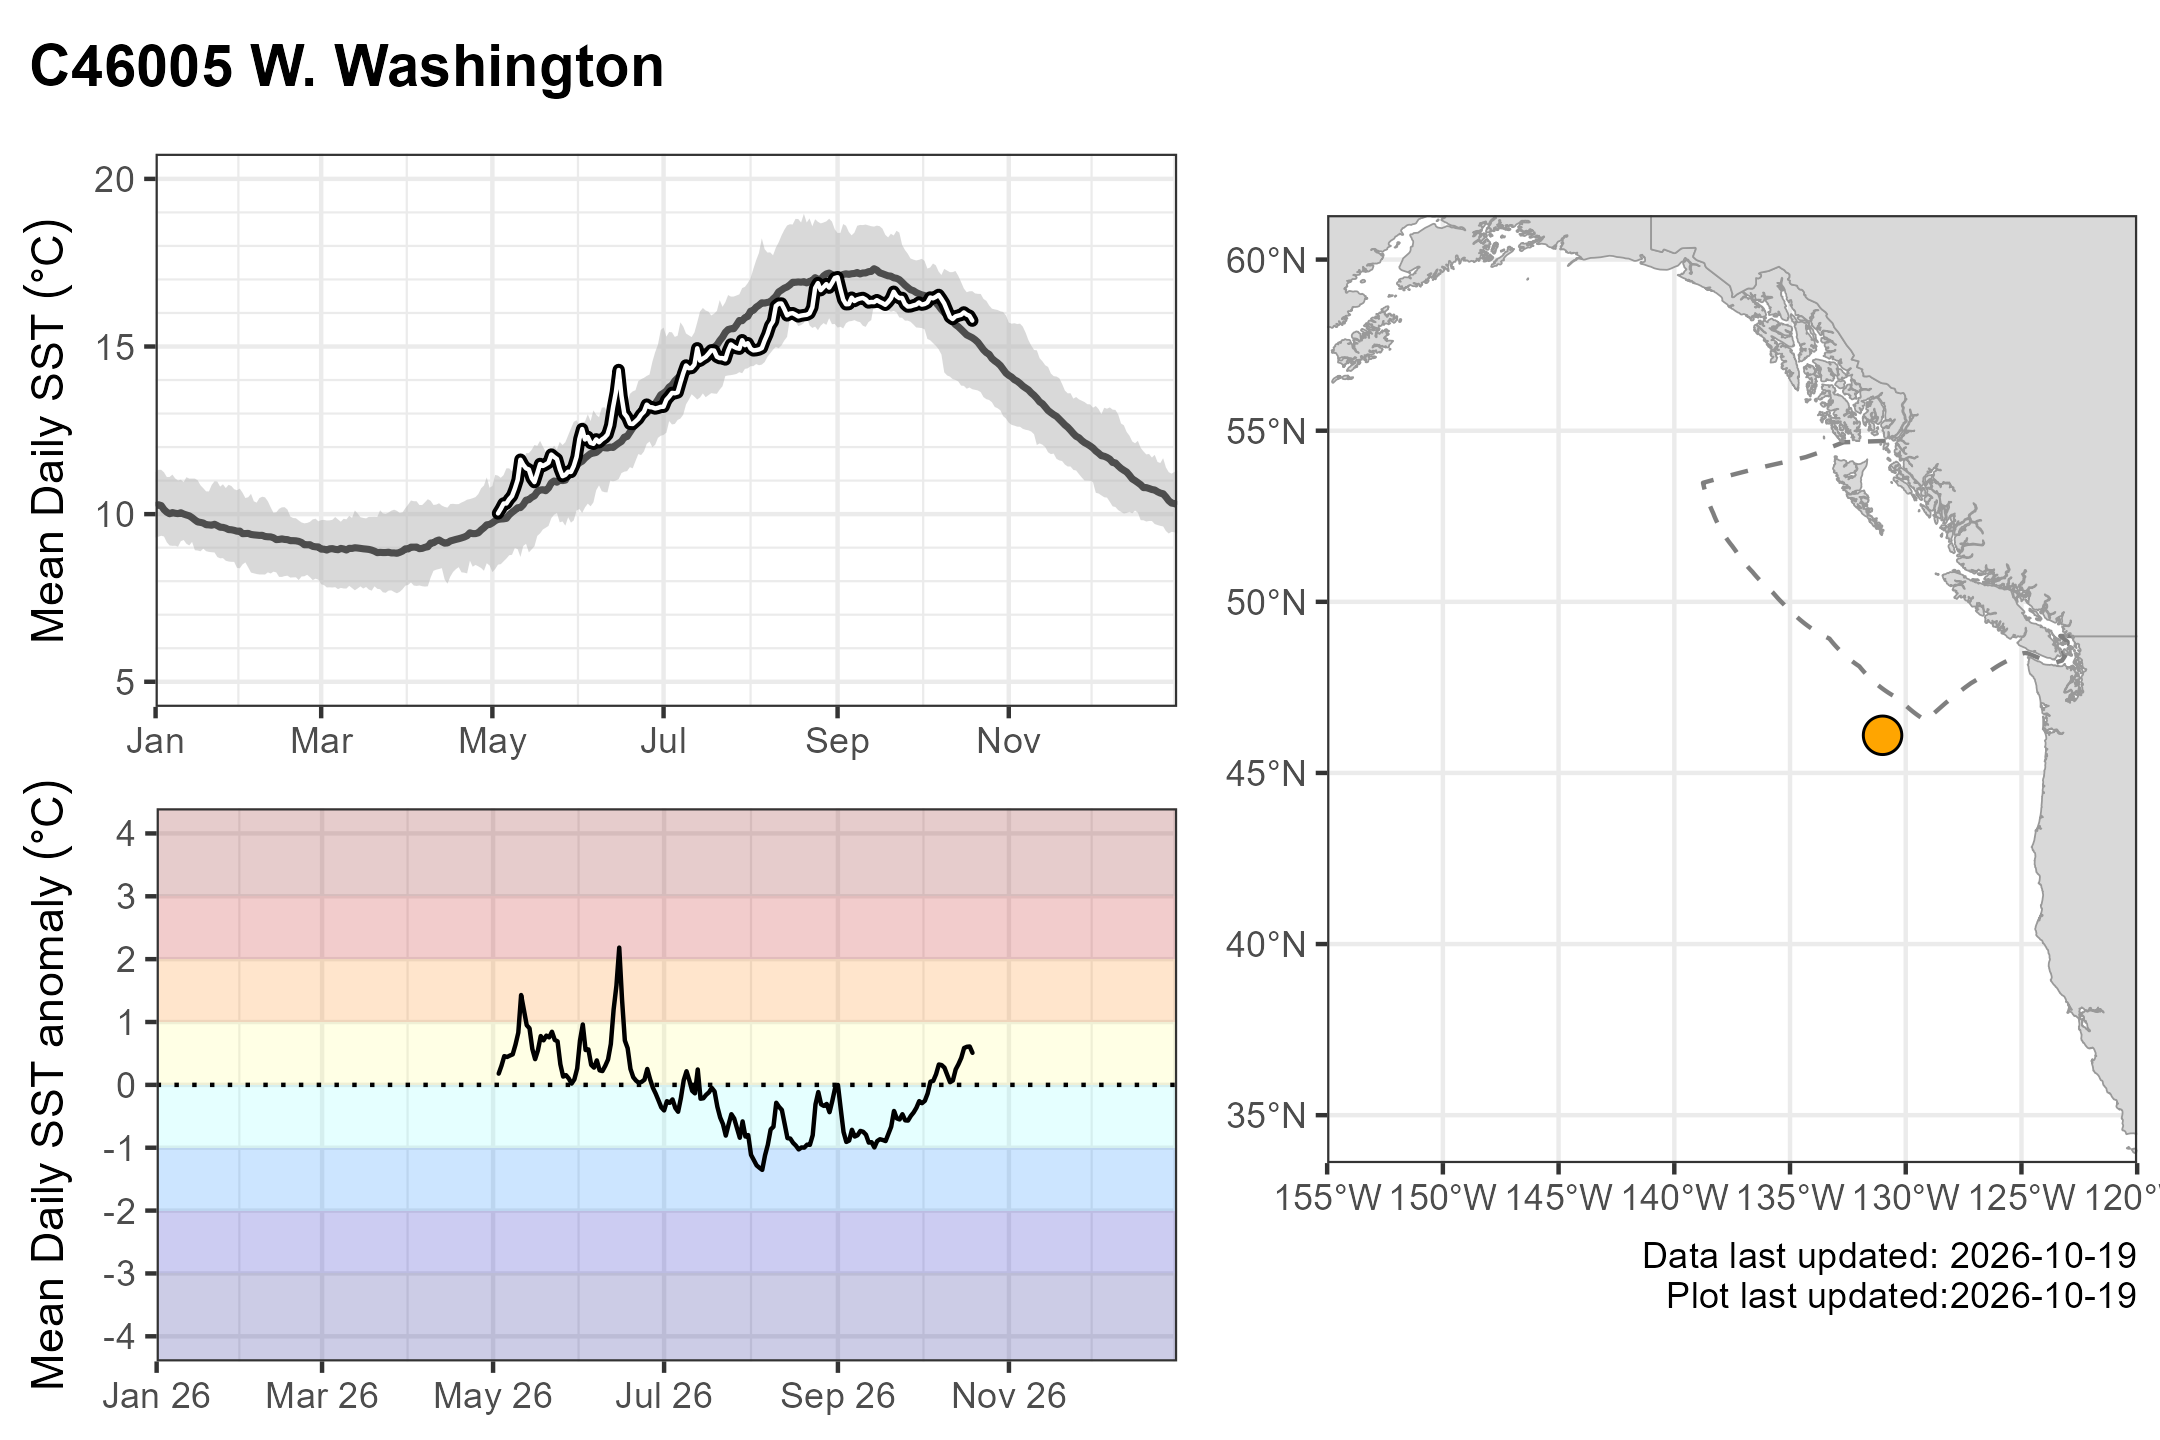
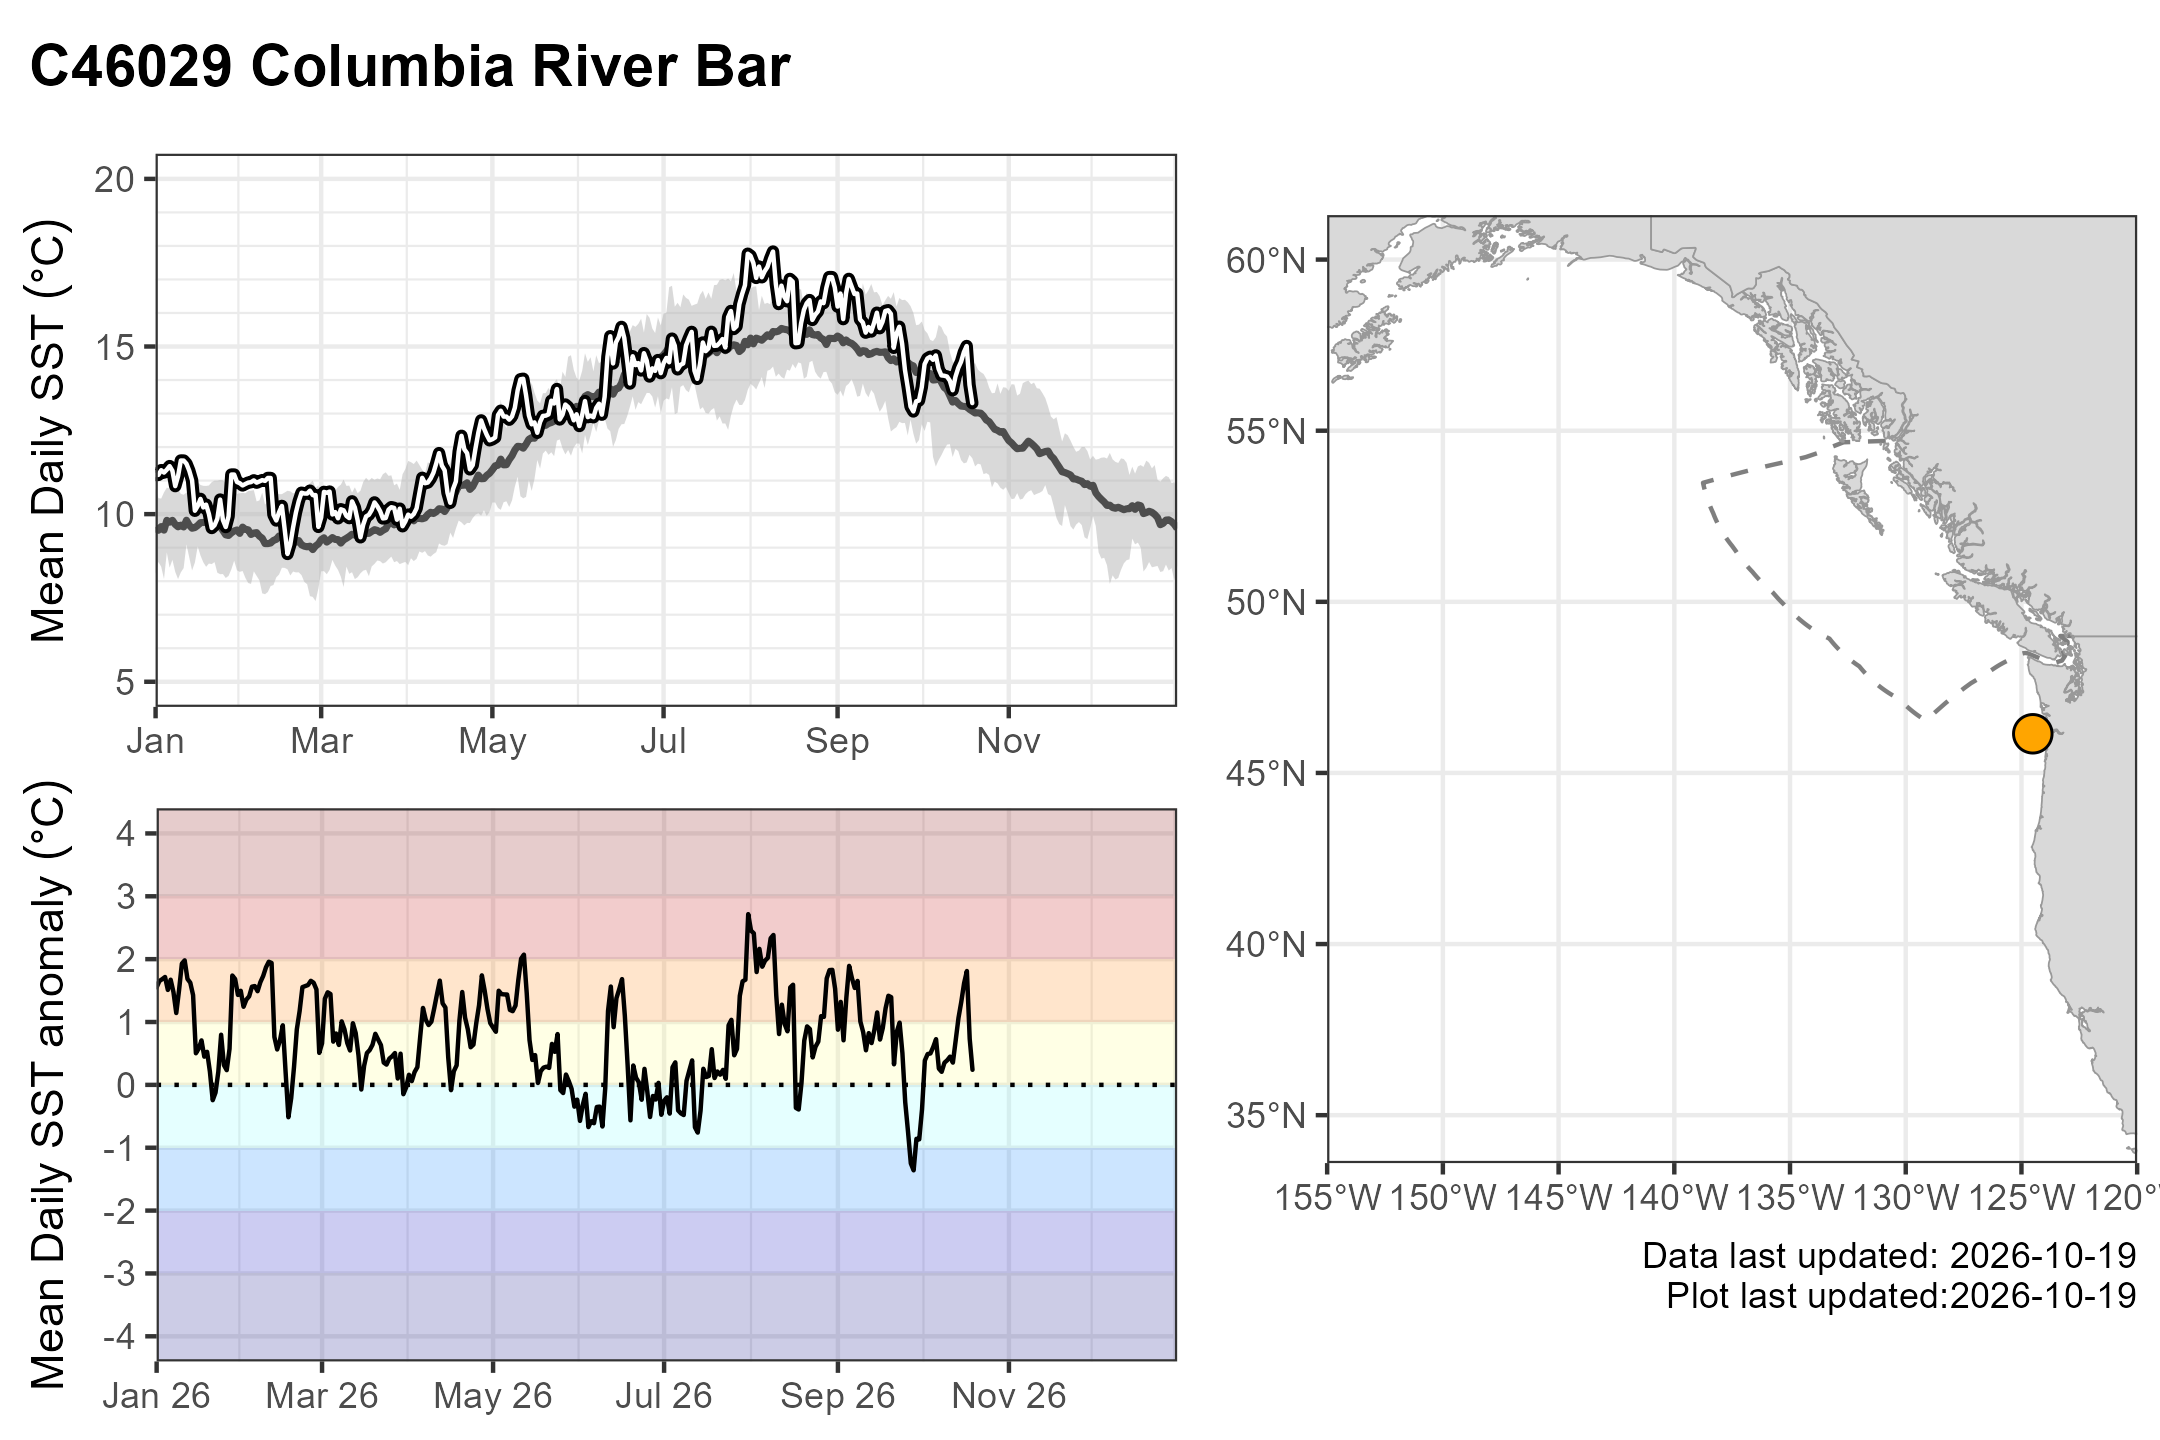
The white lines outlined in black are daily mean observations from 2026. The buoy climatological mean (grey line) is plotted with 10th and 90th percentiles (grey shading). The climatology spans 1991–2020, though some buoys began collecting data later: C46246 Ocean Station Papa and C46087 Neah Bay.
Back to top

References

Kellogg, J., Rosenstock, N., Page, S., Hourston, R., Devred, E., and Hannah, C. 2021. CIOOS Pacific. Available from https://catalogue.cioospacific.ca/dataset/ca-cioos_b9c71eb2-b750-43d5-a50a-aee173916736/resource/24249a05-f9b2-4ad7-bad6-8c9fcf35ce1e.

Citation

BibTeX citation:
@online{hilborn2026,
  author = {Hilborn, Andrea and Hannah, Charles},
  title = {Buoy Temperature in the {Canadian} {Pacific} {Exclusive}
    {Economic} {Zone} and {Northeast} {Pacific}},
  date = {2026-10-21},
  url = {https://ios-osd-dpg.github.io/Pacific_SST_Monitoring_Site/},
  langid = {en}
}
For attribution, please cite this work as:
Hilborn, A., and Hannah, C. 2026, October 21. Buoy temperature in the Canadian Pacific Exclusive Economic Zone and Northeast Pacific. Available from https://ios-osd-dpg.github.io/Pacific_SST_Monitoring_Site/.