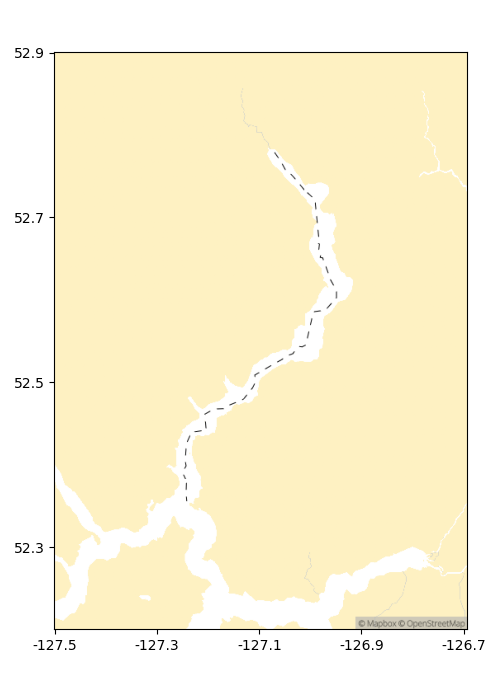
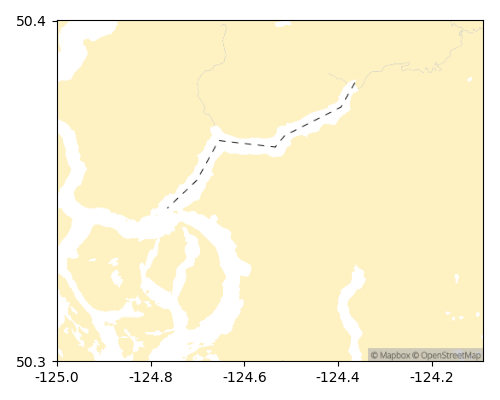
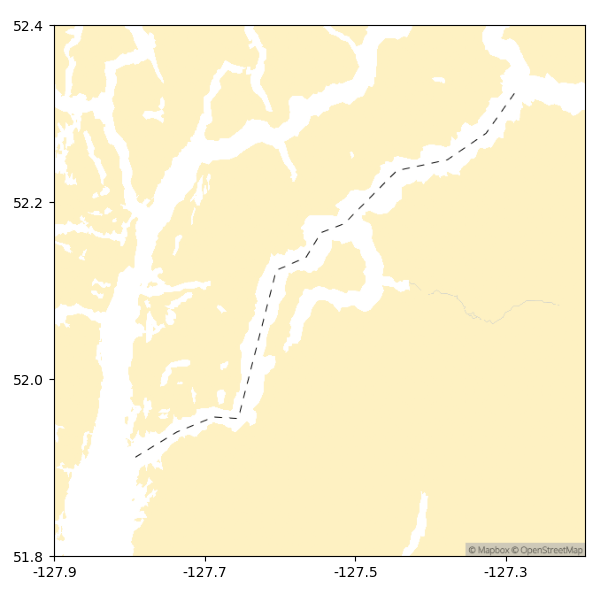
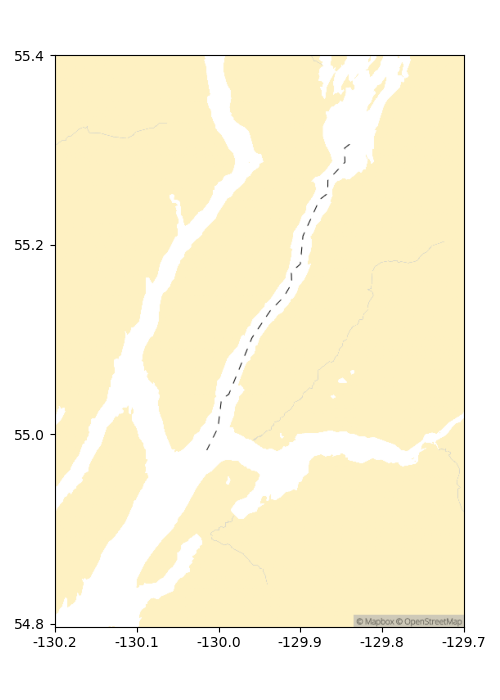
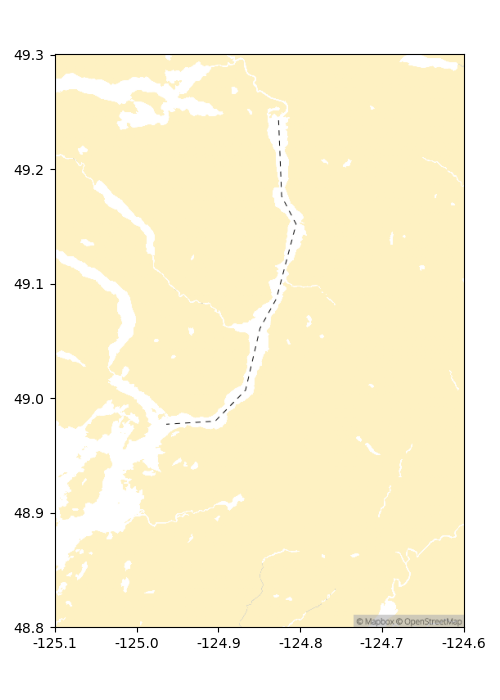
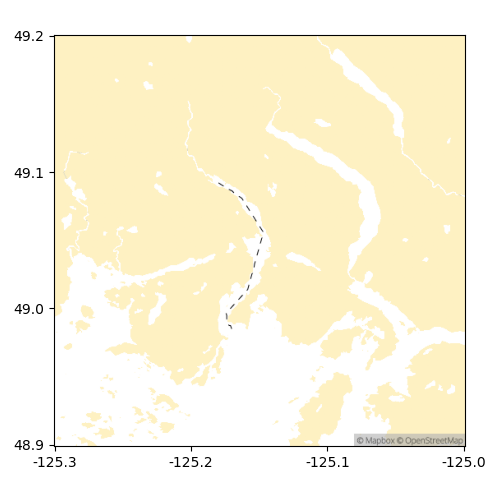
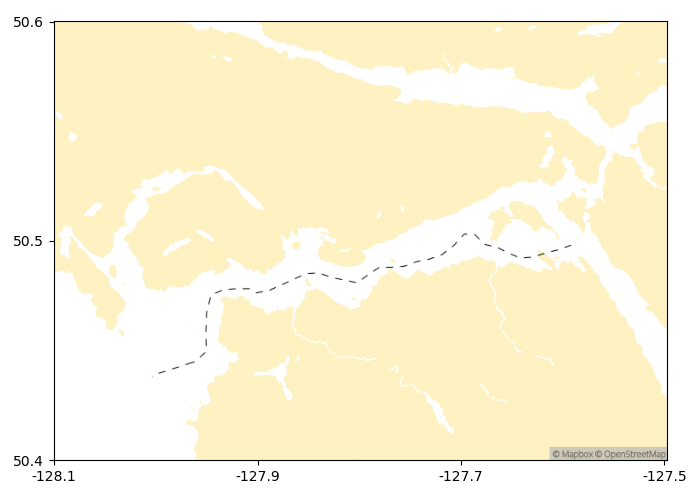
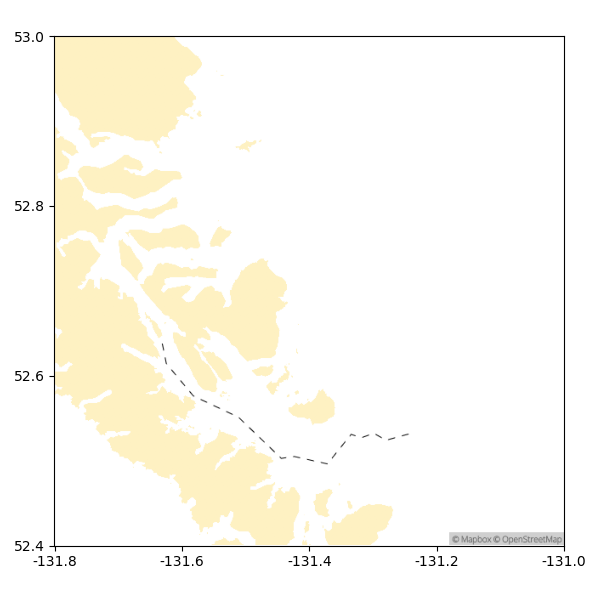
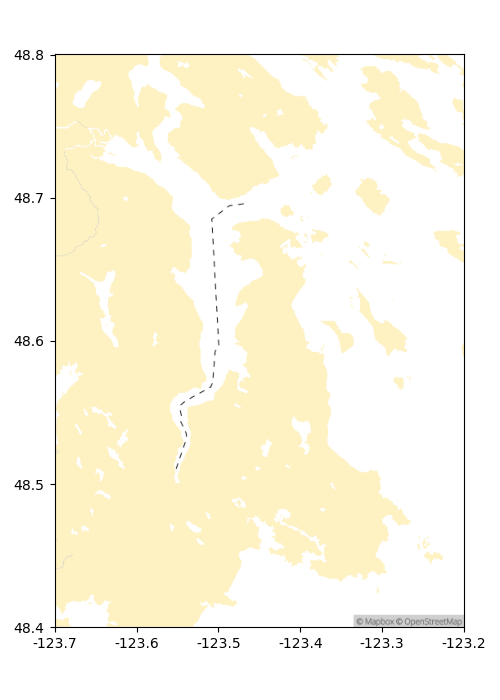
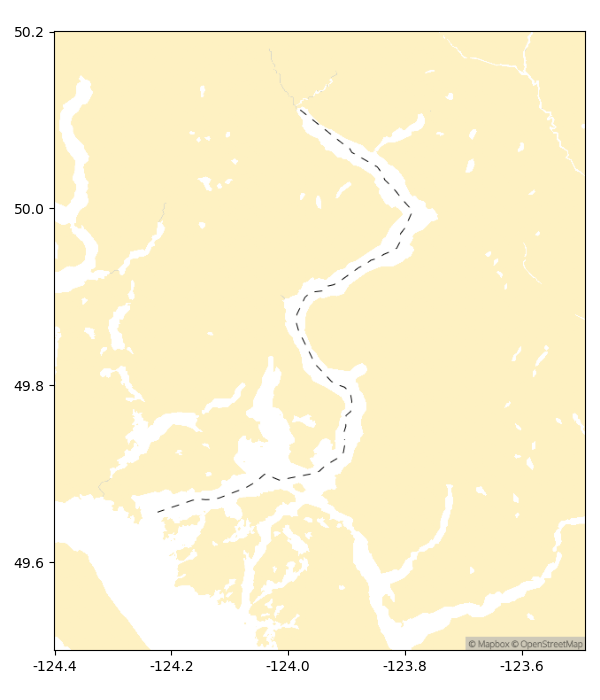
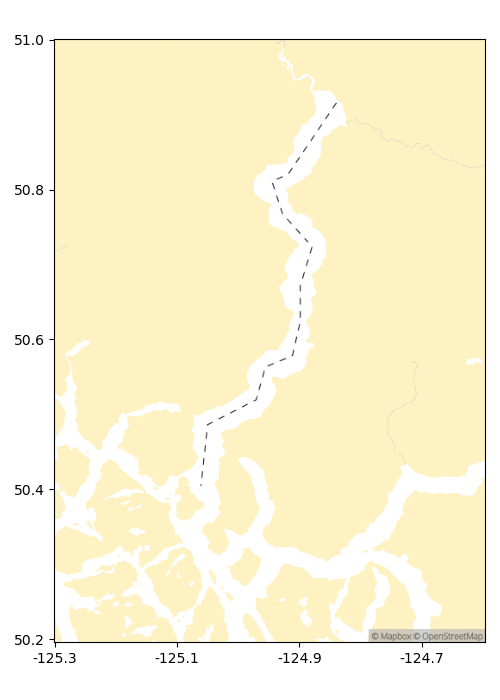
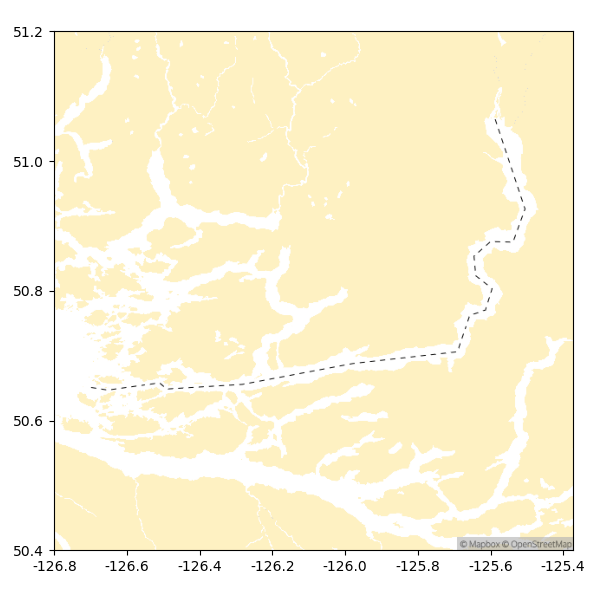
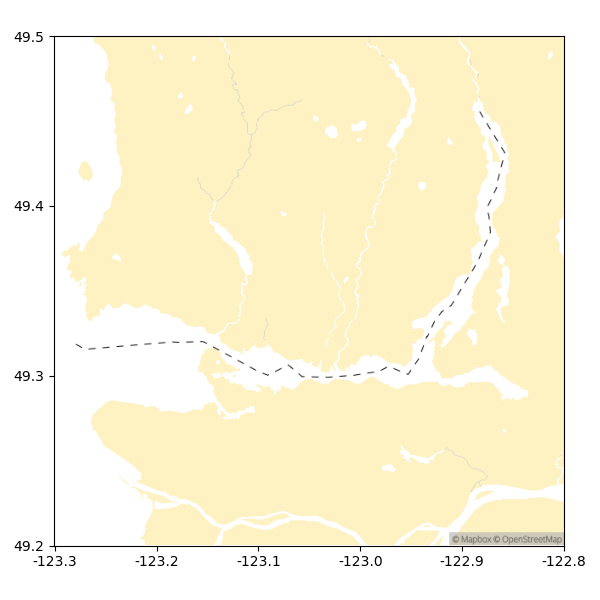
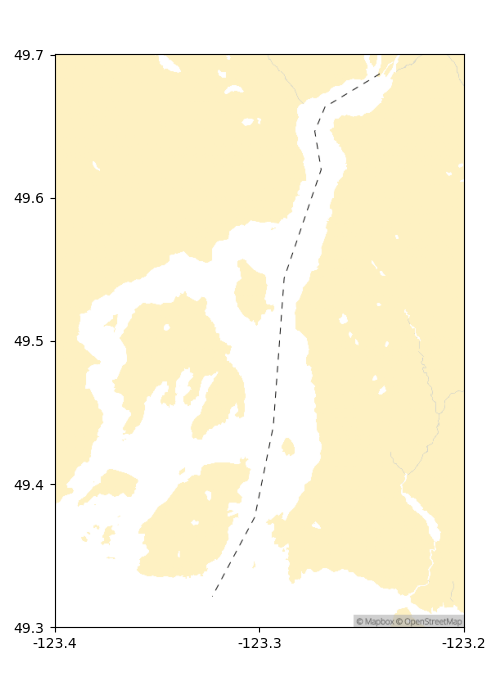
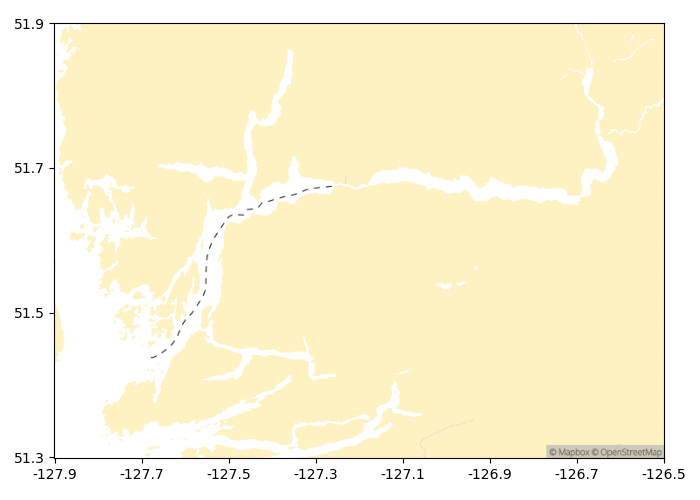
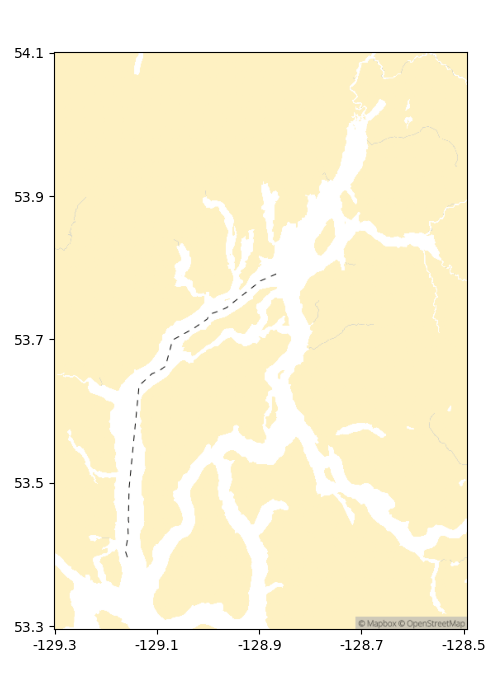
Click here to view map
The maps on this page were generated using Mapbox Studio.
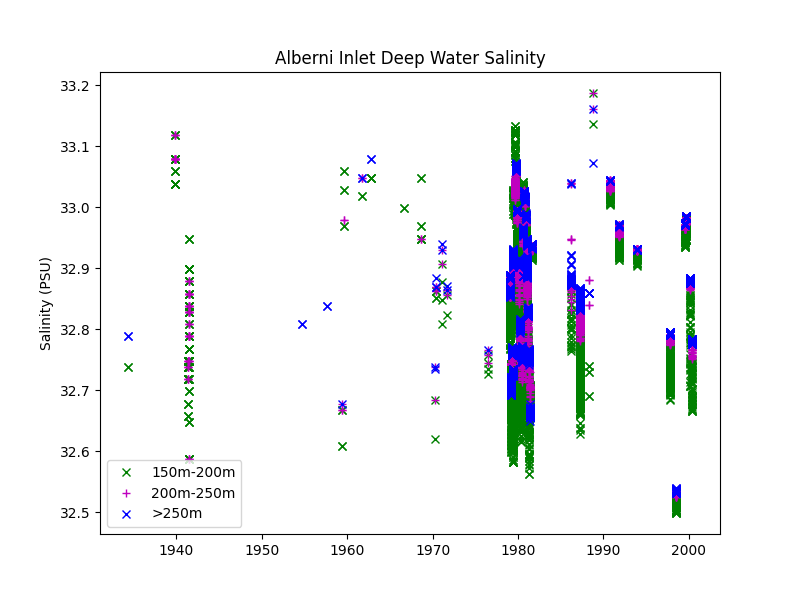
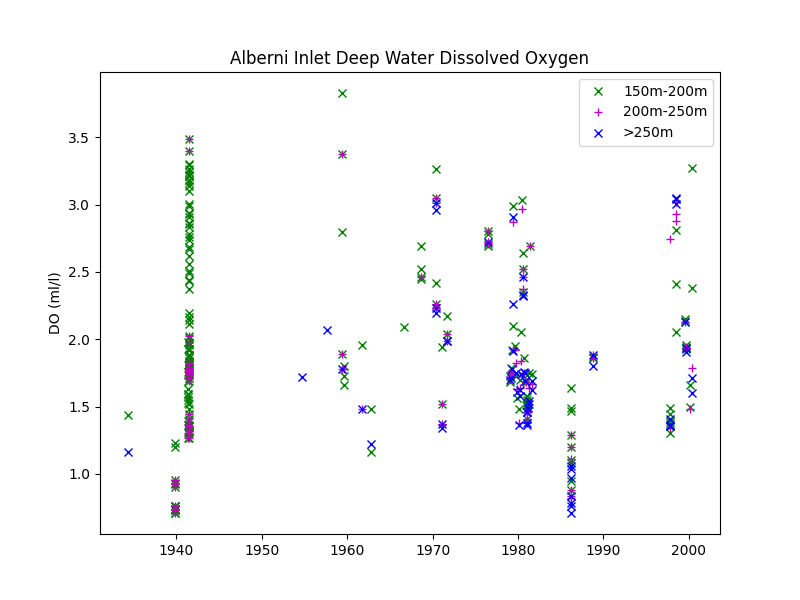
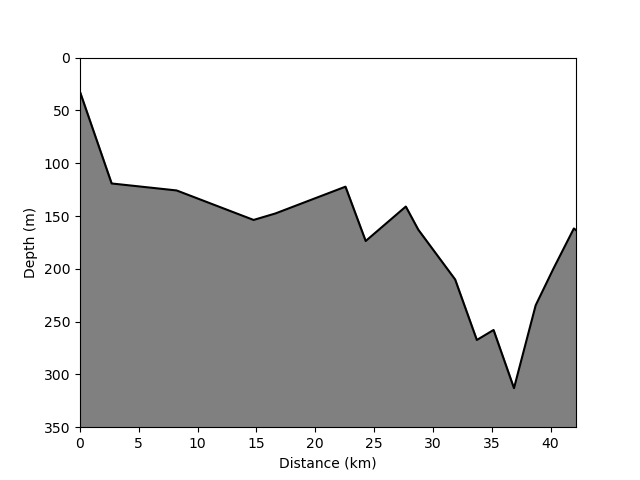
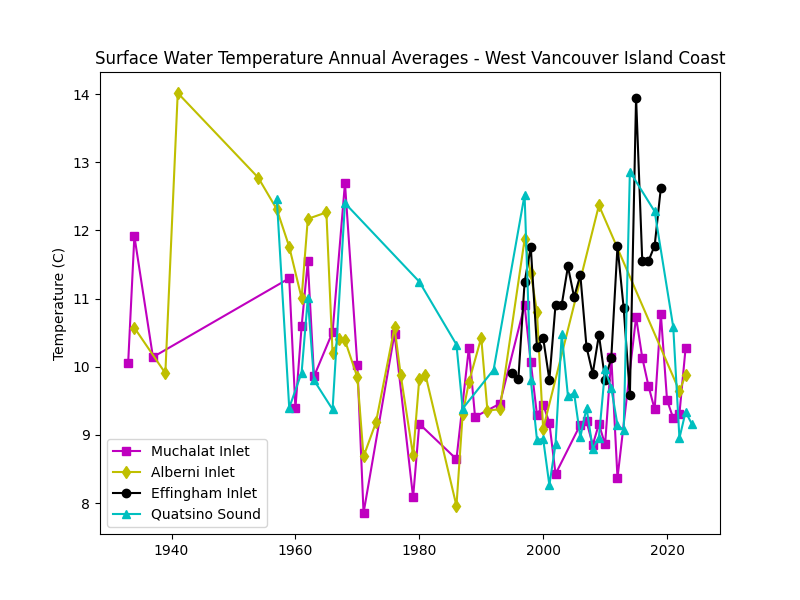
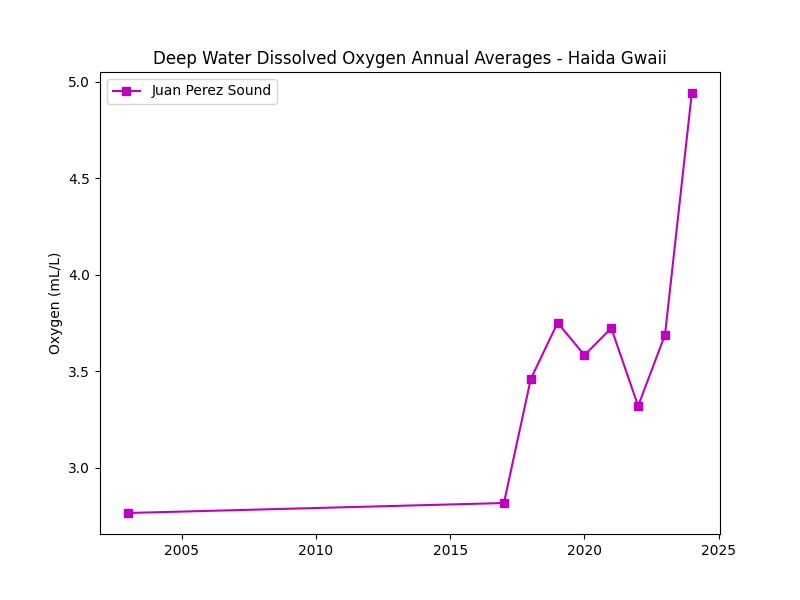
The deep waters of inlets, i.e. those waters trapped behind the inlet's sill, are usually quiescent. Isolated from the annual and higher frequency variations present in the near surface waters, the deep waters provide a good sampling location for observing the long term changes in water properties (temperature, salinity, and dissolved oxygen). The deep water chronicle the temperature, salinity, and dissolved oxygen properties of the outside waters.
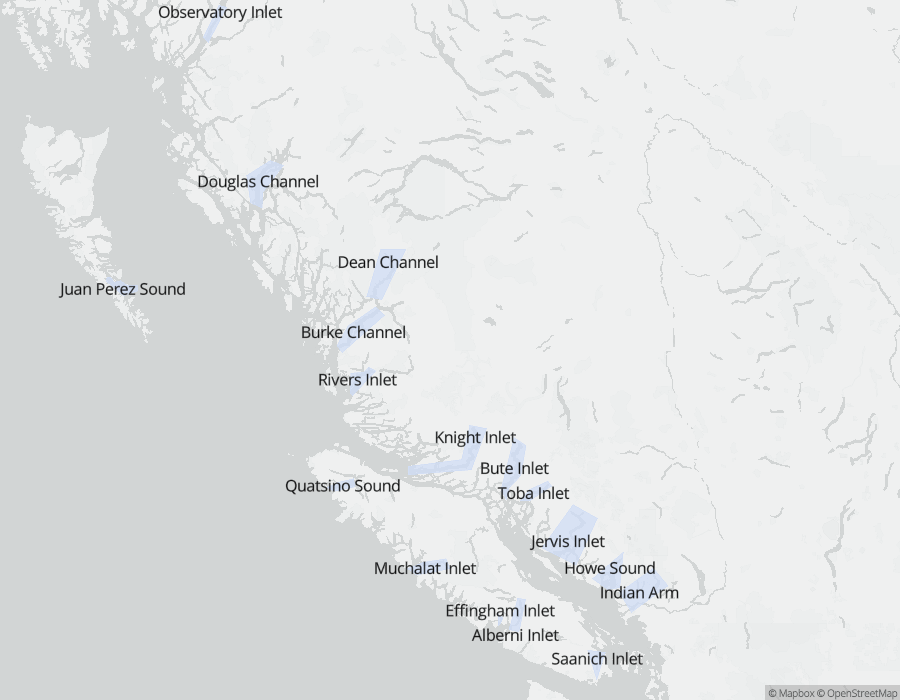
The almost 70 year long time series of water properties from some inlets, more than 90 years in the case of Saanich Inlet, are potentially rich sources of information about our coastal environment and how it has changed in the last half century. This page presents the annual and monthly time series of deep water properties from the major BC inlets (Salish Sea Inlets - Saanich, Indian Arm, Howe Sound, Toba, and Jervis; Central and North Coast Inlets - Observatory, Douglas Channel, Dean, Burk, Rivers, Knight, and Bute; West Coast Vancouver Island Inlets - Muchalat, Alberni, Effingham, Neroutsos, Rupert-Holberg). The page also provides basic physical, hydrologic, and oceanographic information for these inlets.
Dr. George Pickard of the Institute of Oceanography at the University of British Columbia (UBC) initiated in 1951, and conducted for many years, a series of inlet cruises. The inlet cruises, conducted mostly in the summer, were used for studies of the BC fjords and also served as training exercises for oceanography students. Students obtained and analyzed water samples for temperature, salinity, and dissolved oxygen in many fjords, straits, passages, and channels on the entire BC coast. The data set is a remarkably long (~70 years), high quality time series that spans the entire length of the mainland coast and Vancouver Island.
Several other researchers, notably Drs. John Tully and Mike Waldichuk, also conducted sampling programs in several BC inlets. Dr. Tully's work extends back to the 1930's, and Dr. Waldichuk conducted several pollution cruises in the 60's and 70's to inlets where there were pulp mills. From the mid 1980's to the late 2000's, the fjord research at the Institute of Ocean Sciences (IOS) had provided extensive sets of observations from several fjords, in particular Knight, Saanich, and Alberni Inlets. All of the IOS data sets and most, but not all, of the early inlet and coastal water surveys are now preserved in digital form in the IOS data archive.
Data is taken from the archives at waterproperties.ca and the Cioos Pacific and Hakai ERDDAP servers.
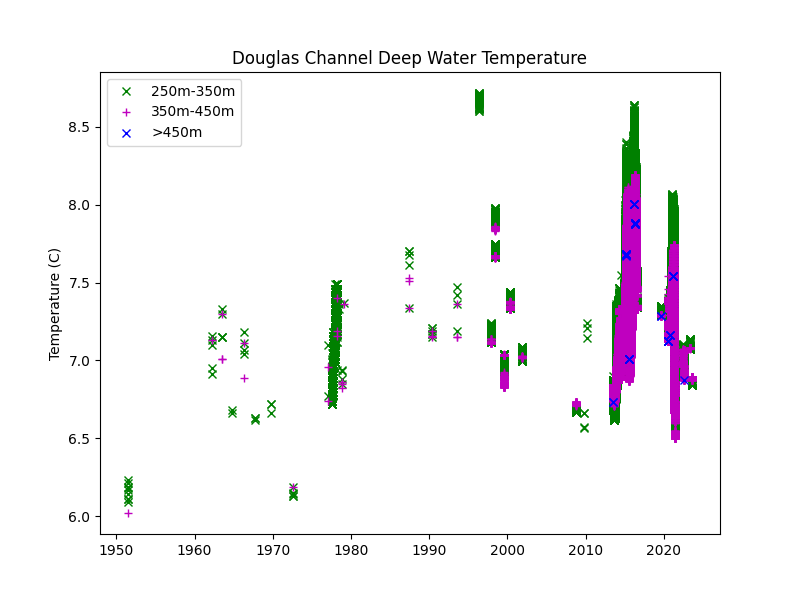
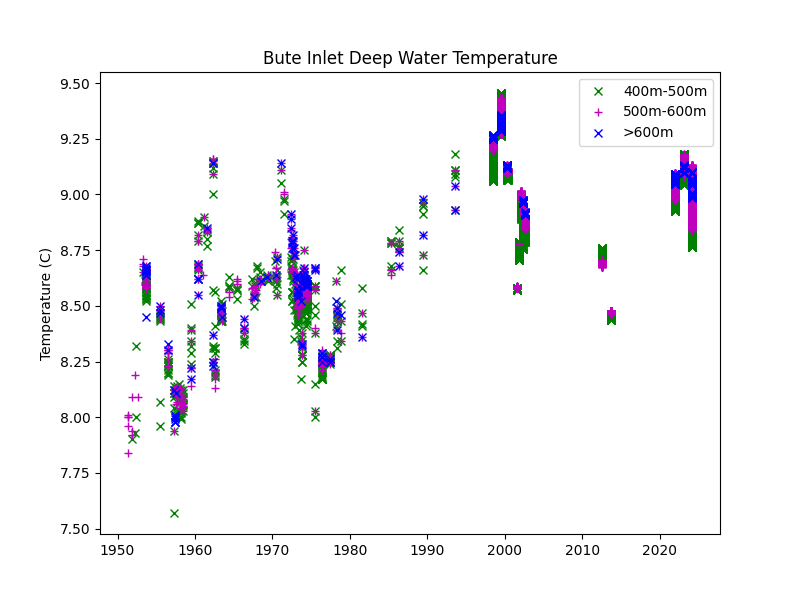
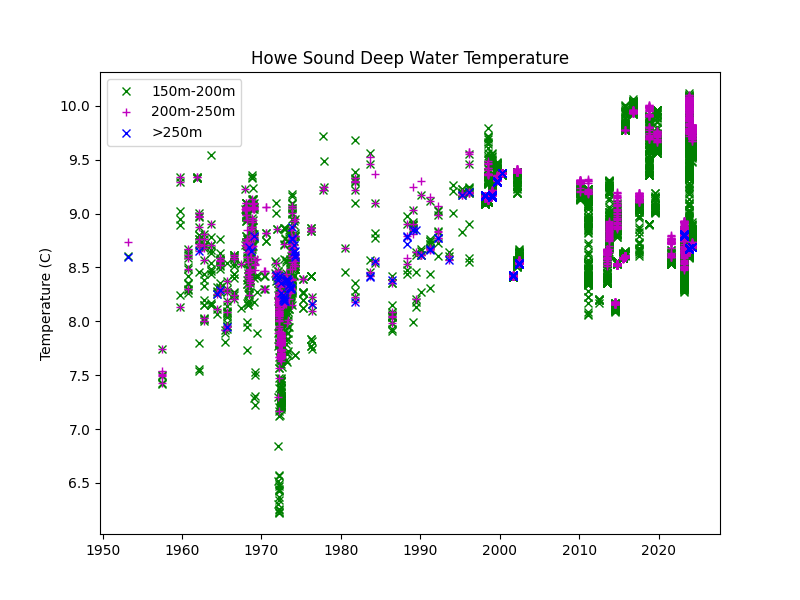
Arithmetic means of deep water properties were calculated for each data file/profile over predefined depth intervals, and then across each month for monthly averages. Monthly averages time series of temperature, salinity, and dissolved oxygen for individual inlets are shown below.
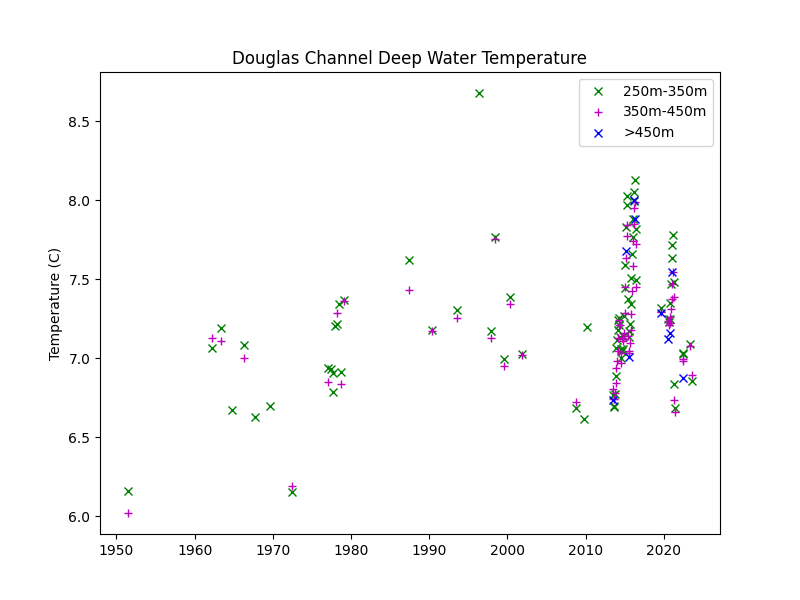
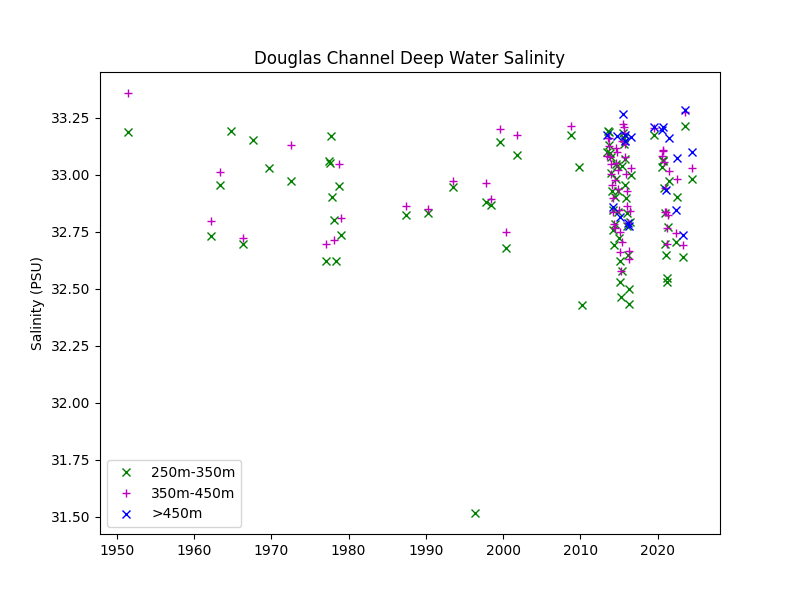
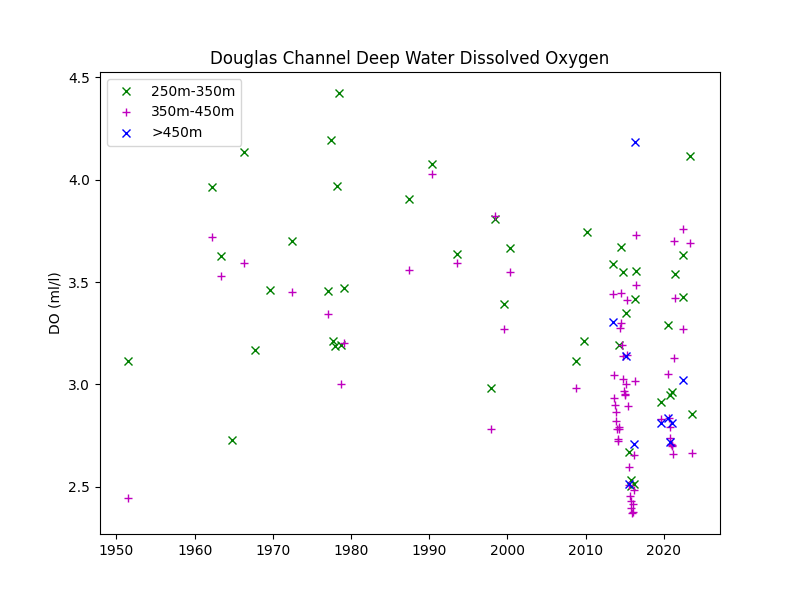
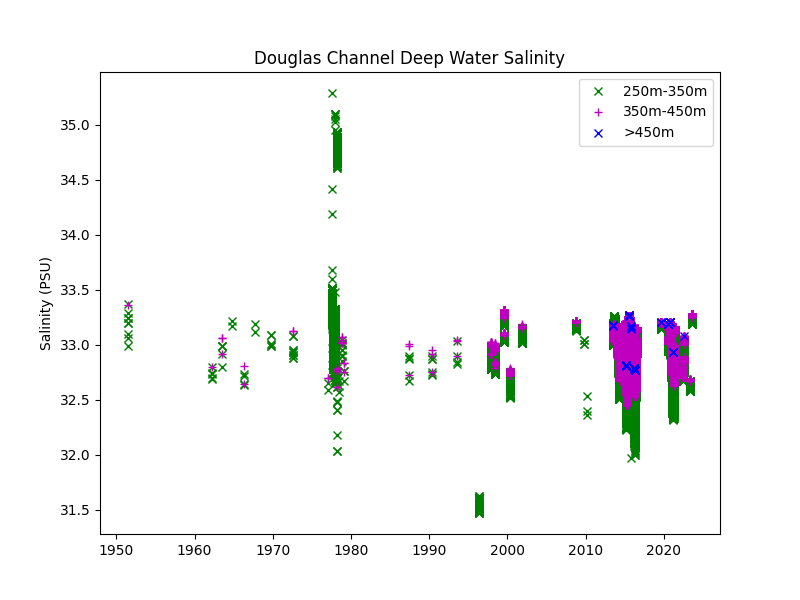
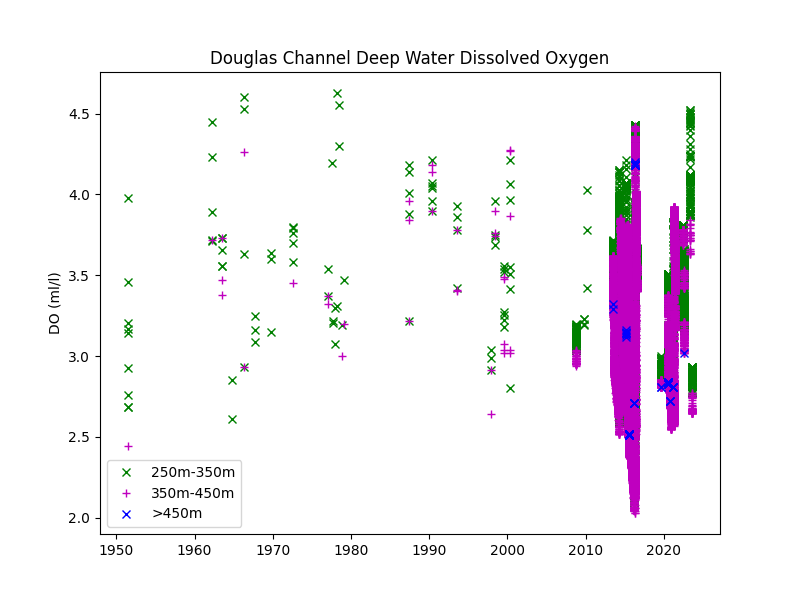
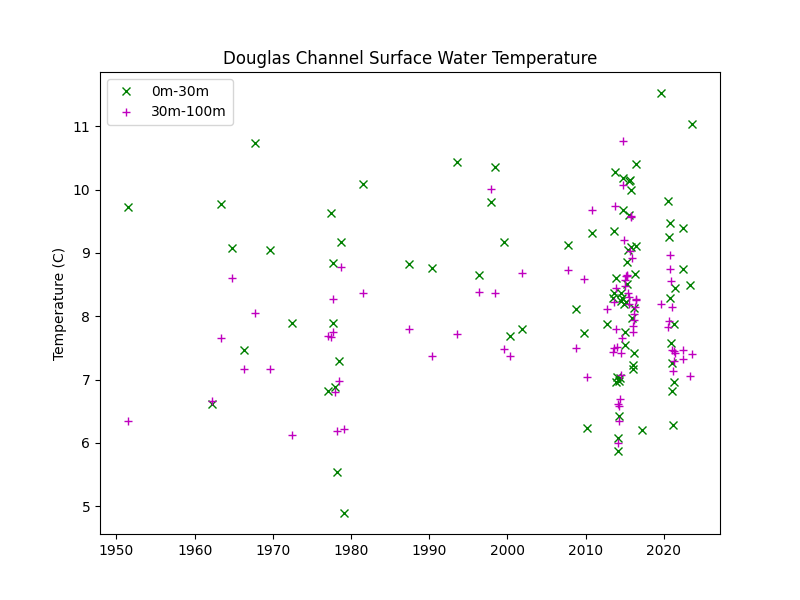
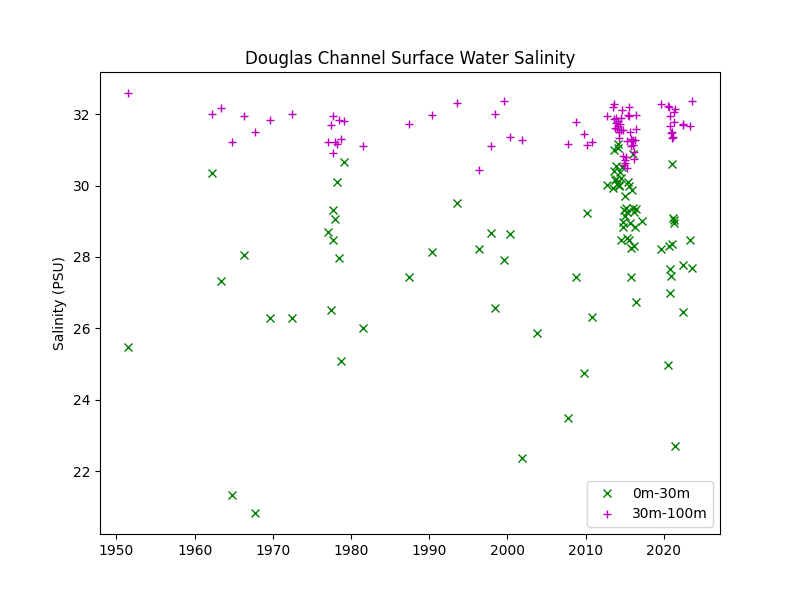
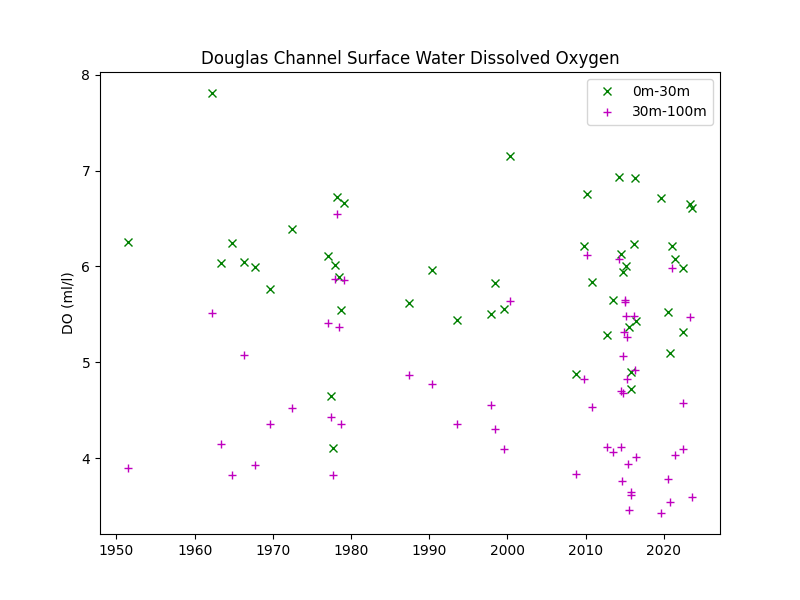
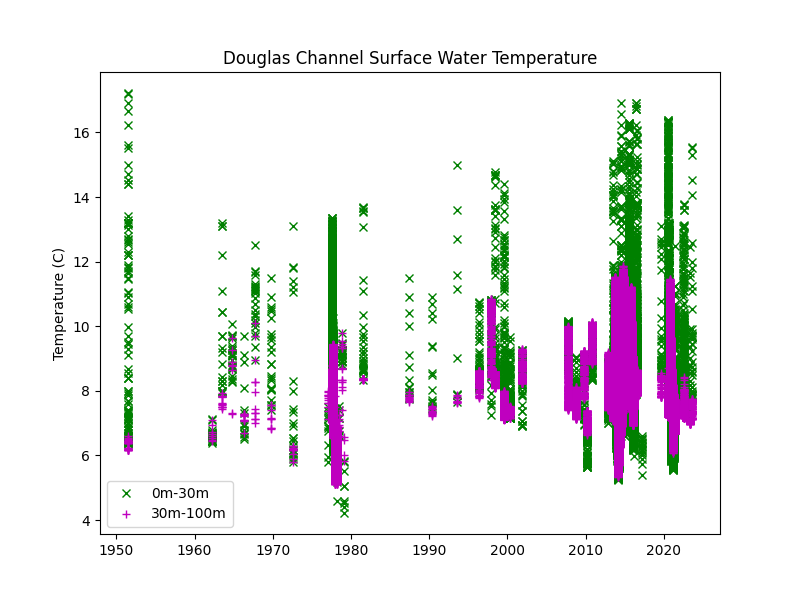
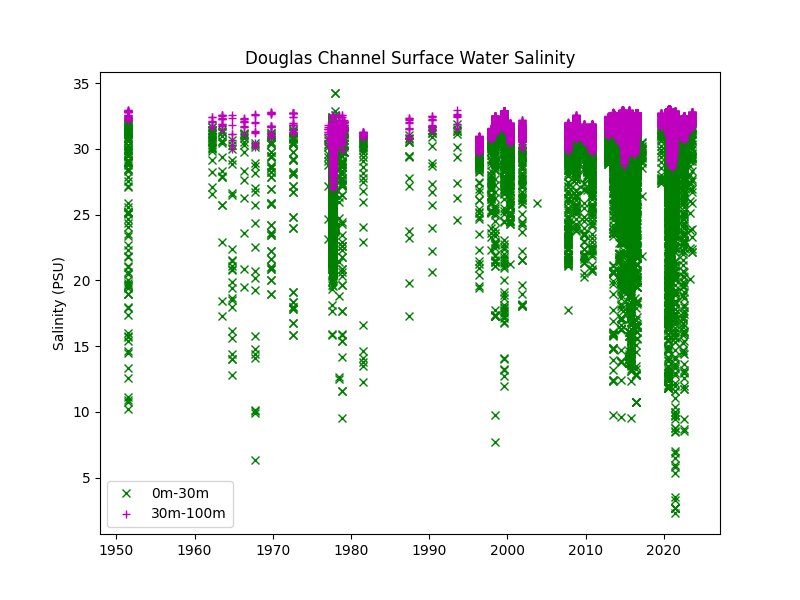
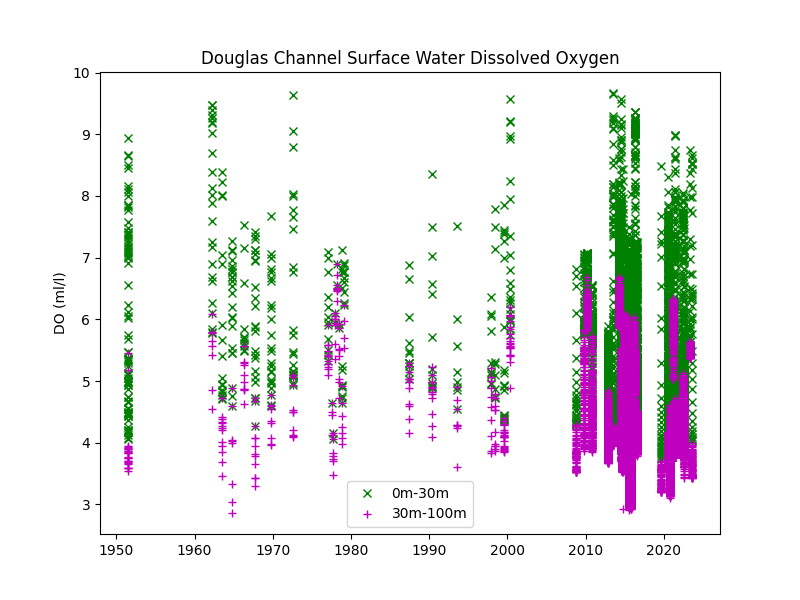
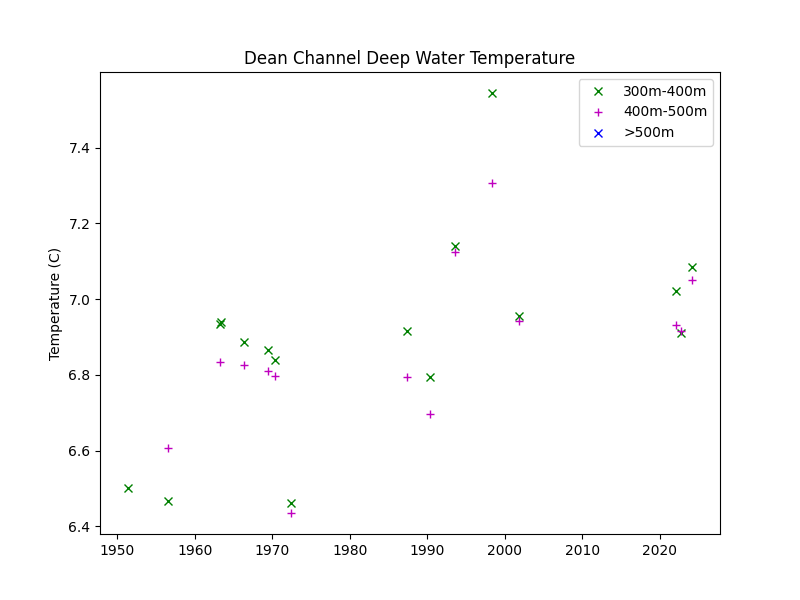
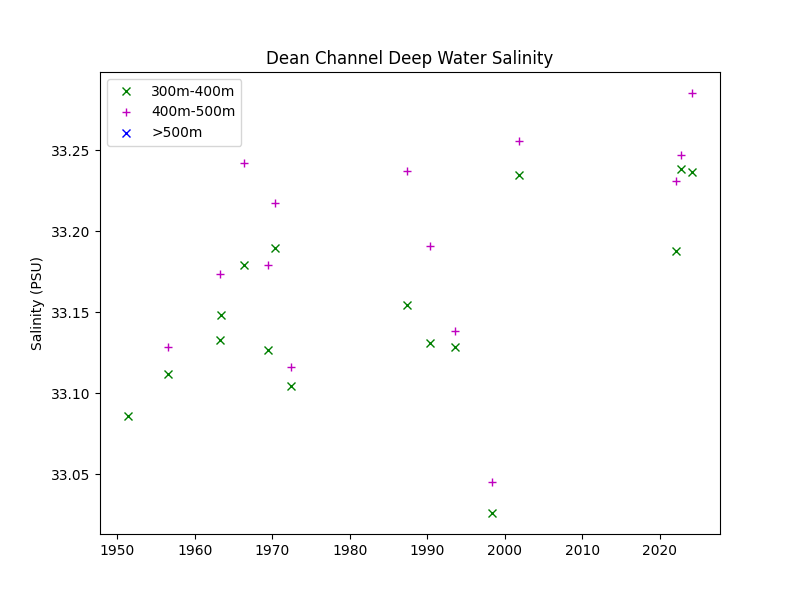
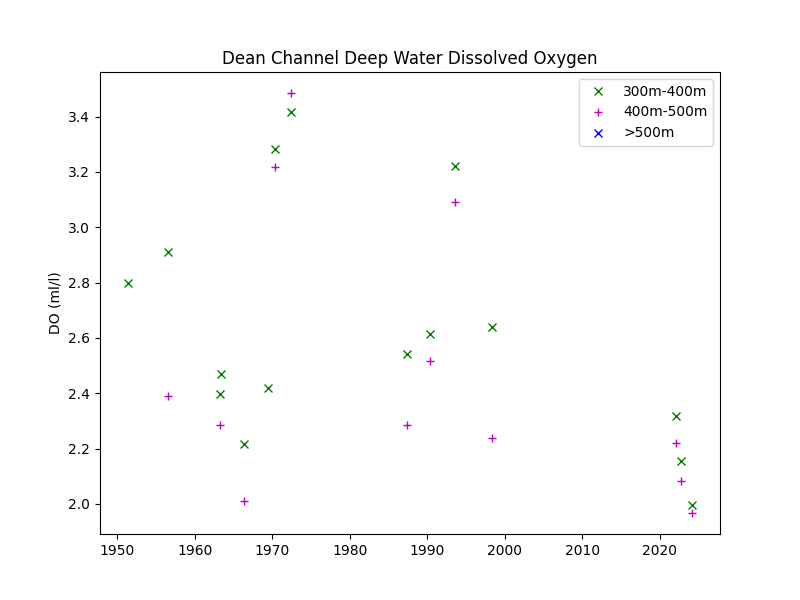
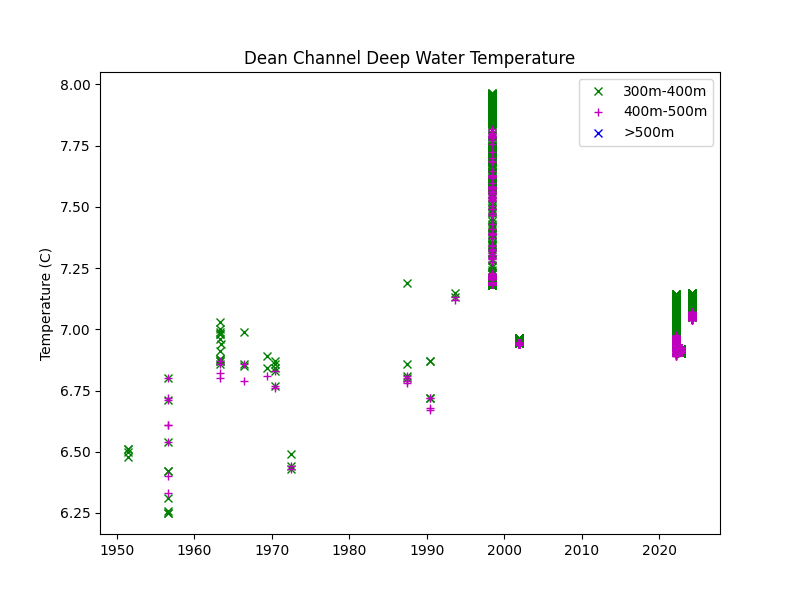
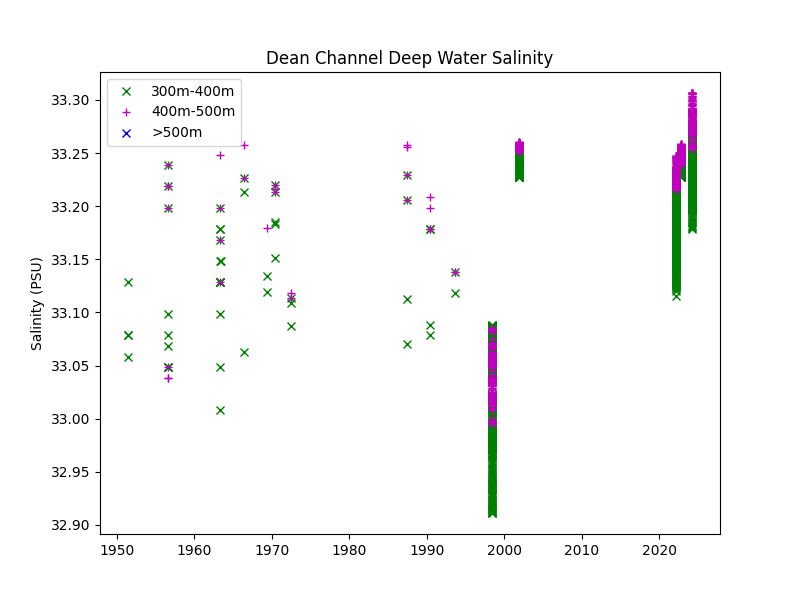
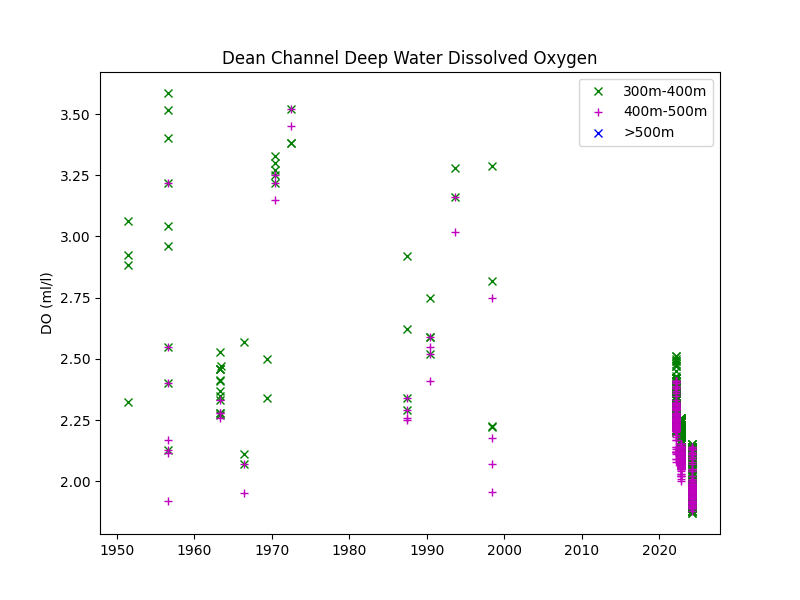
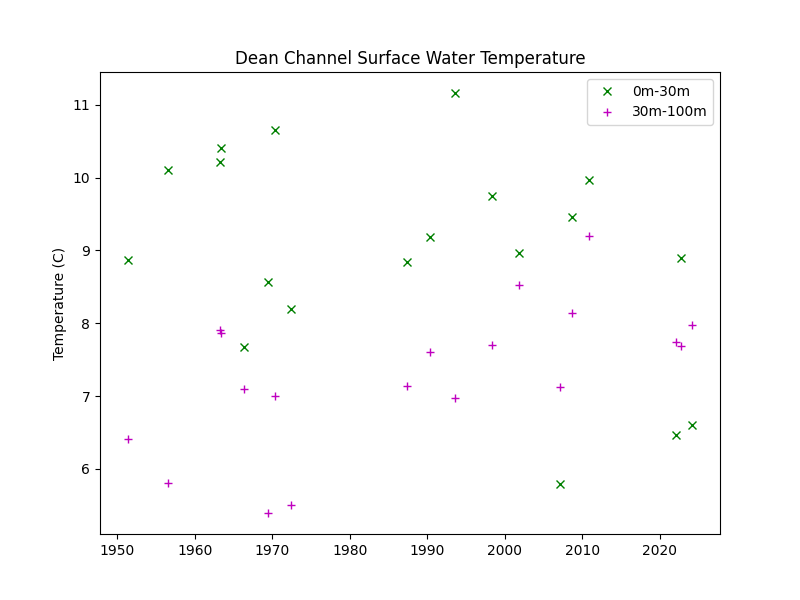
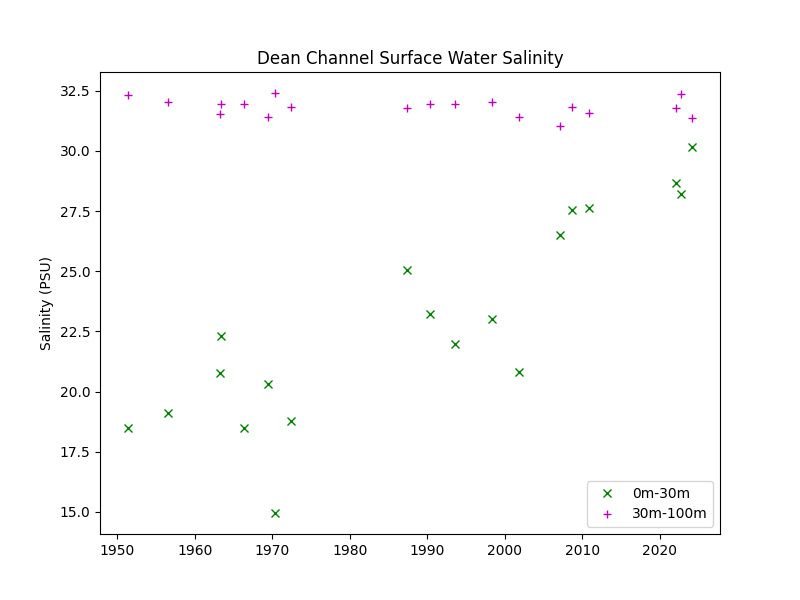
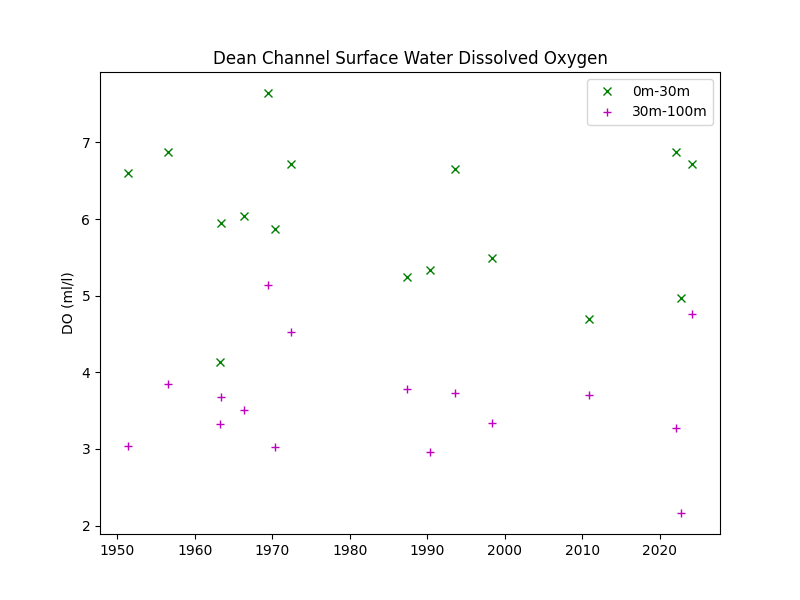
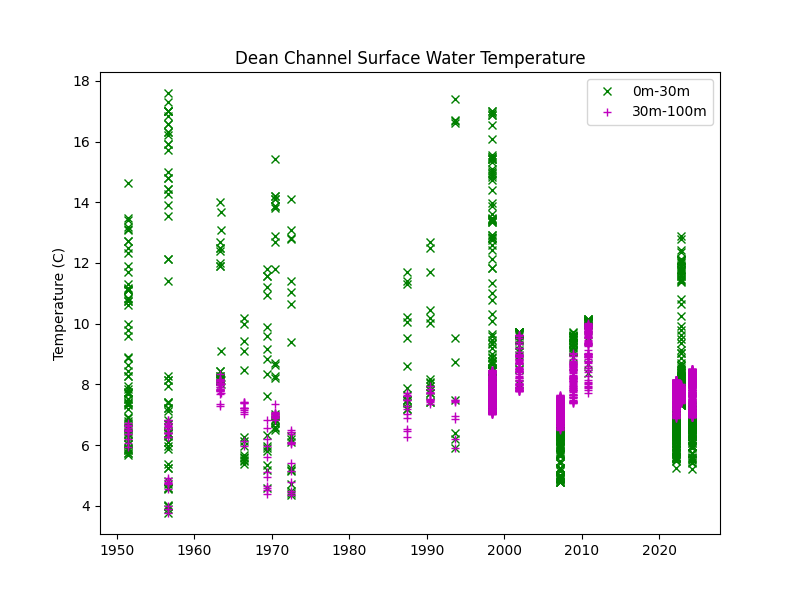
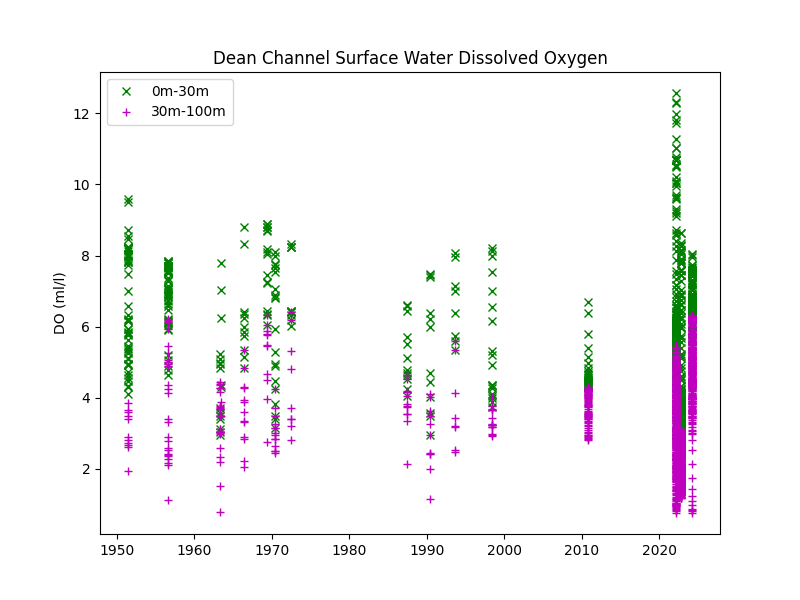
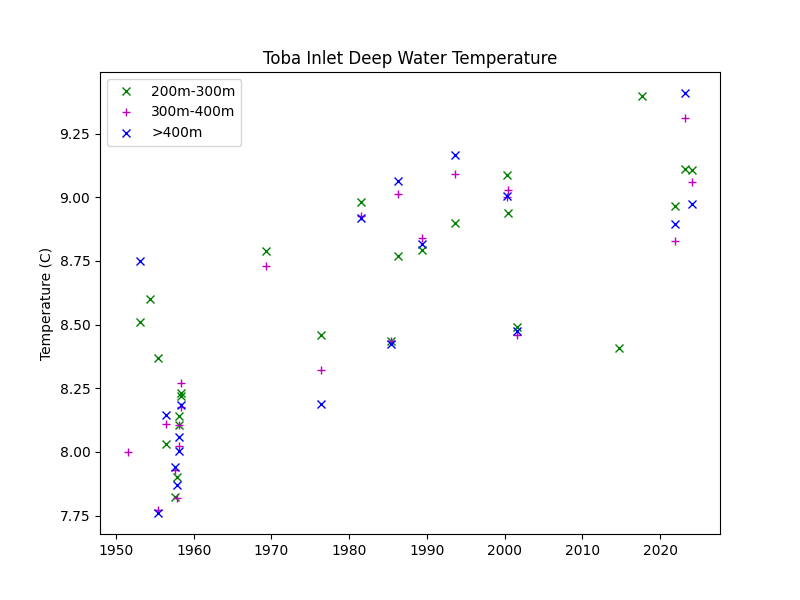
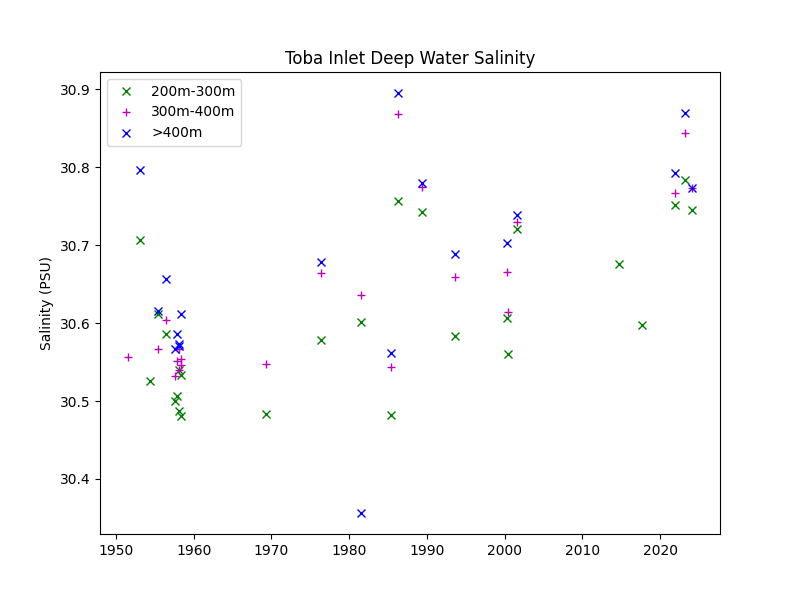
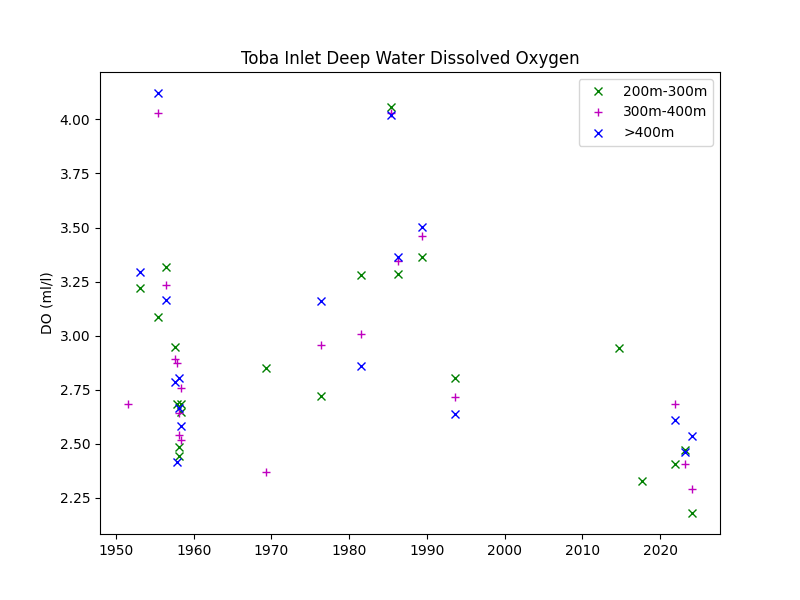
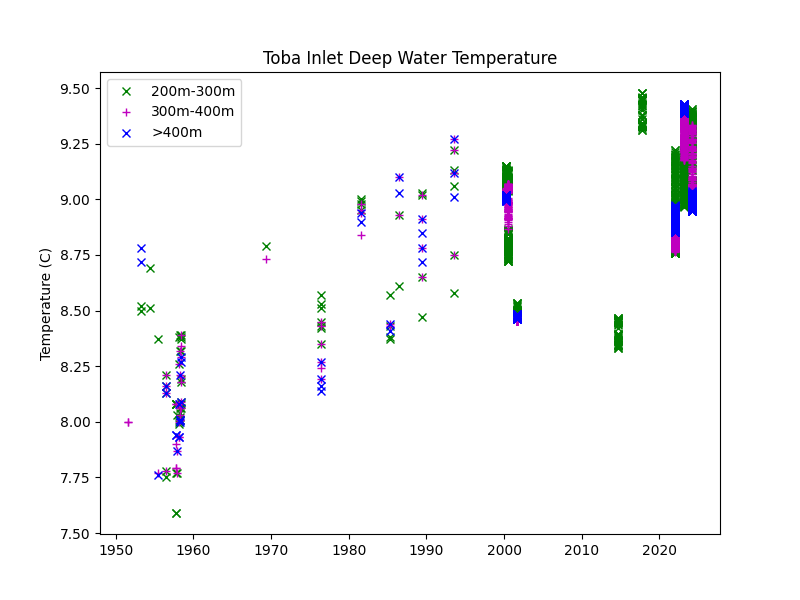
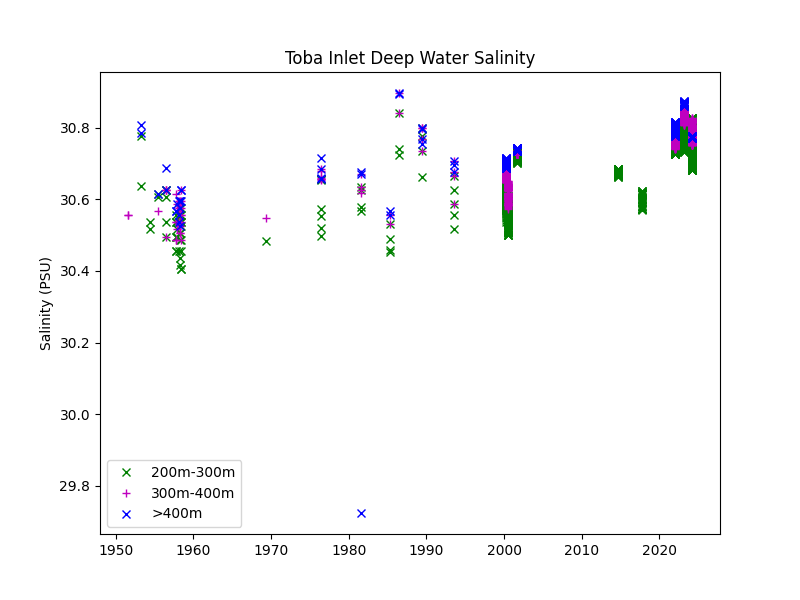
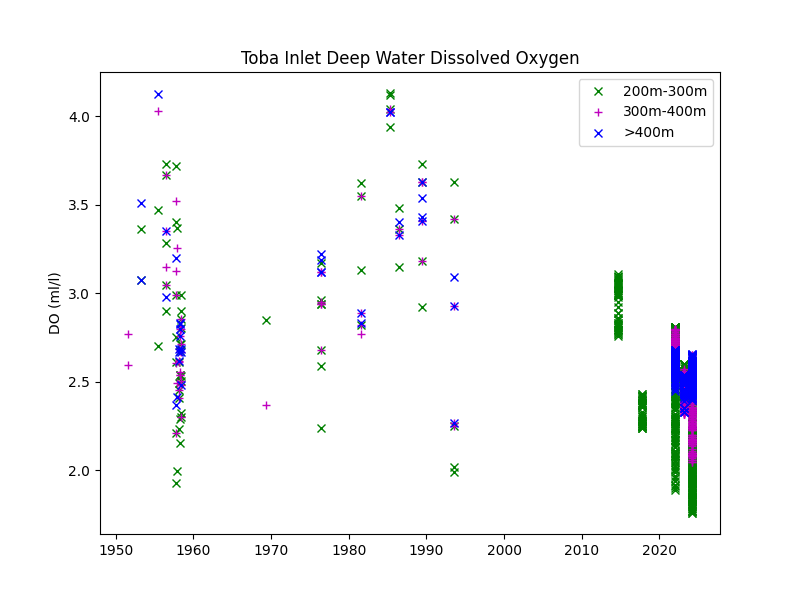
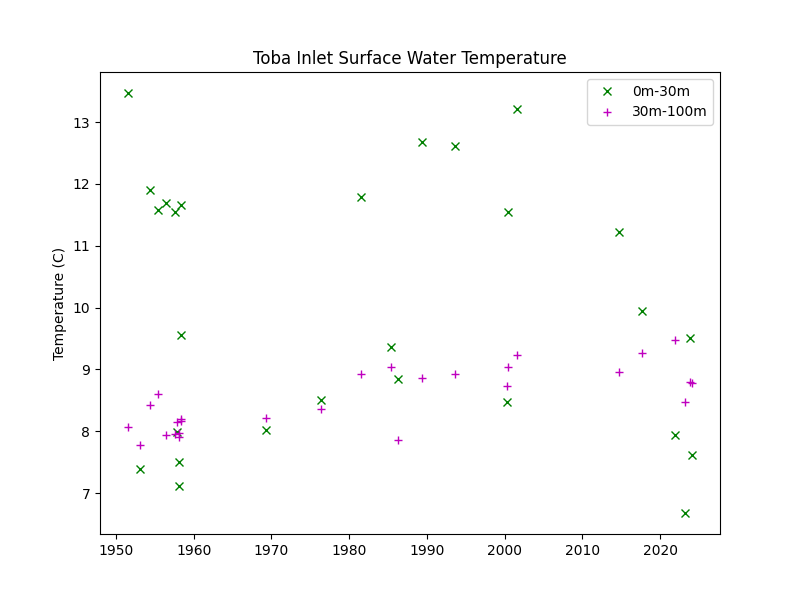
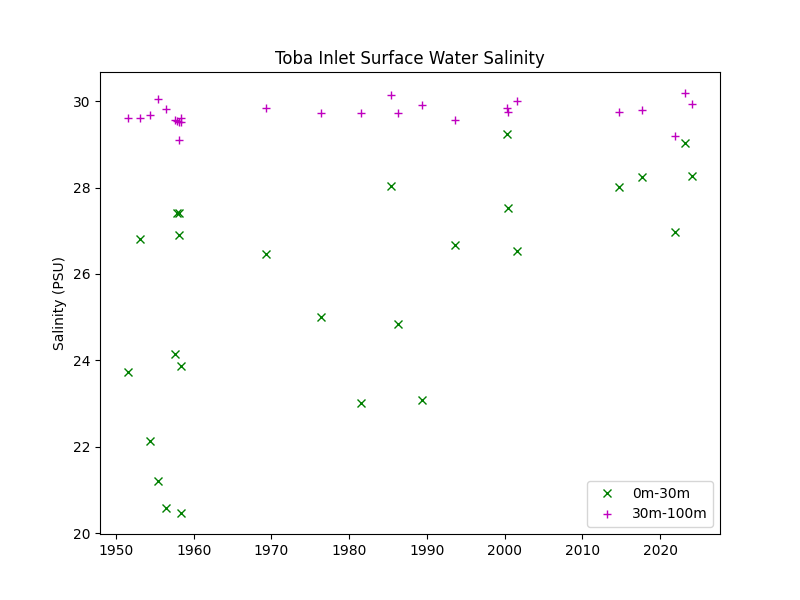
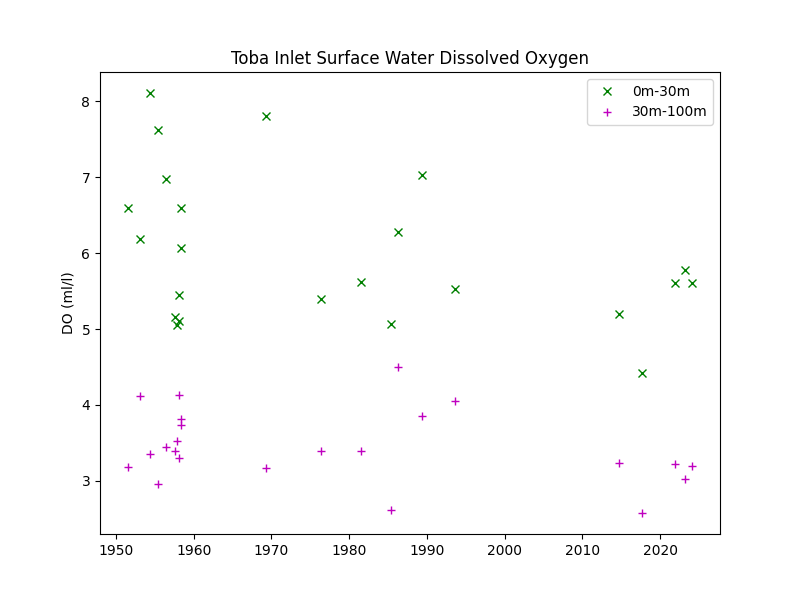
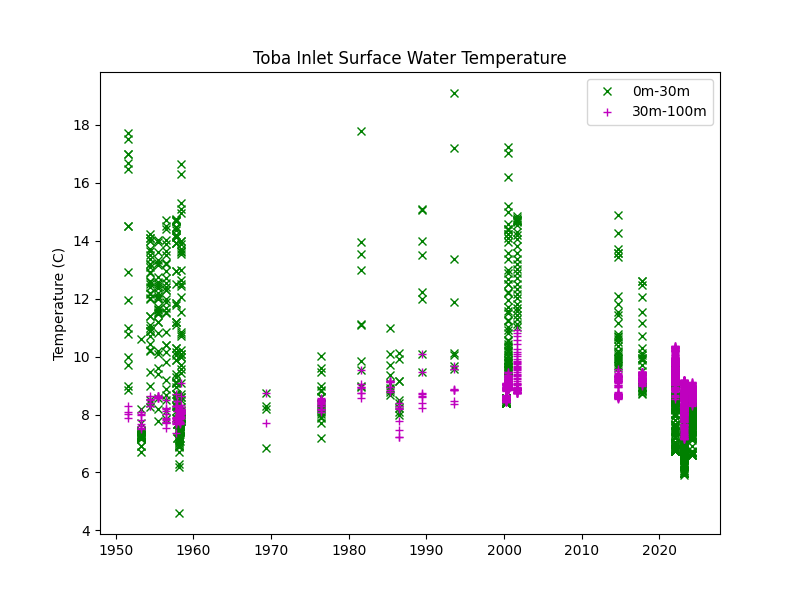
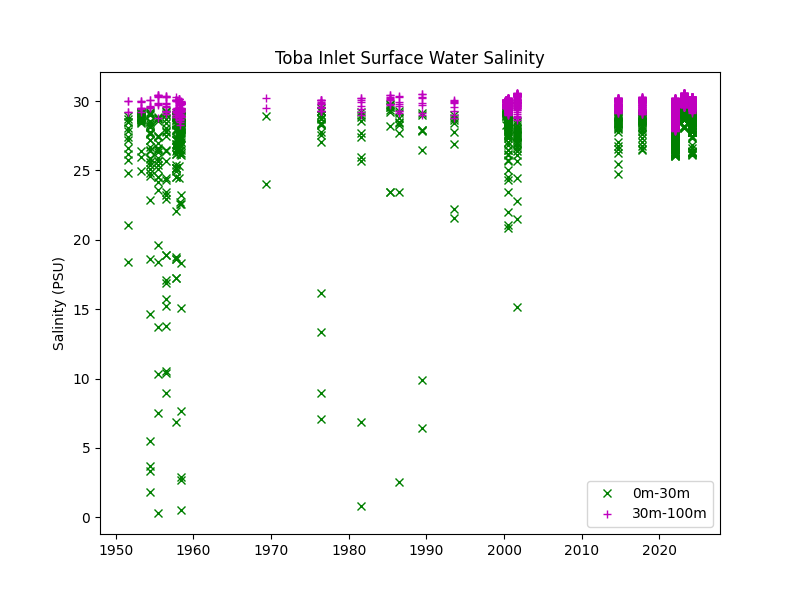
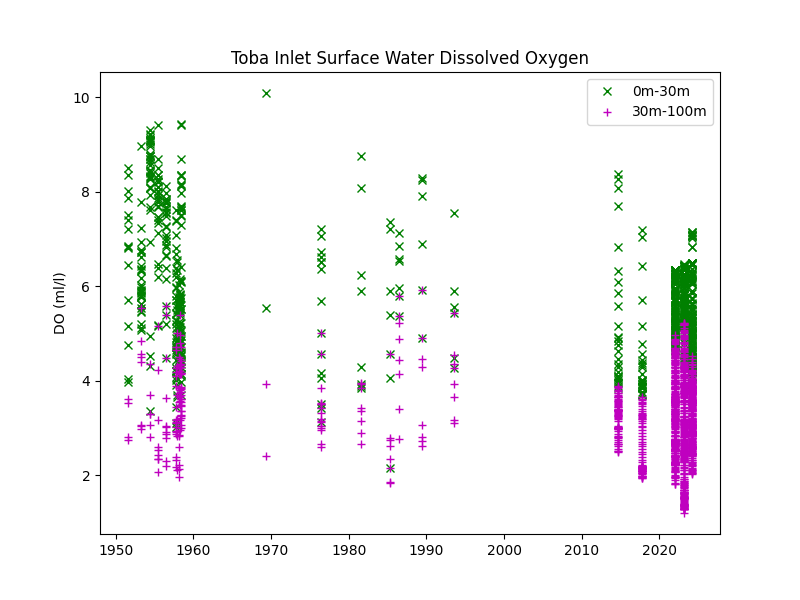
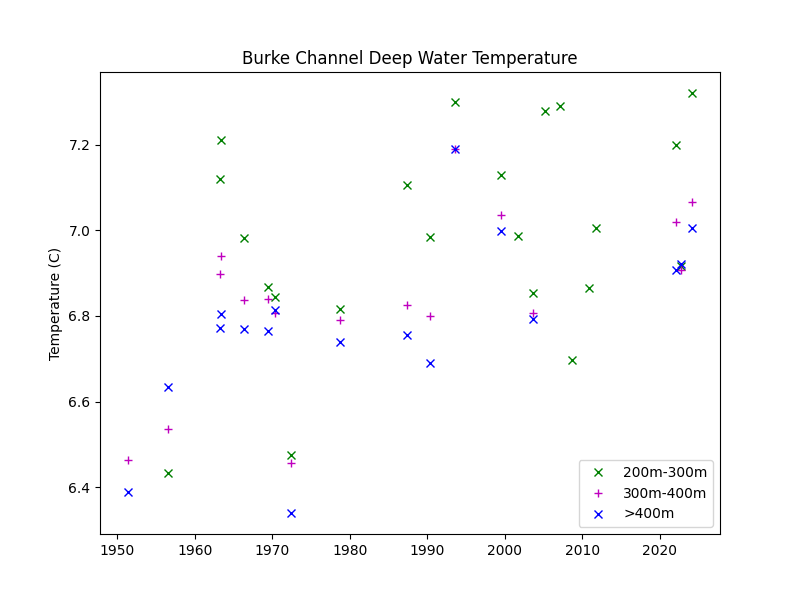
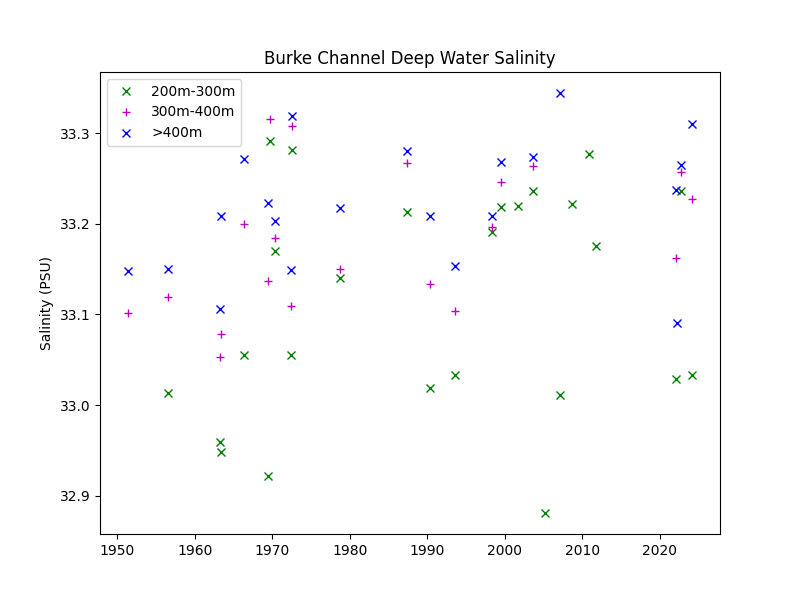
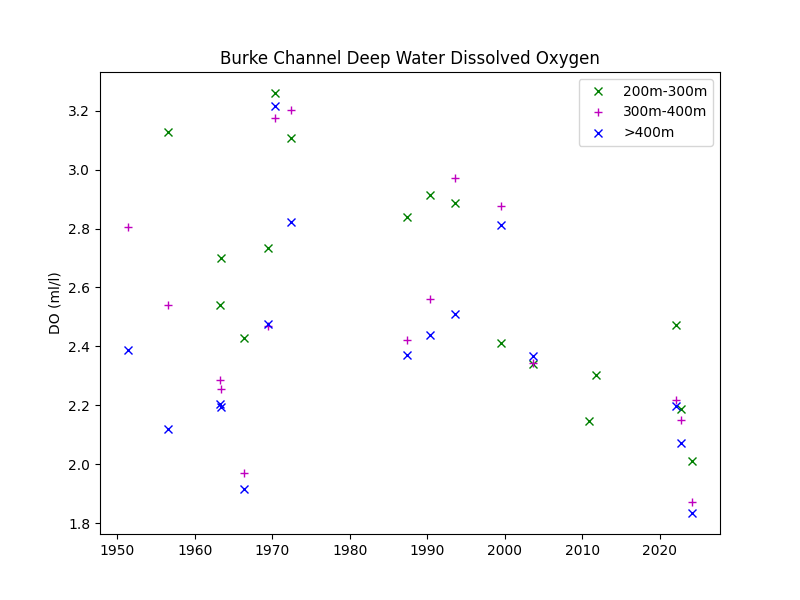
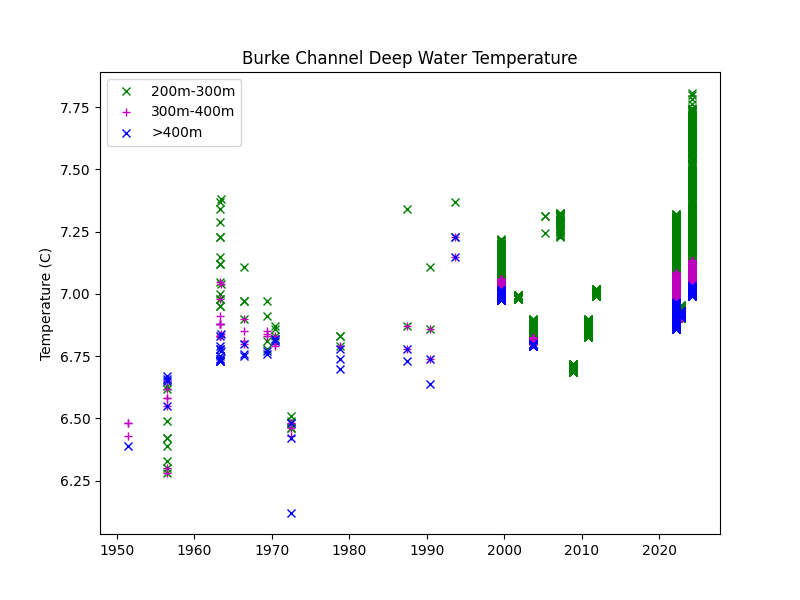
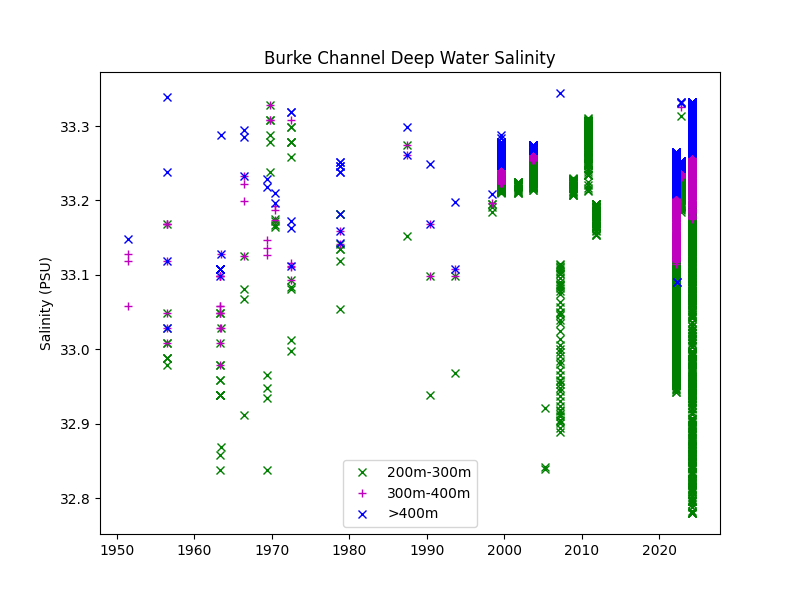
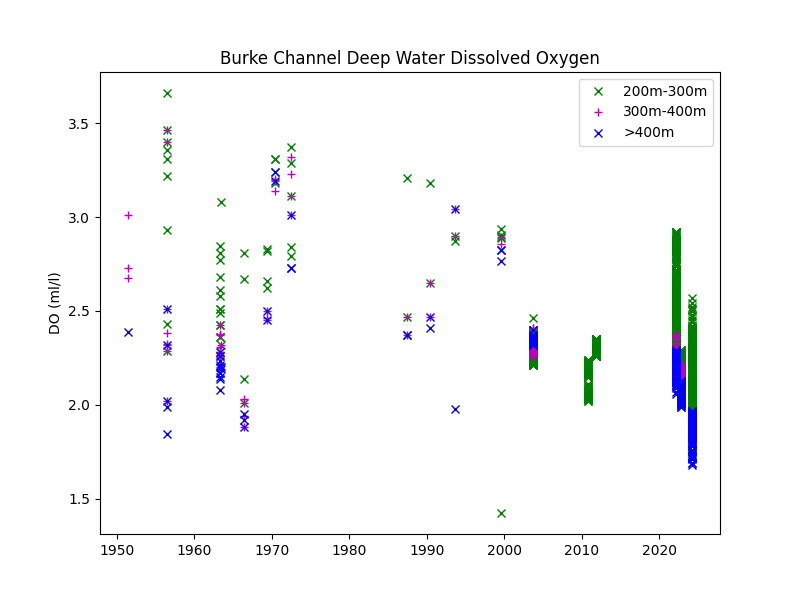
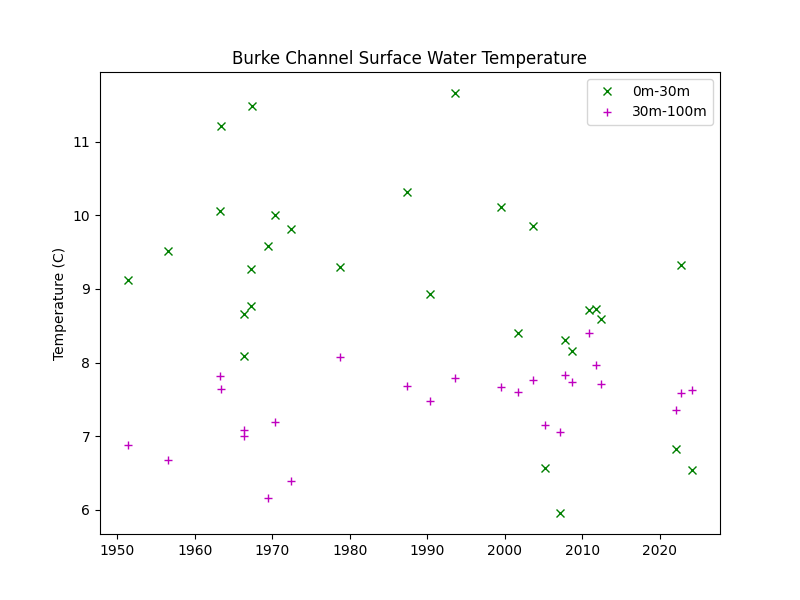
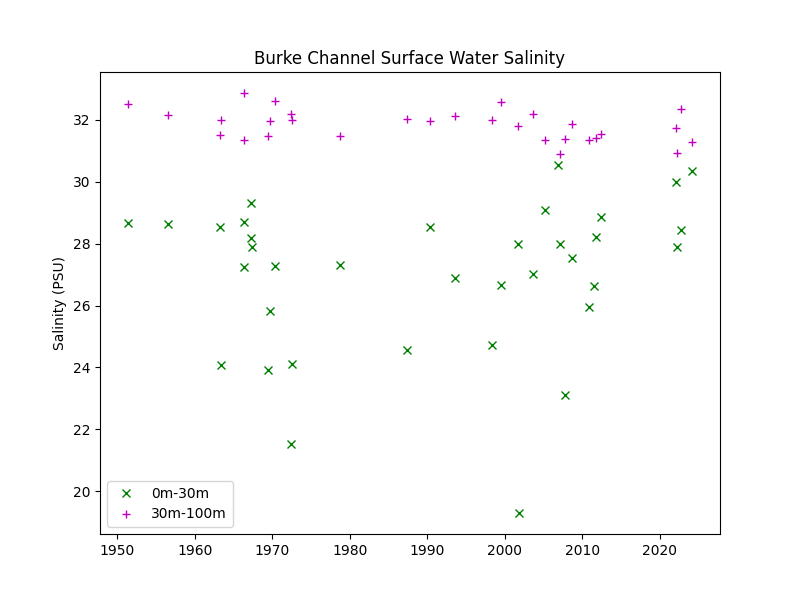
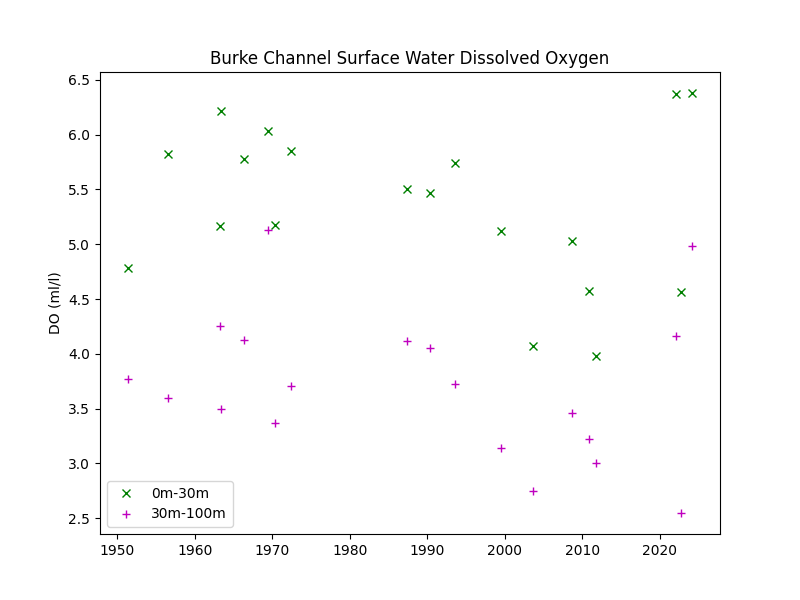
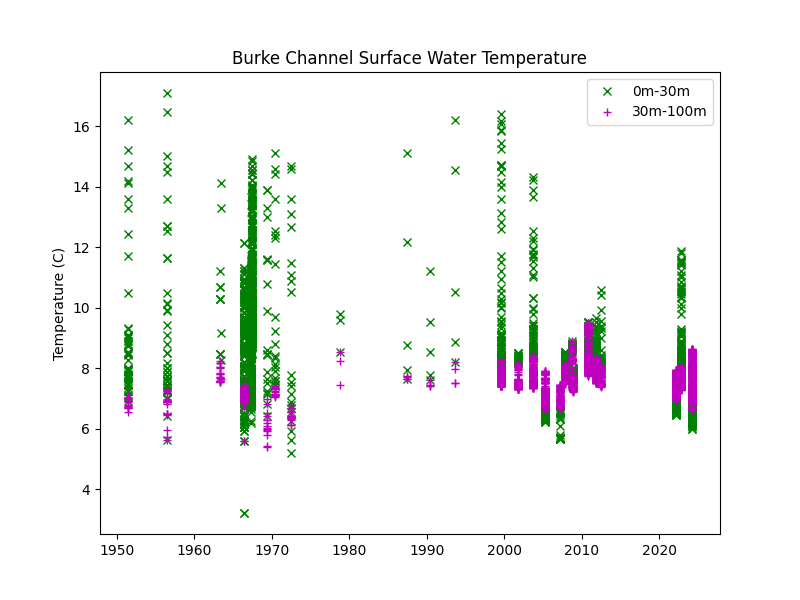
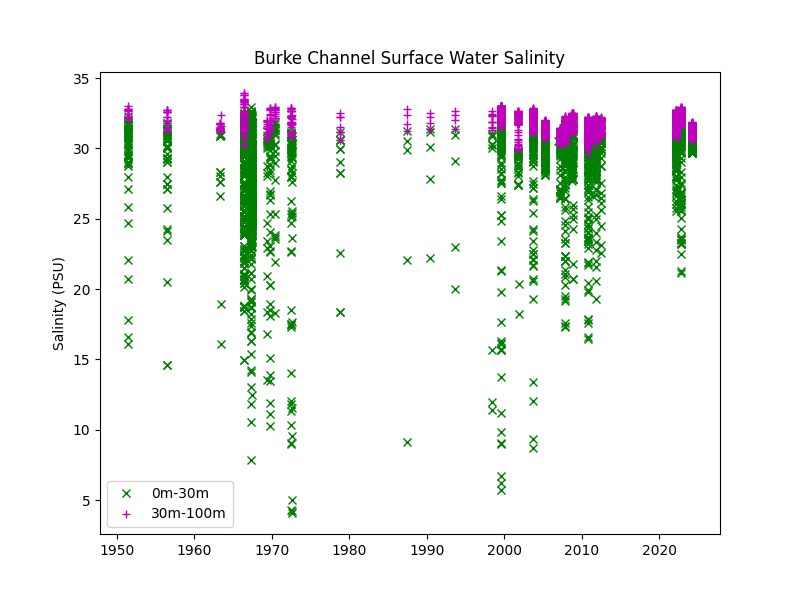
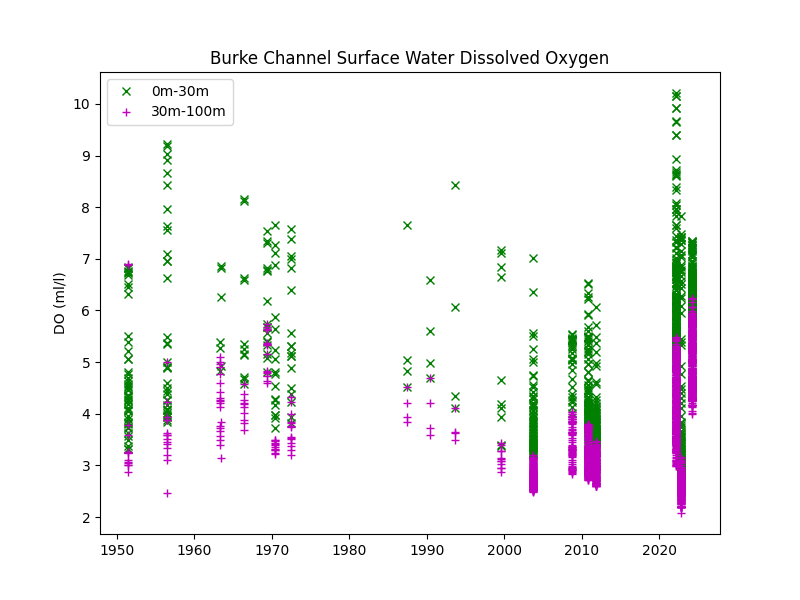
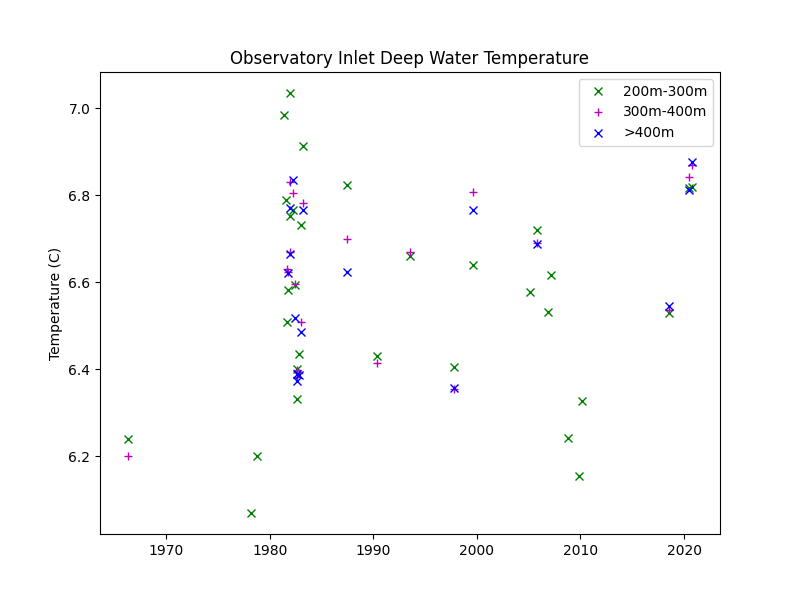
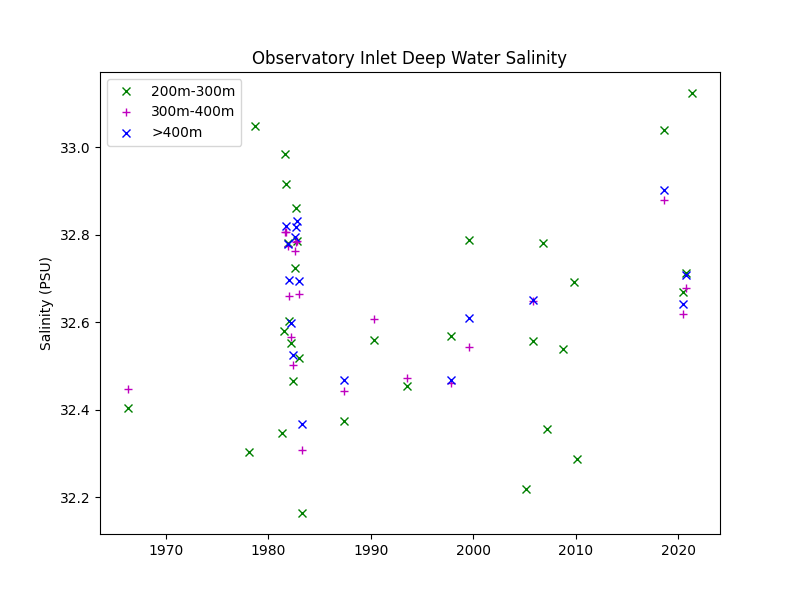
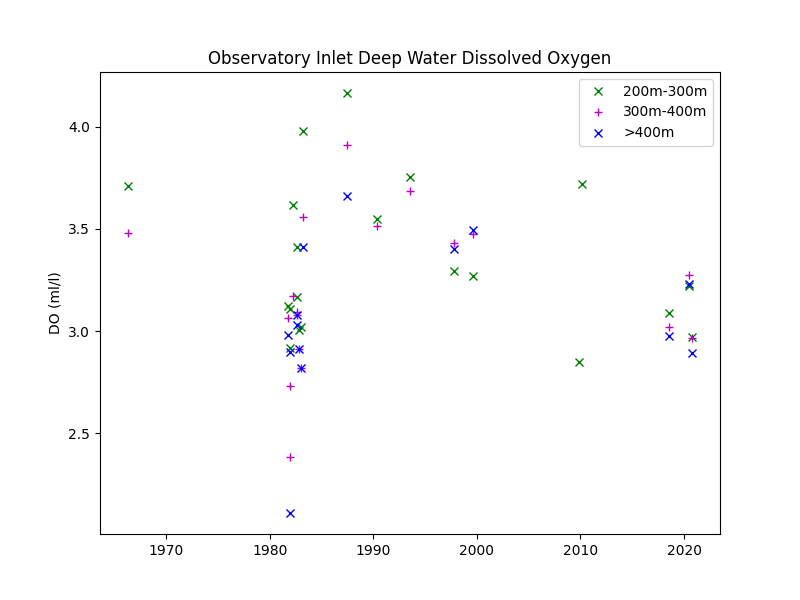
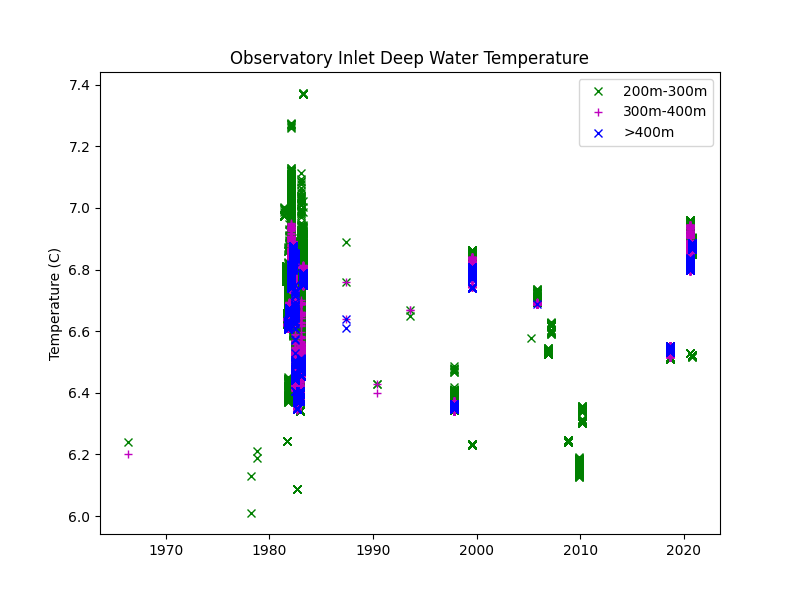
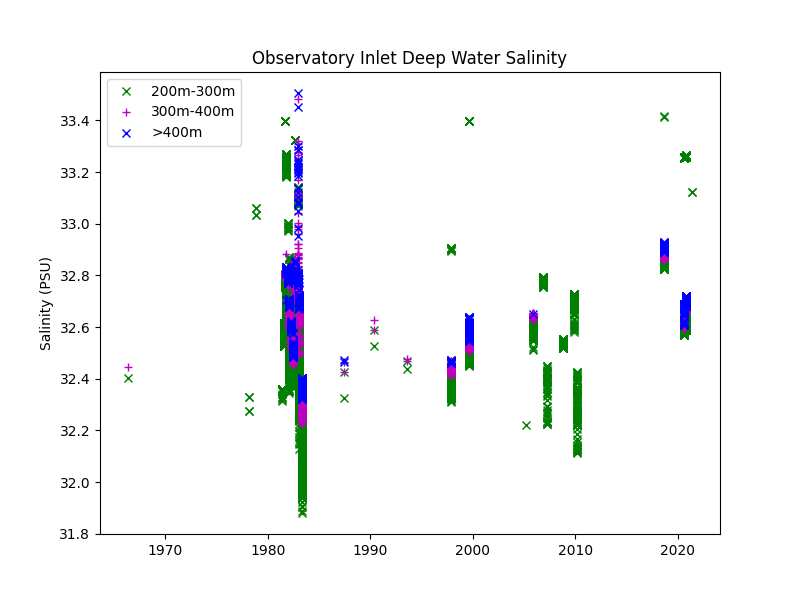
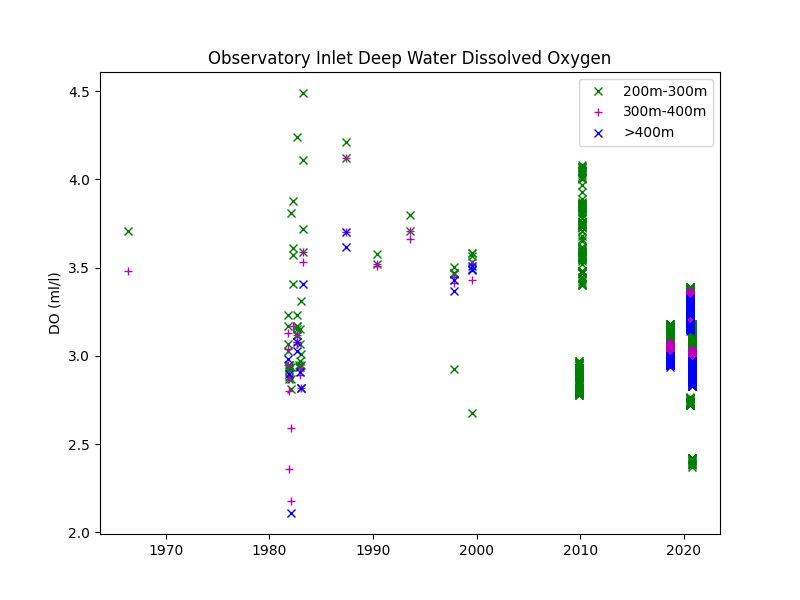
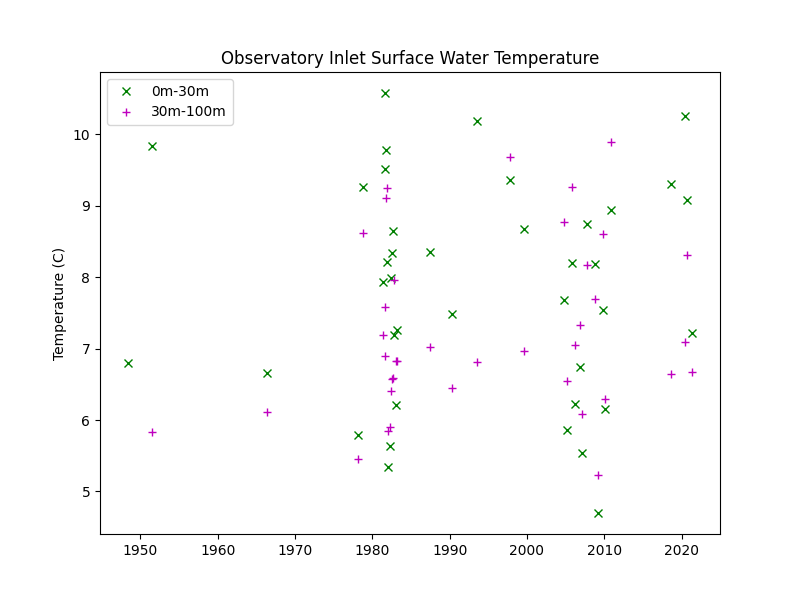
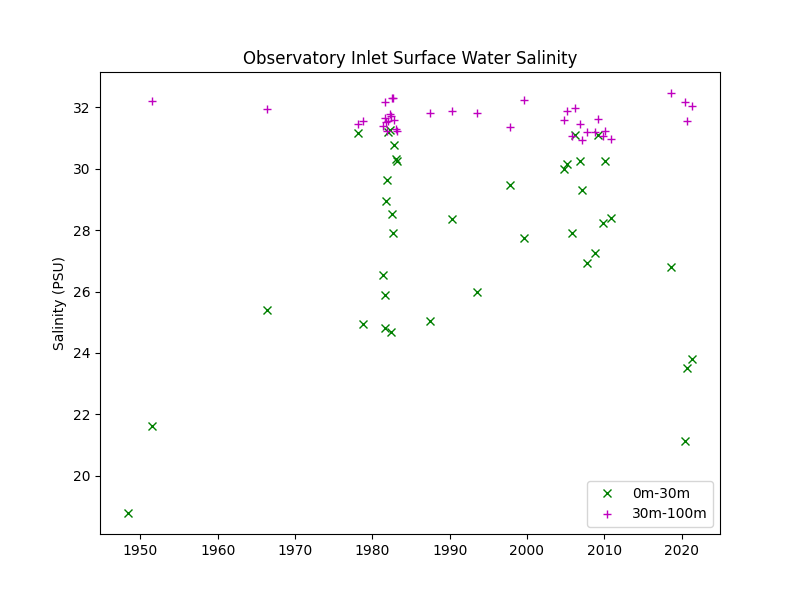
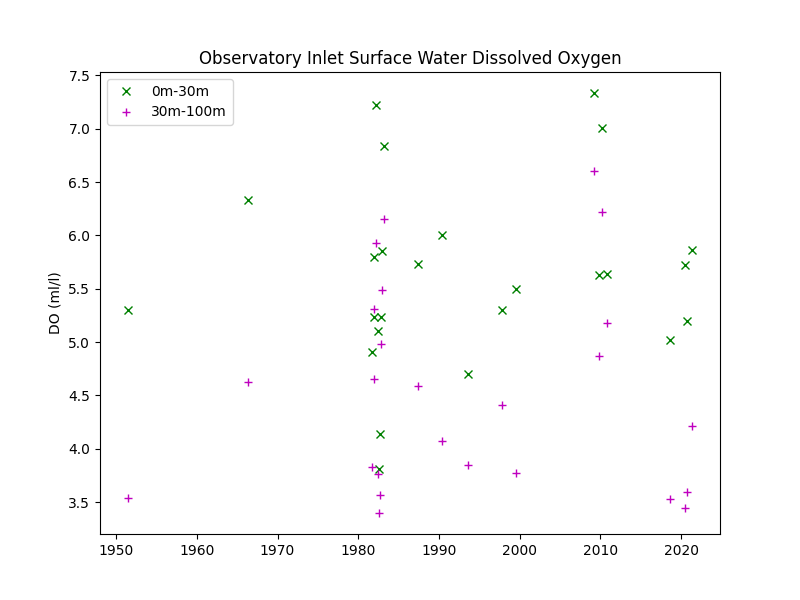
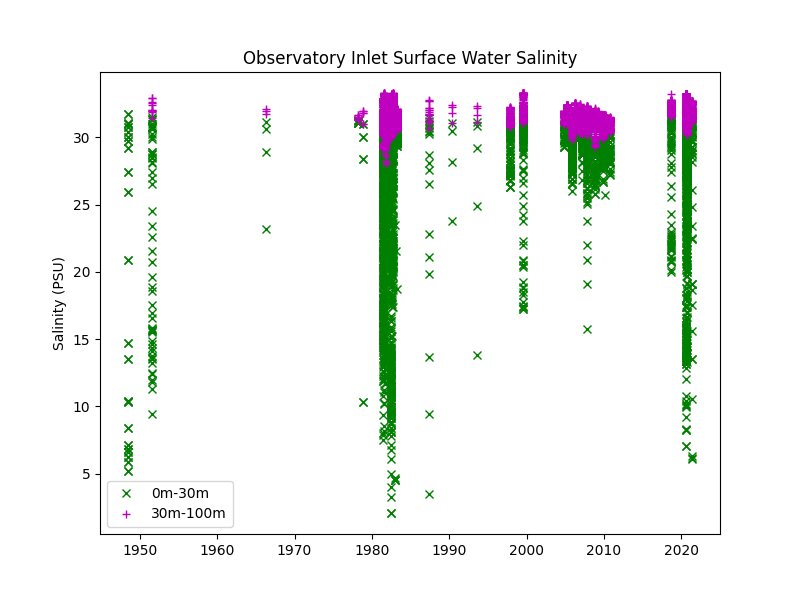
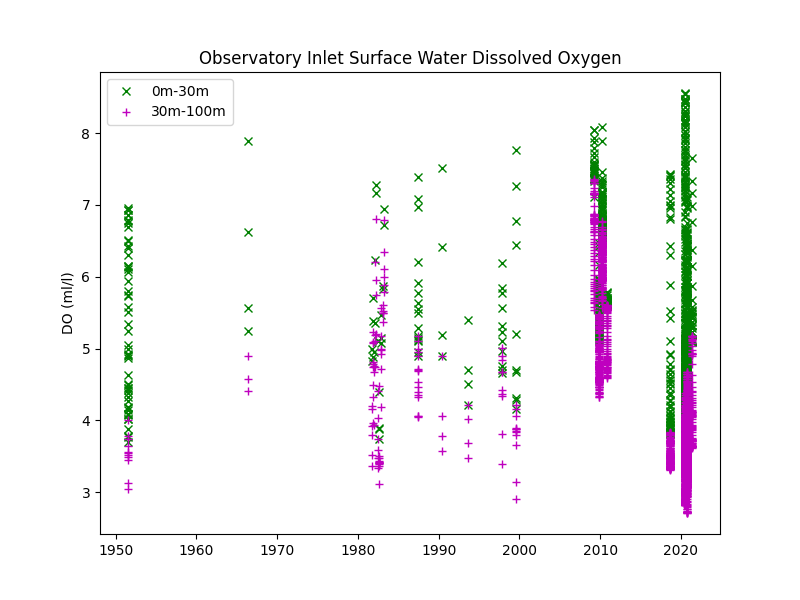
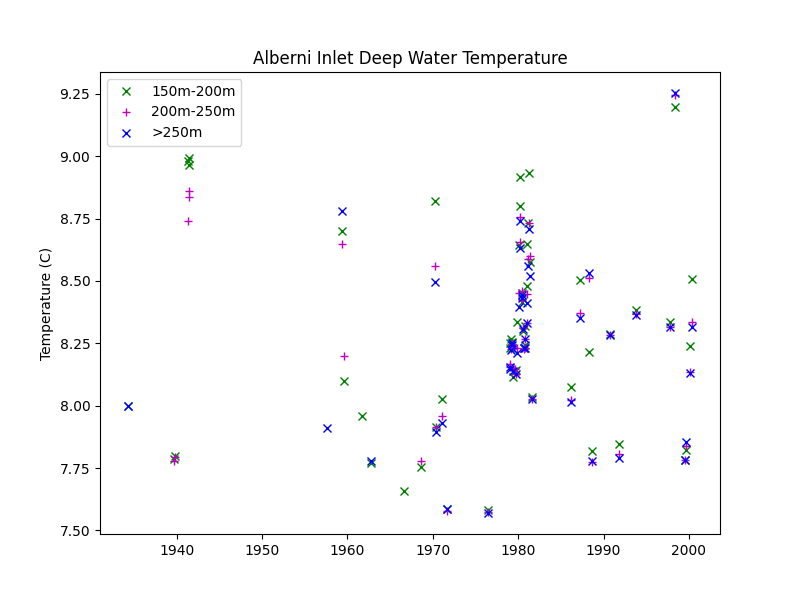
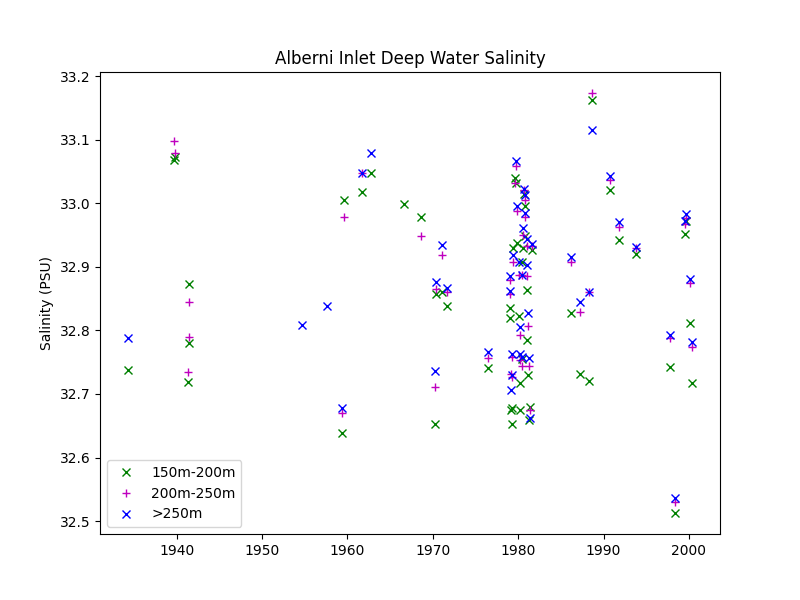
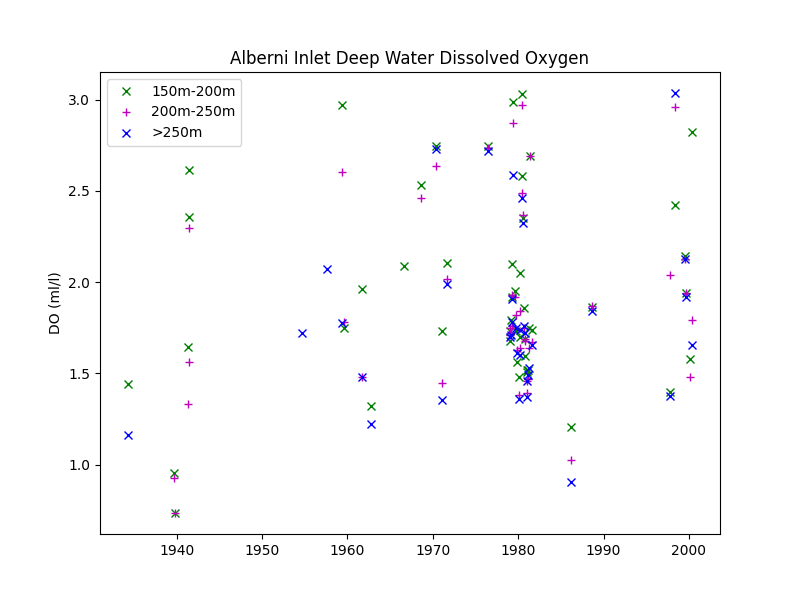
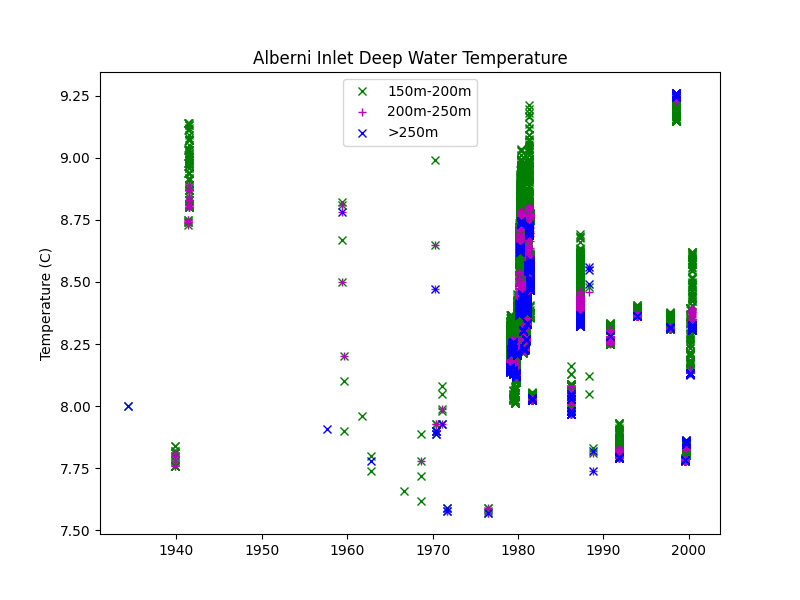
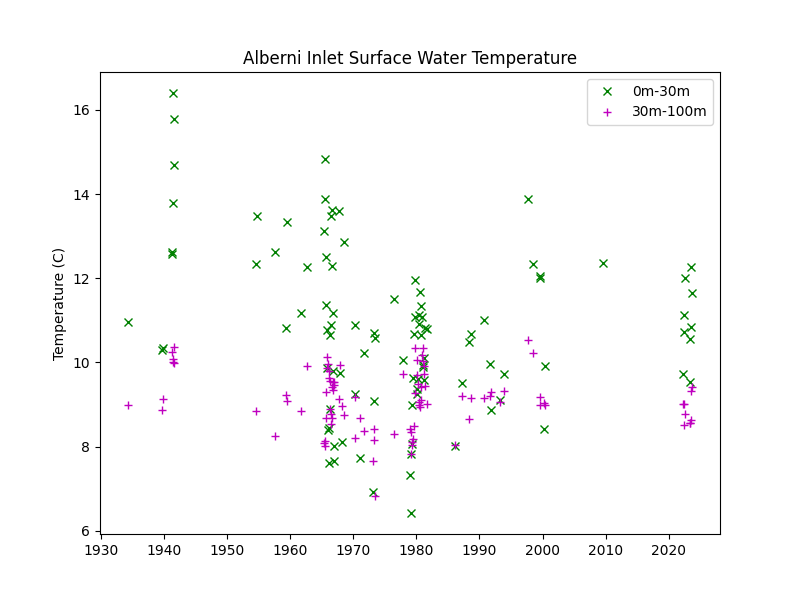
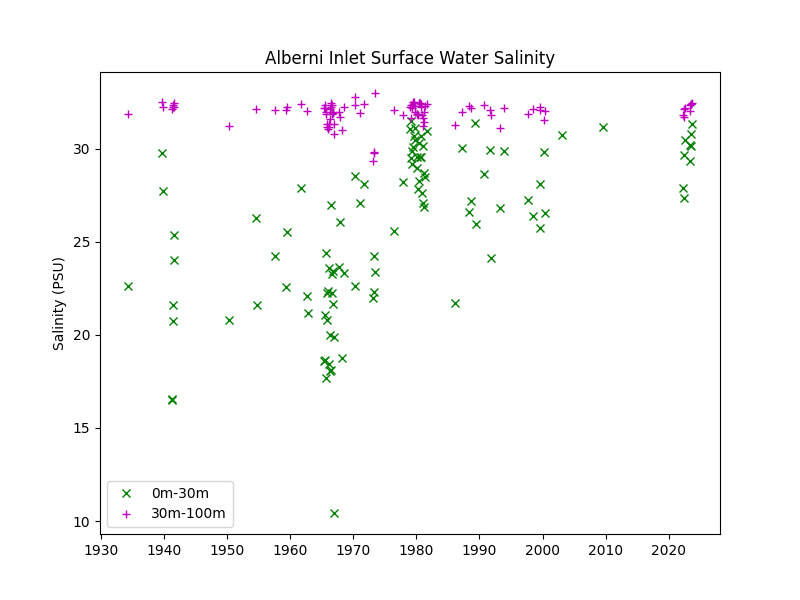
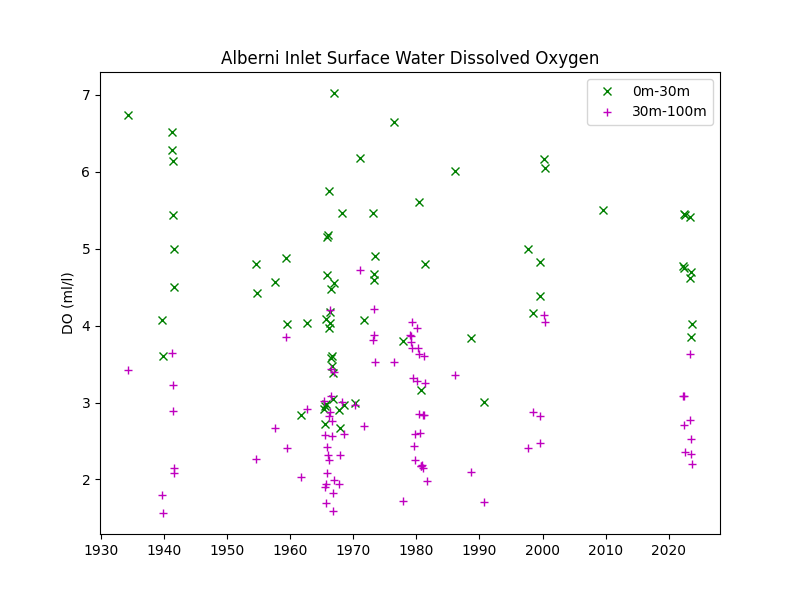
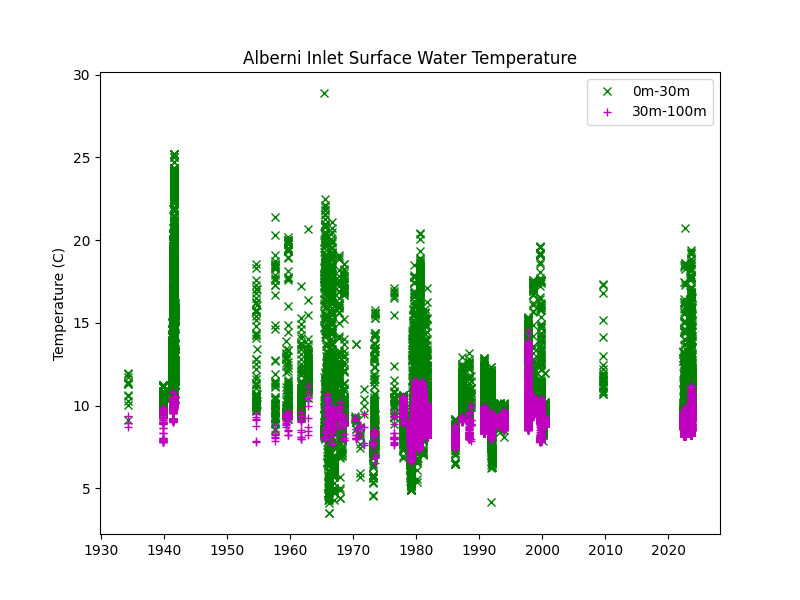
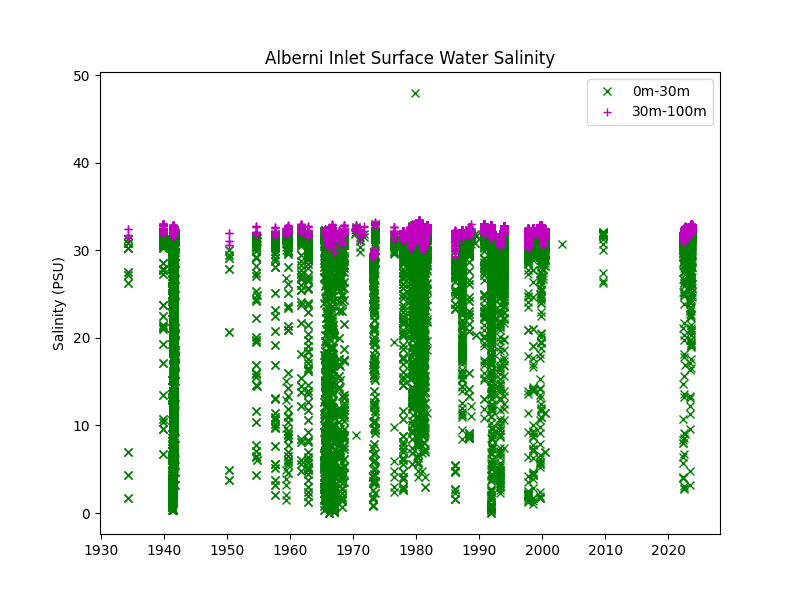
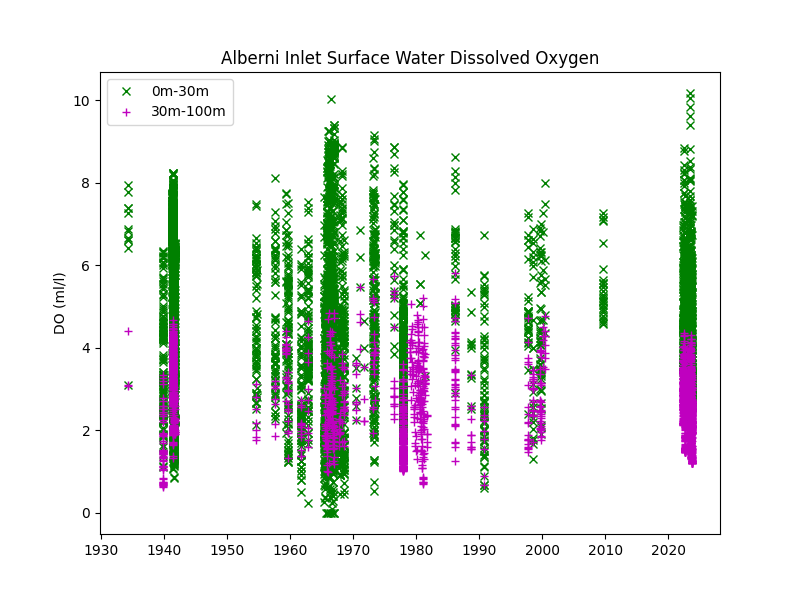
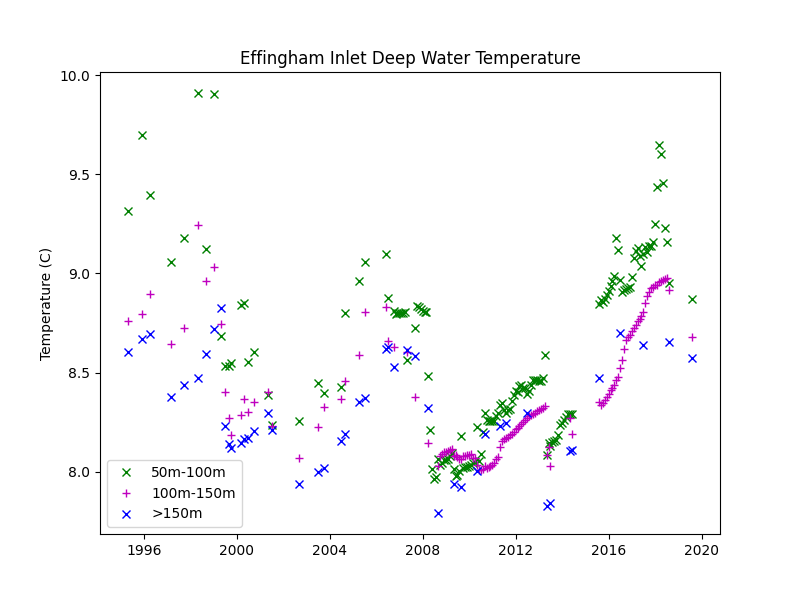
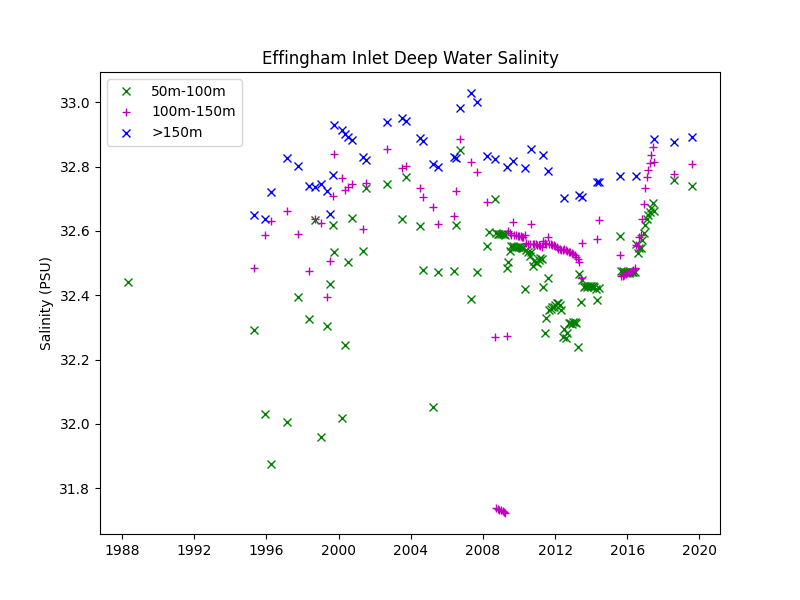
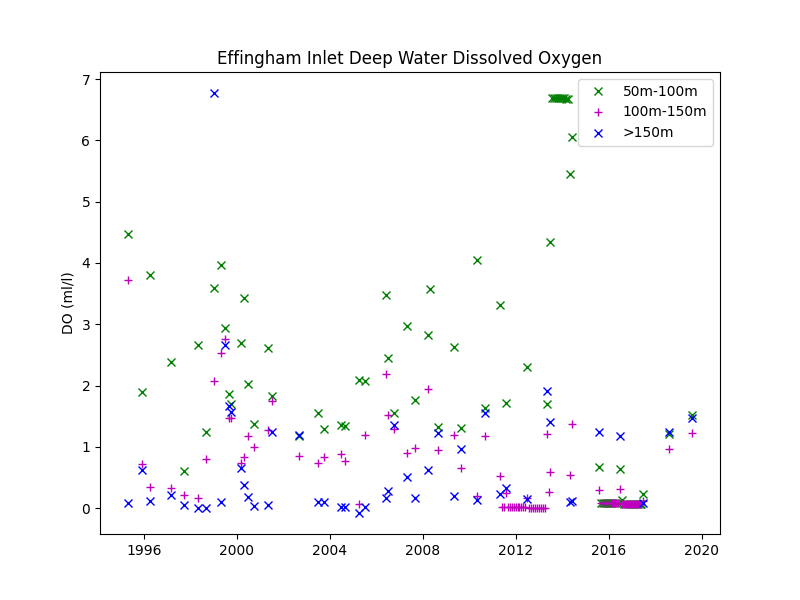
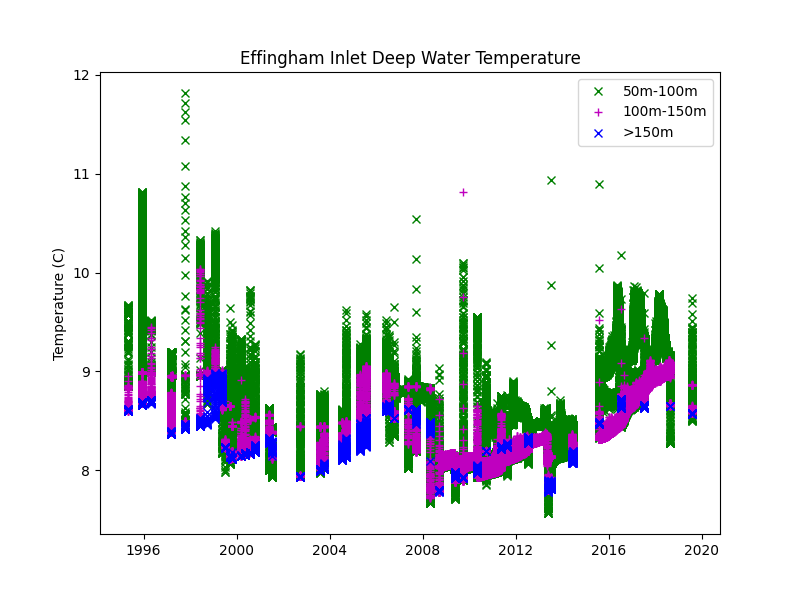
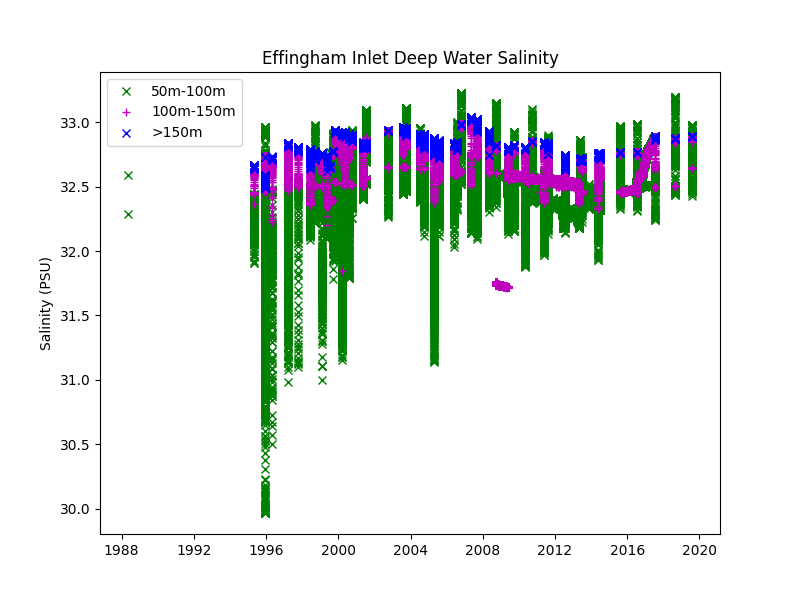
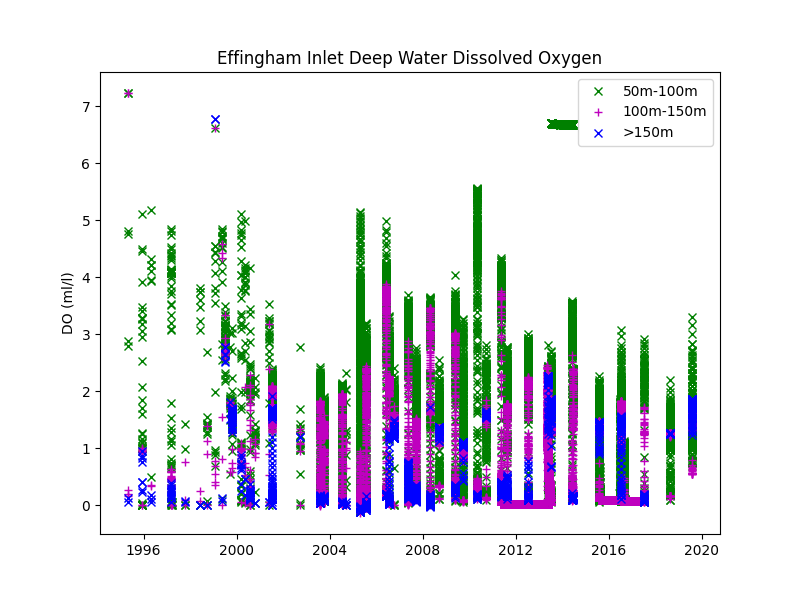
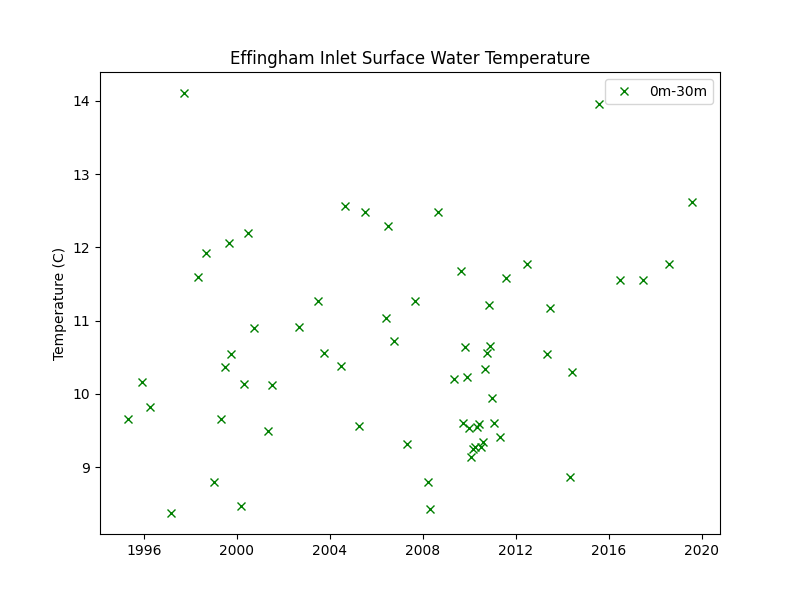
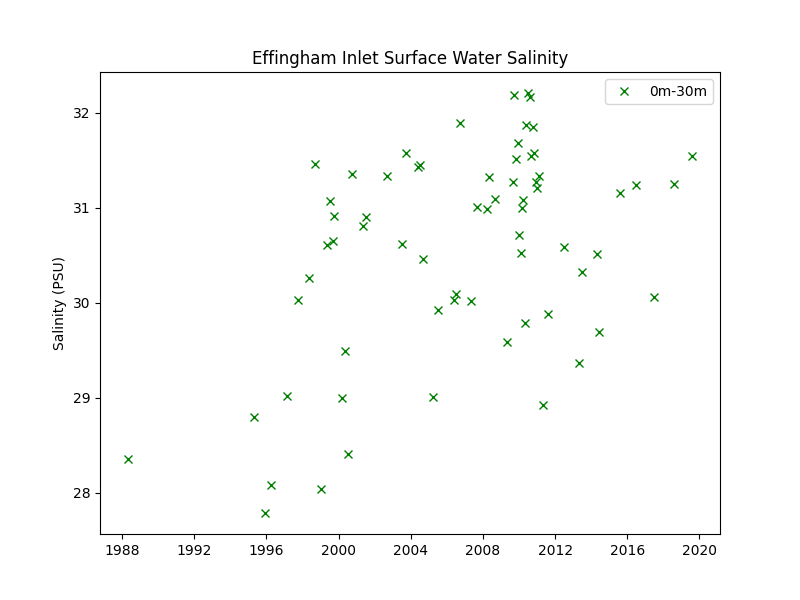
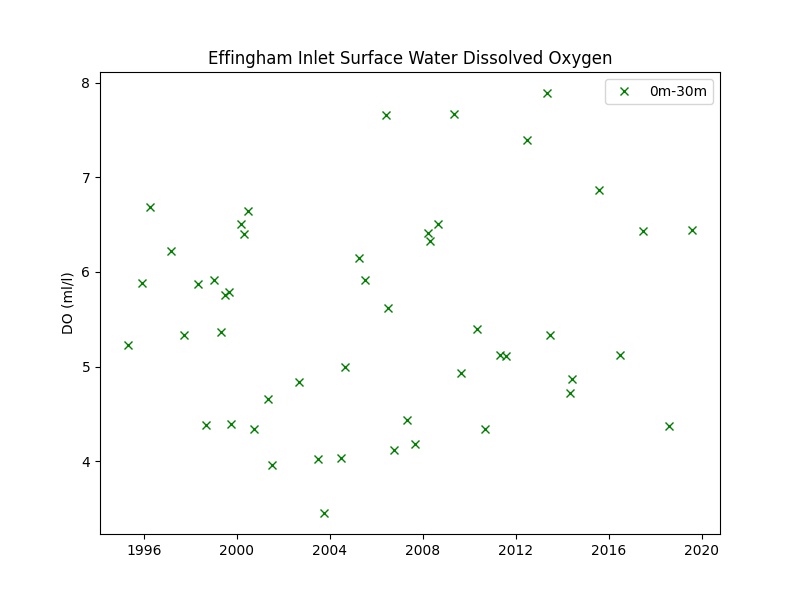
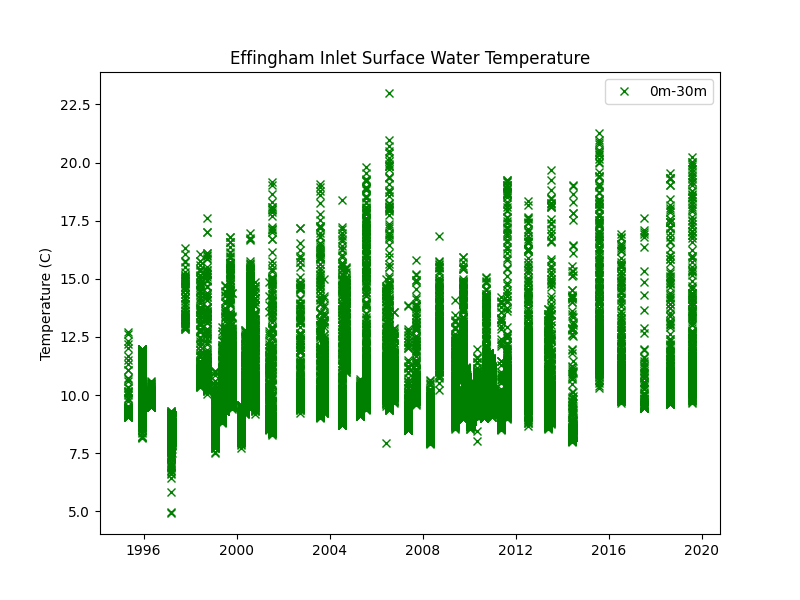
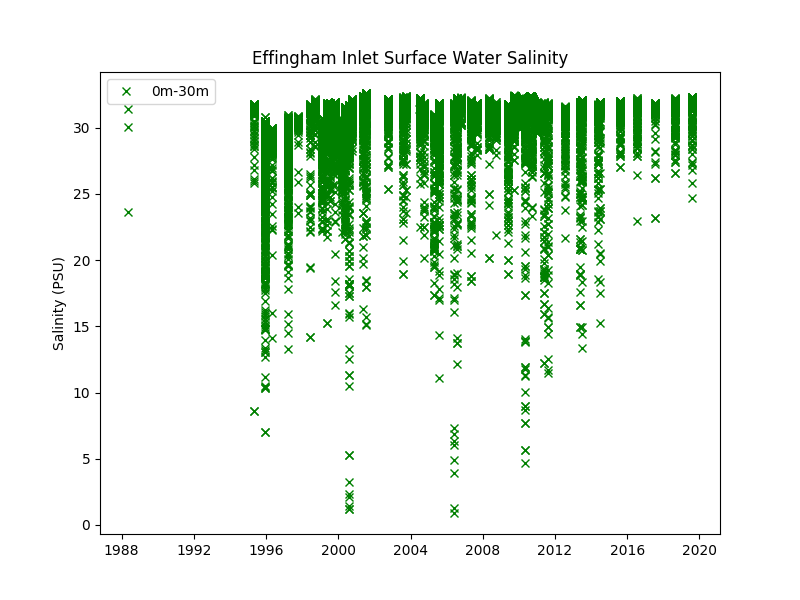
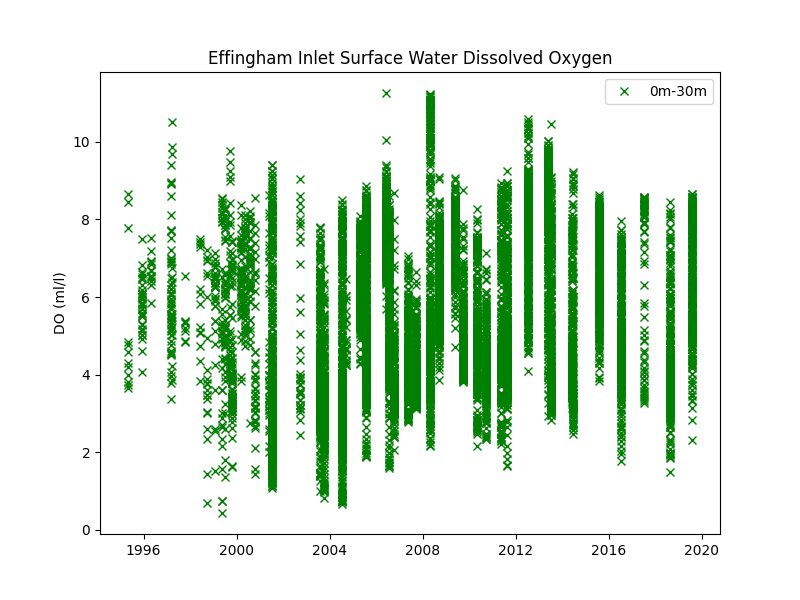
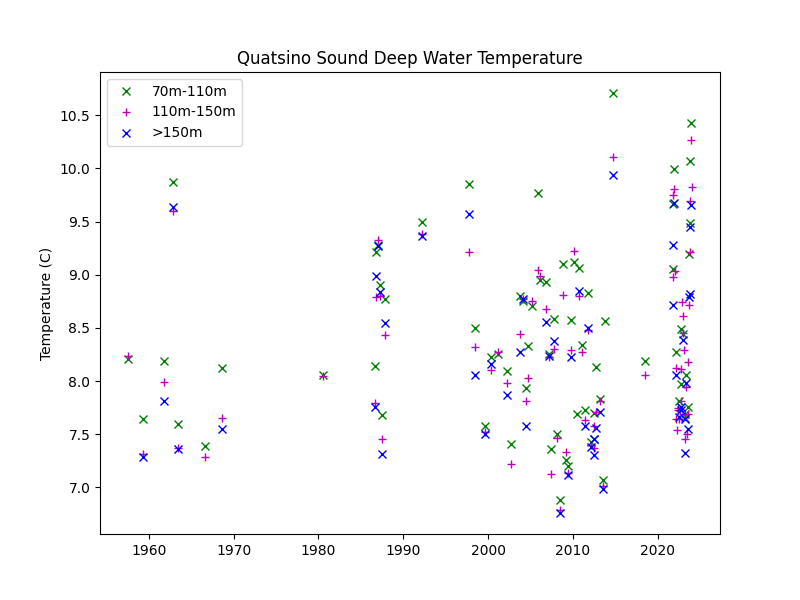
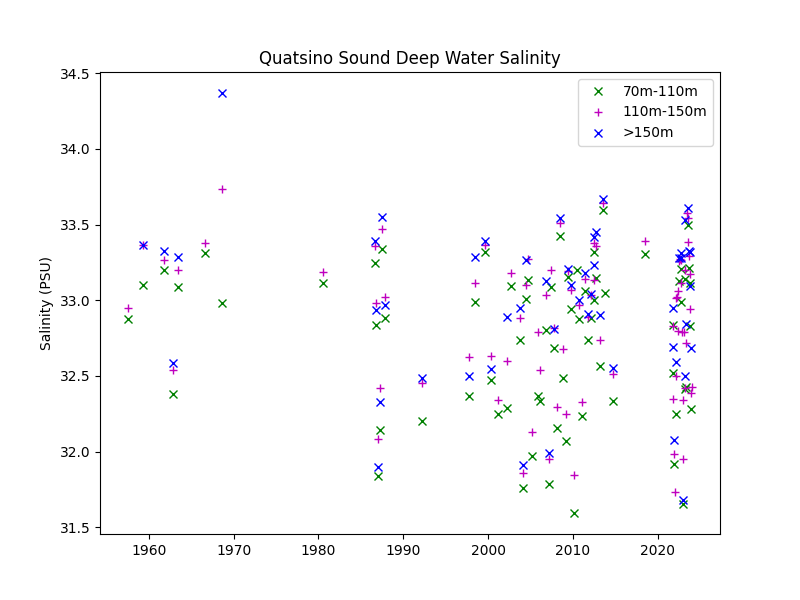
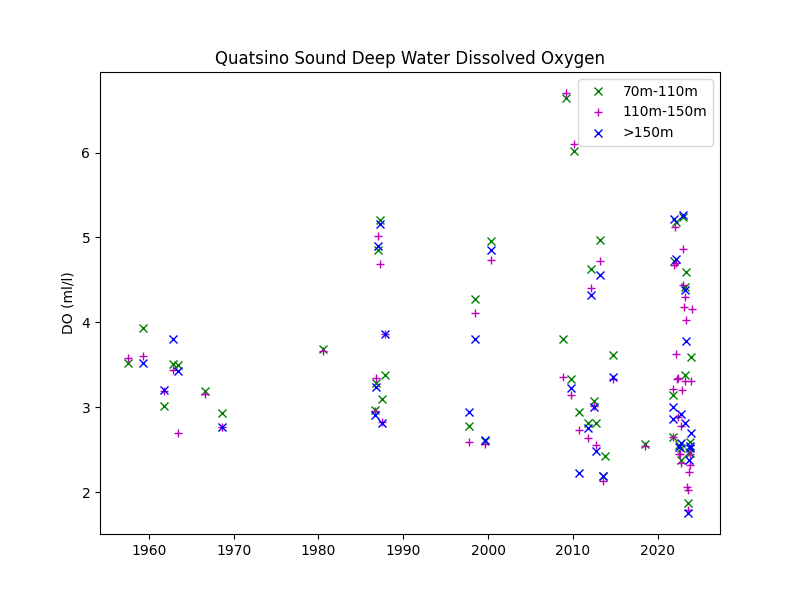
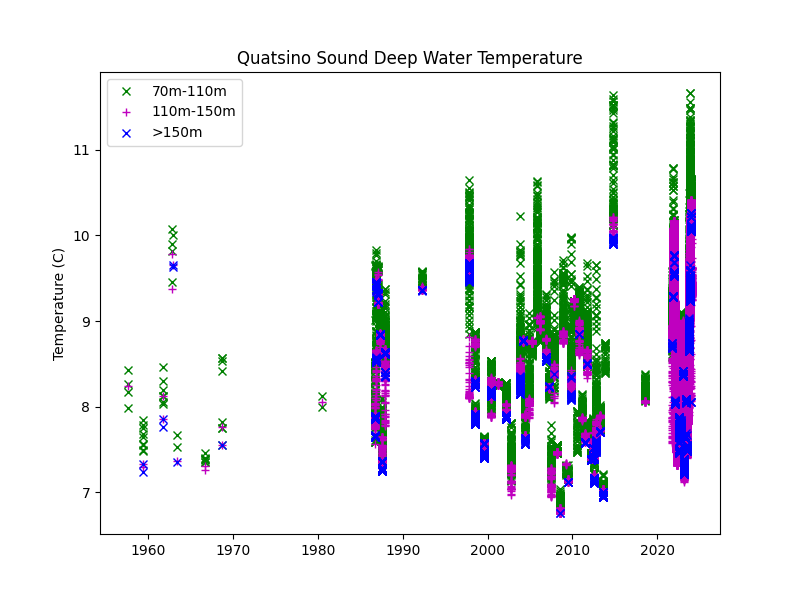
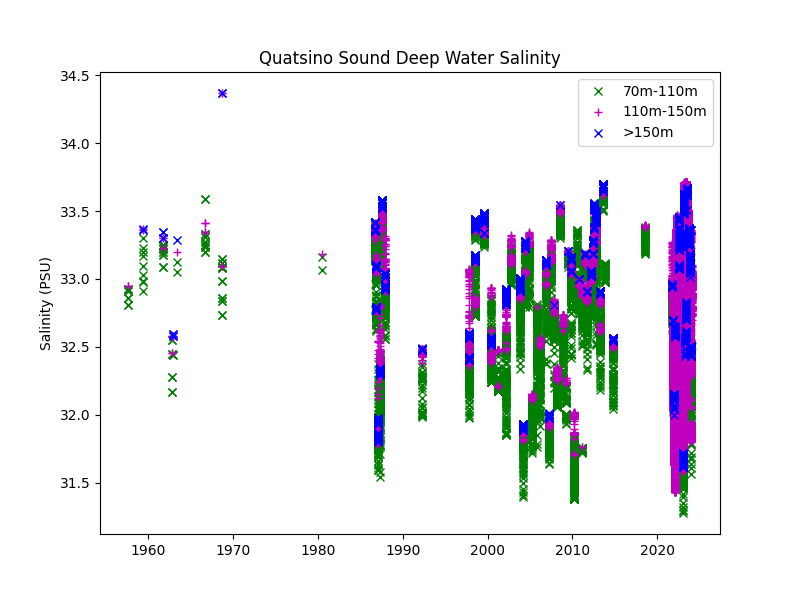
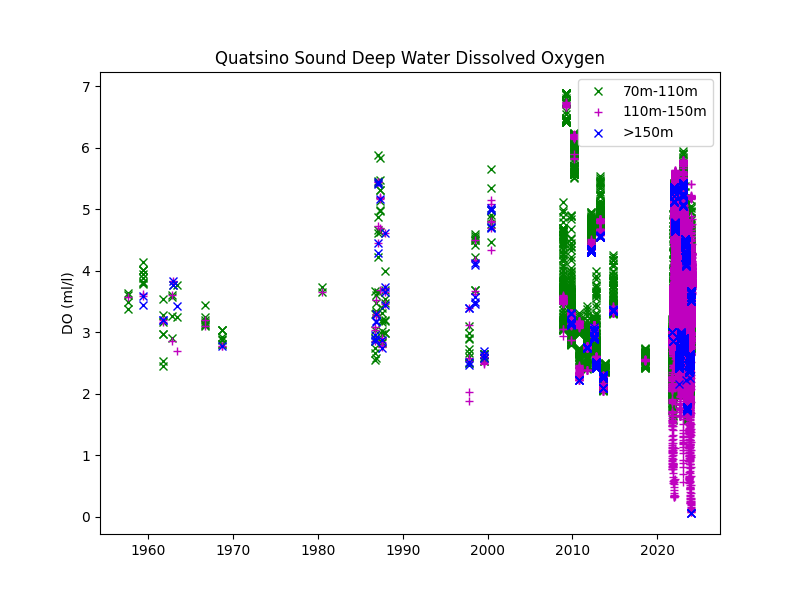
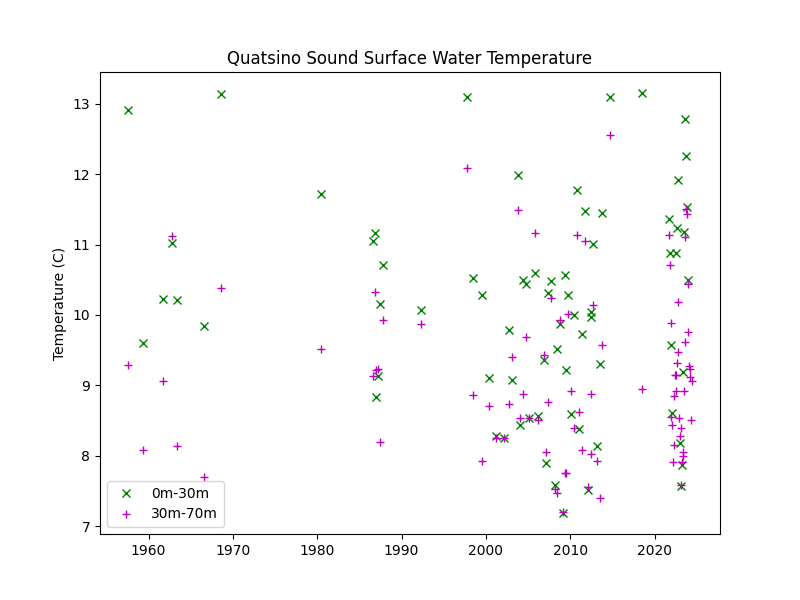
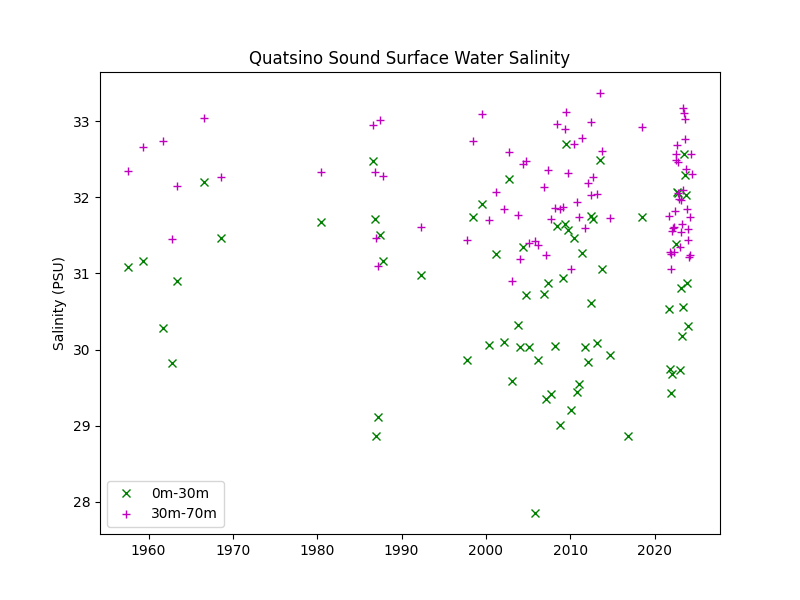
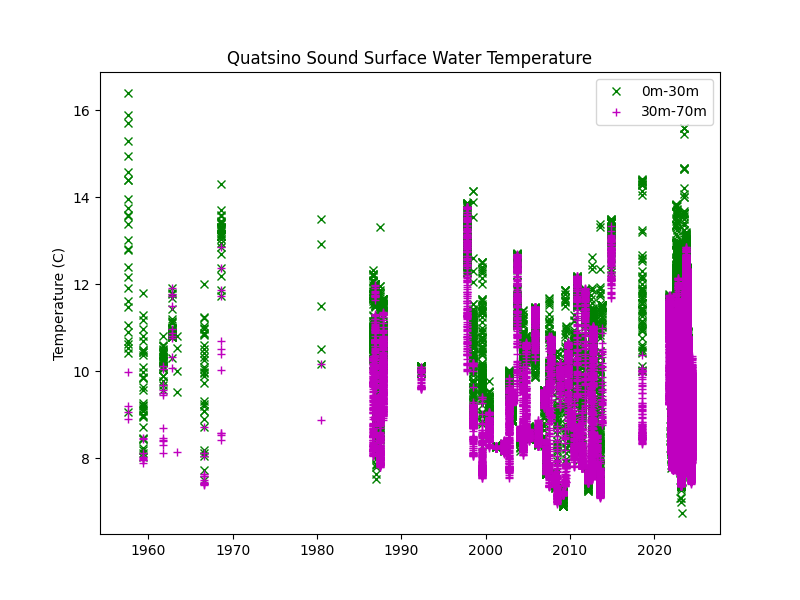
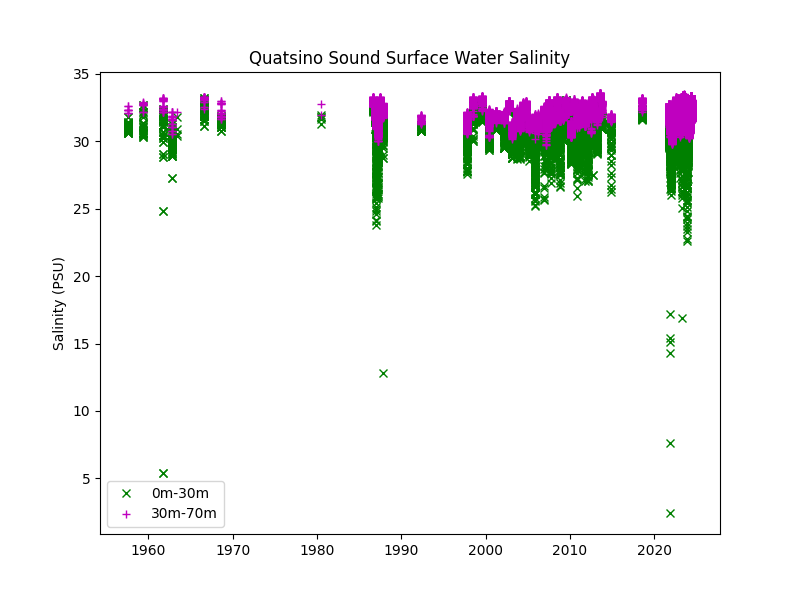
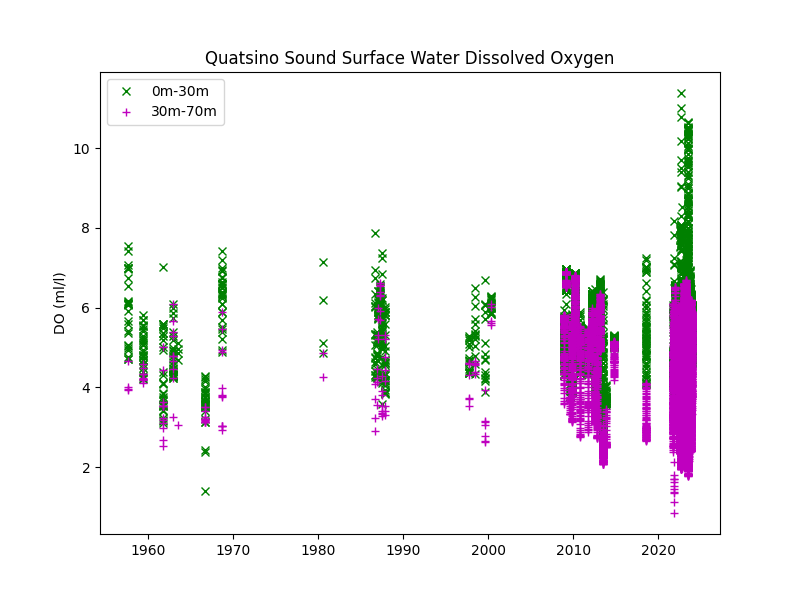
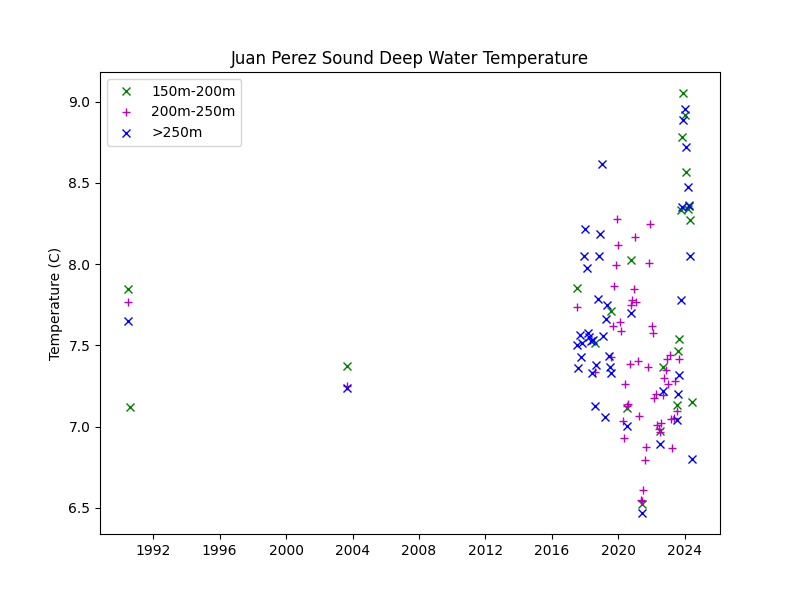
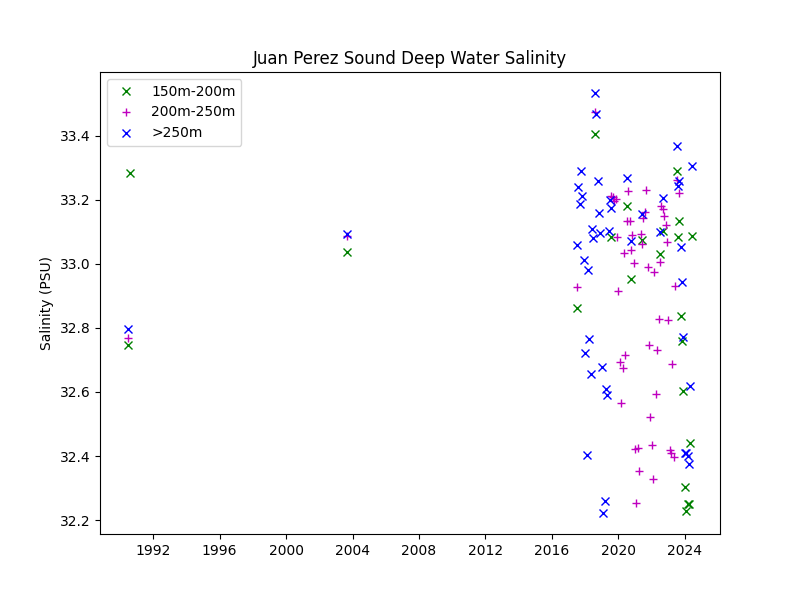
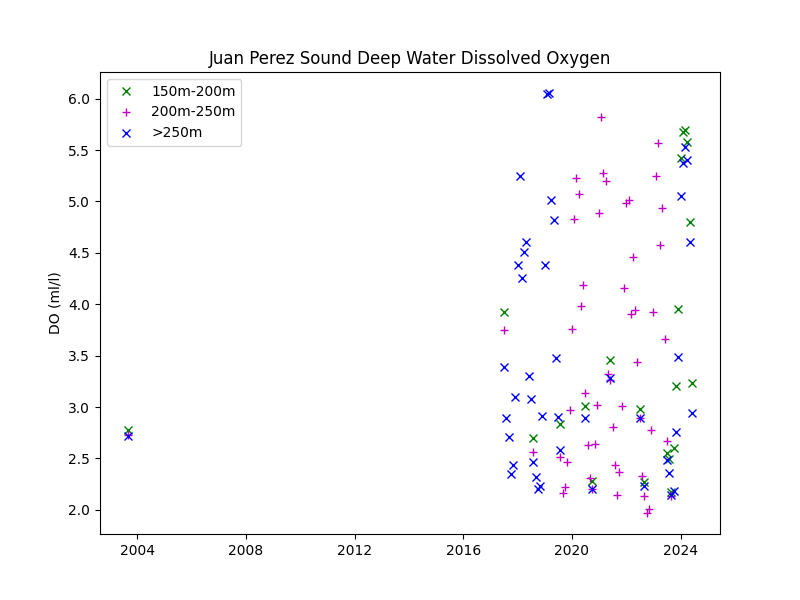
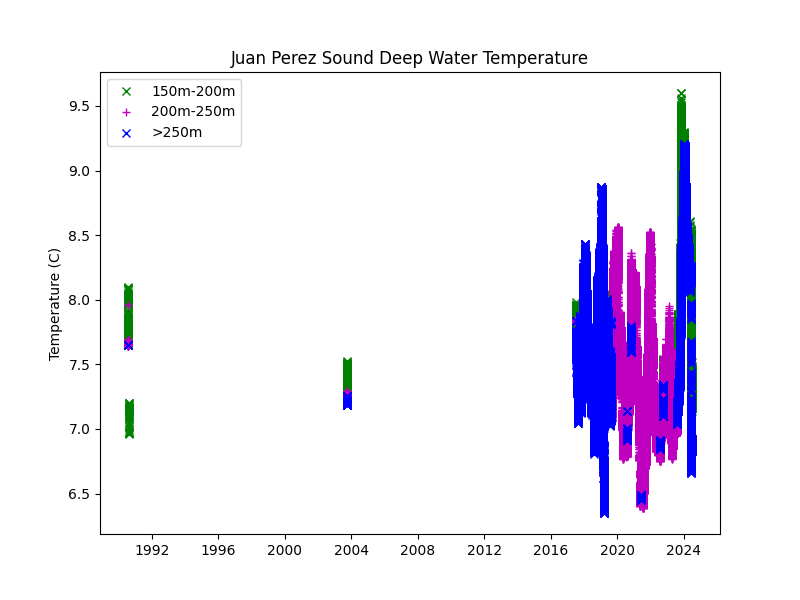
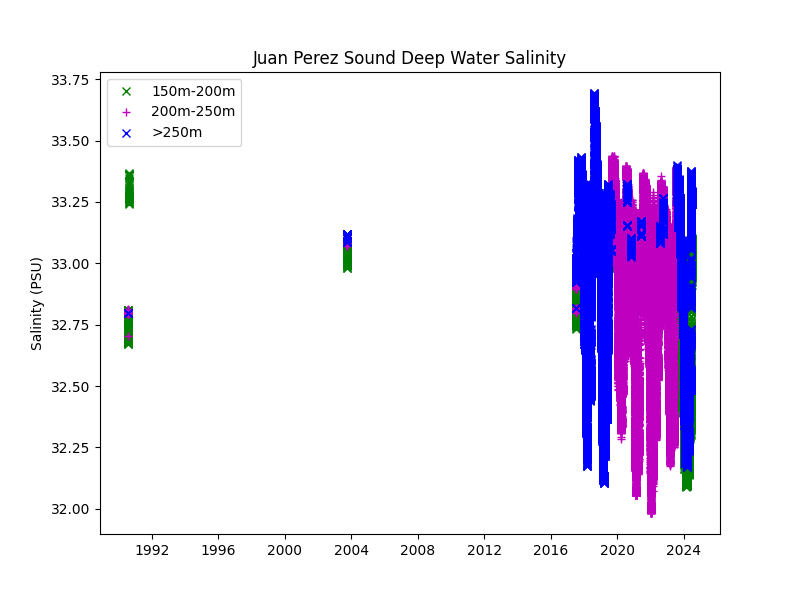
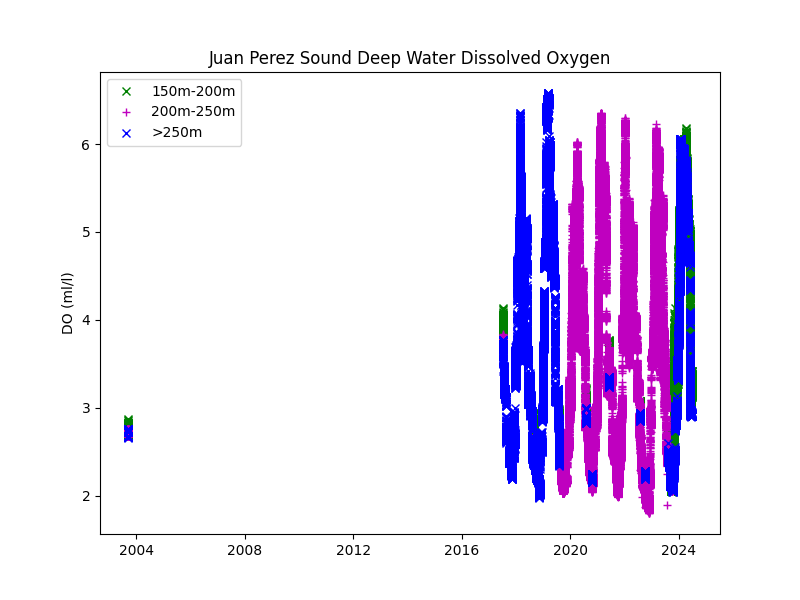
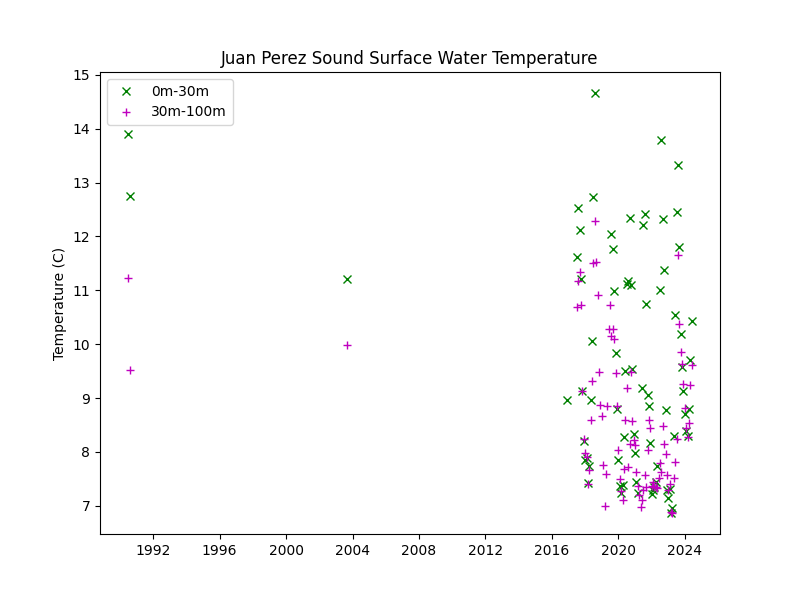
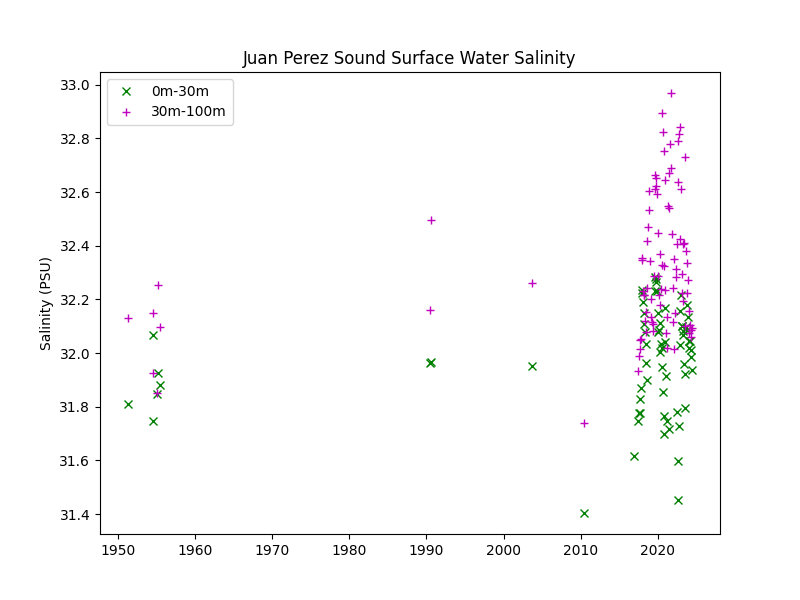
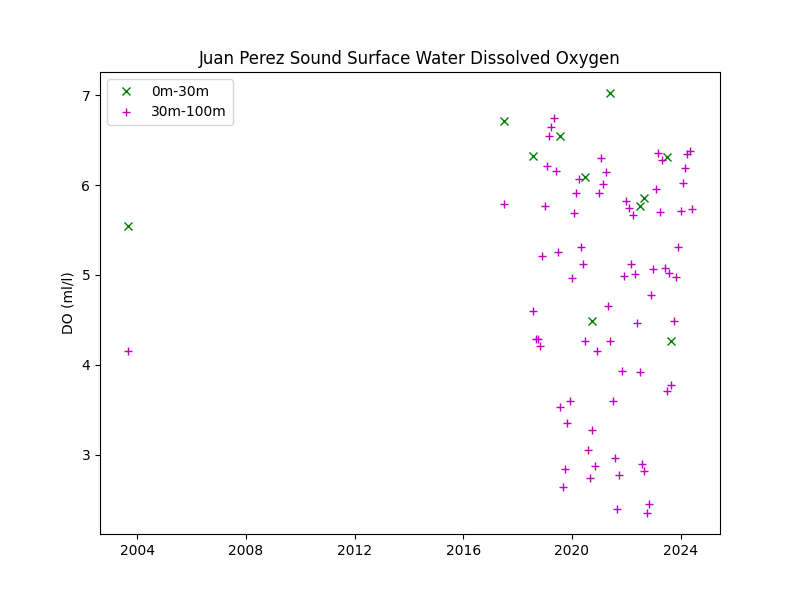
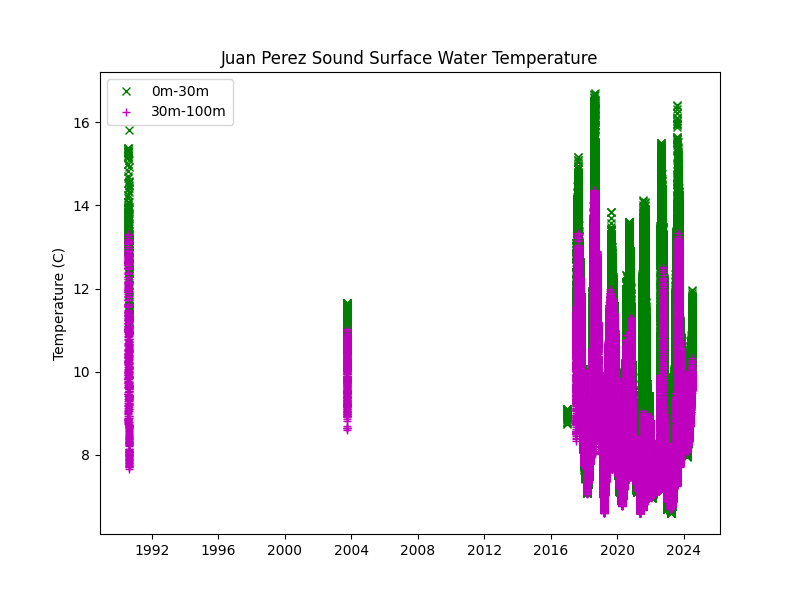
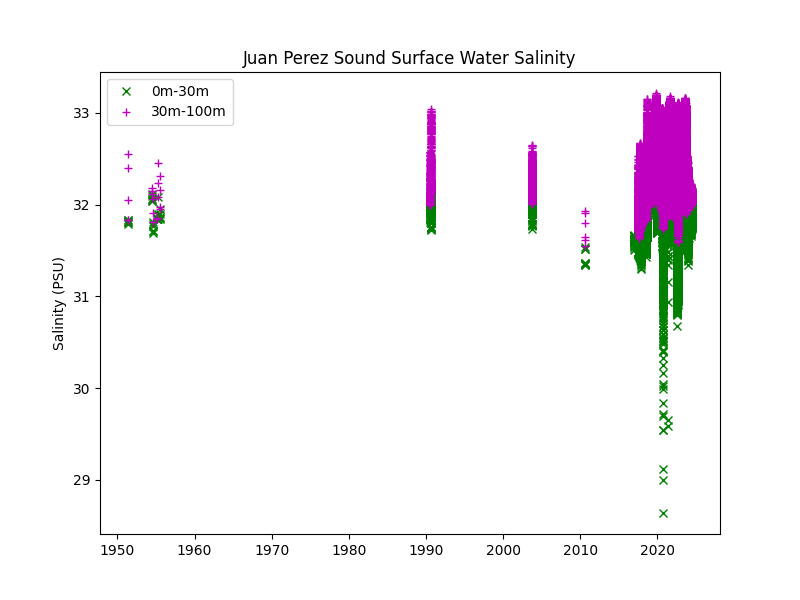
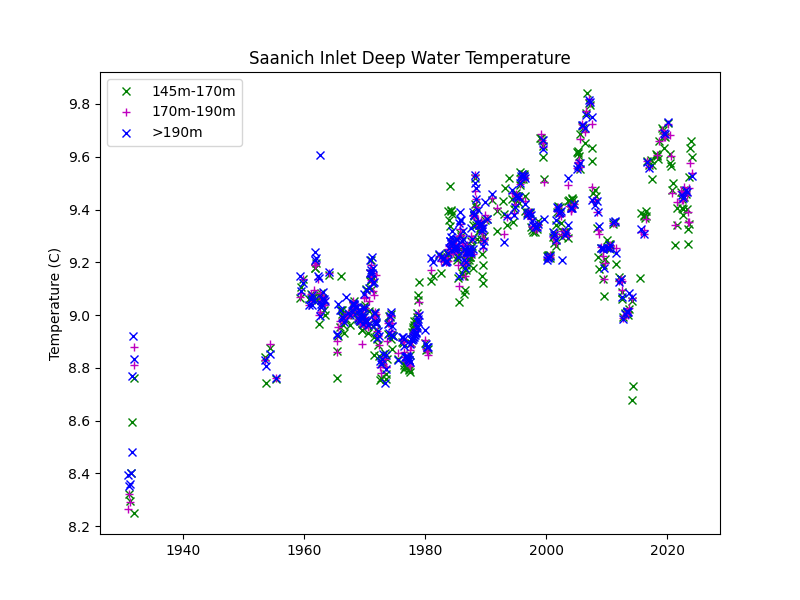
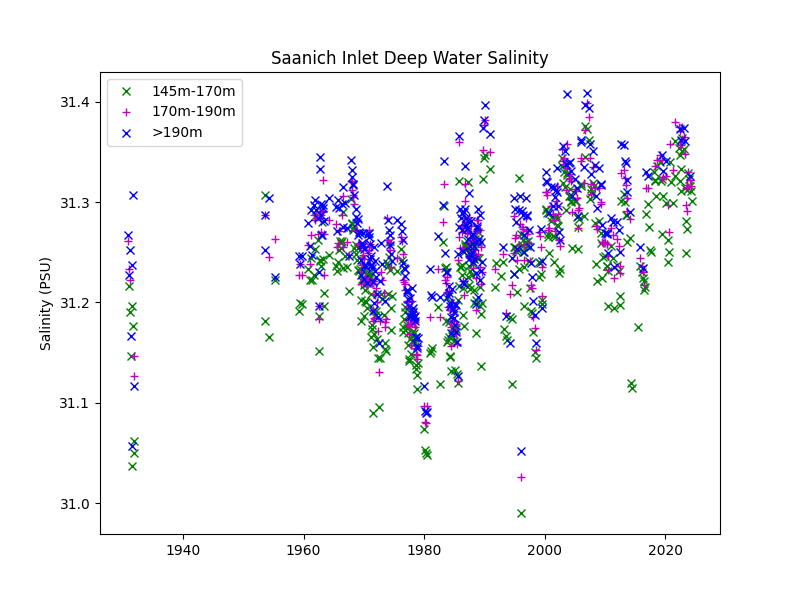
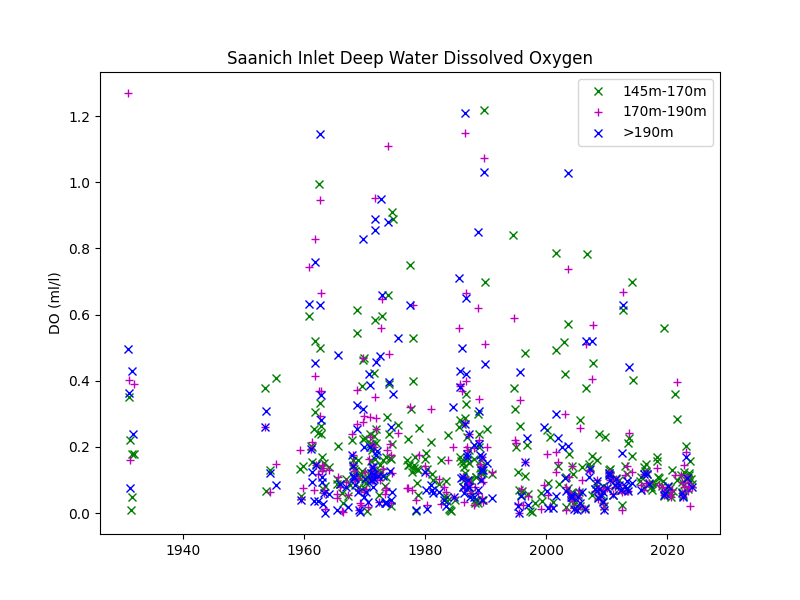
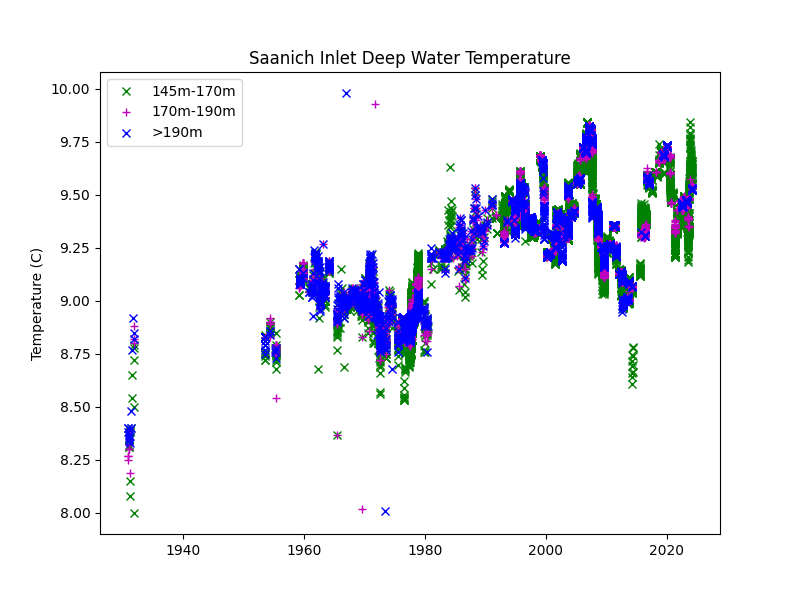
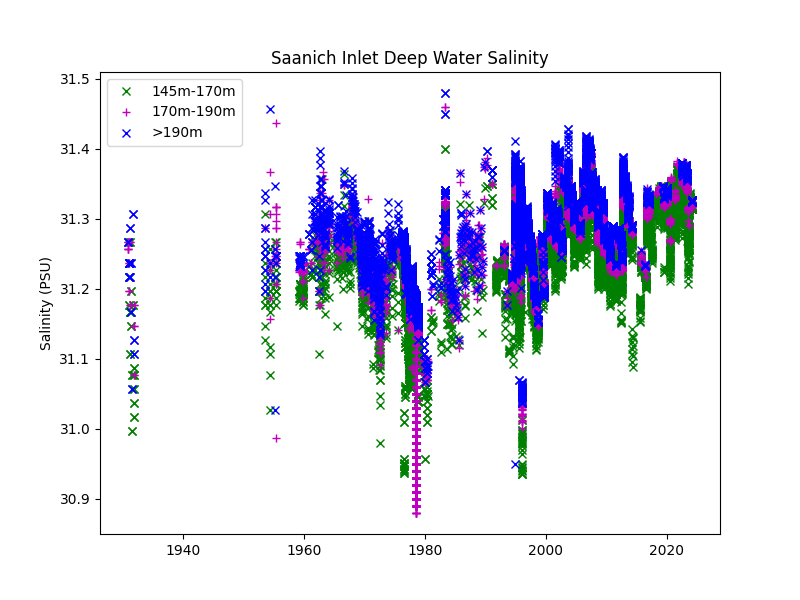
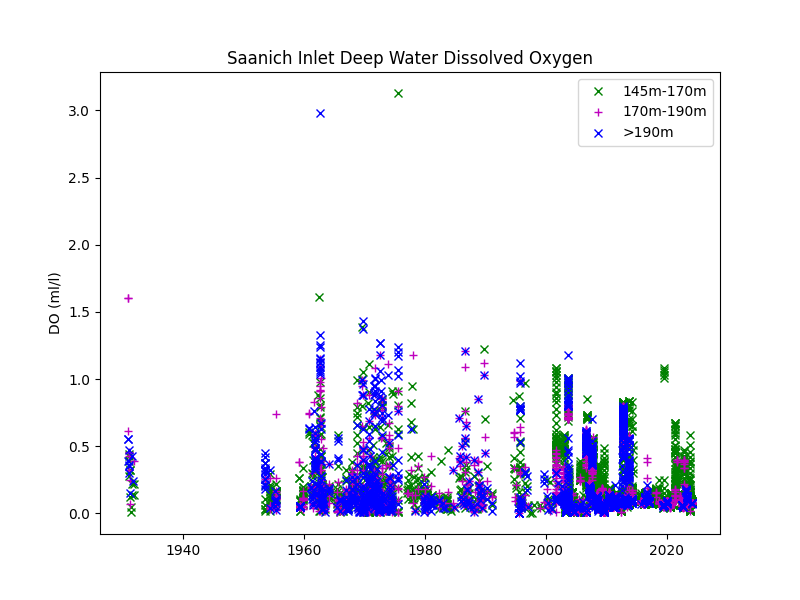
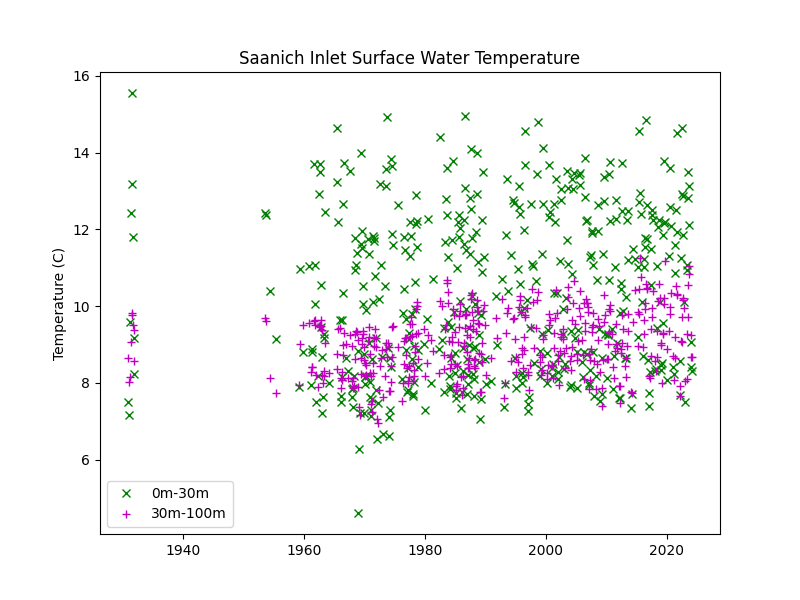
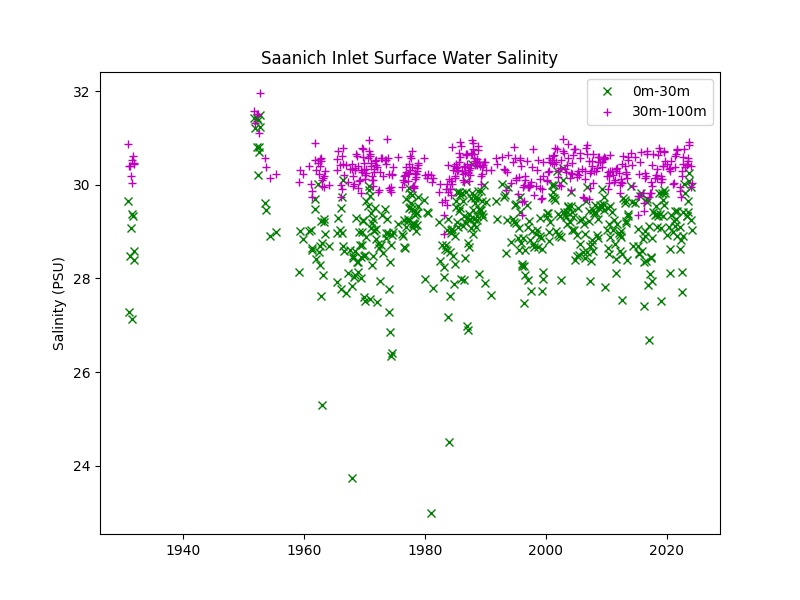
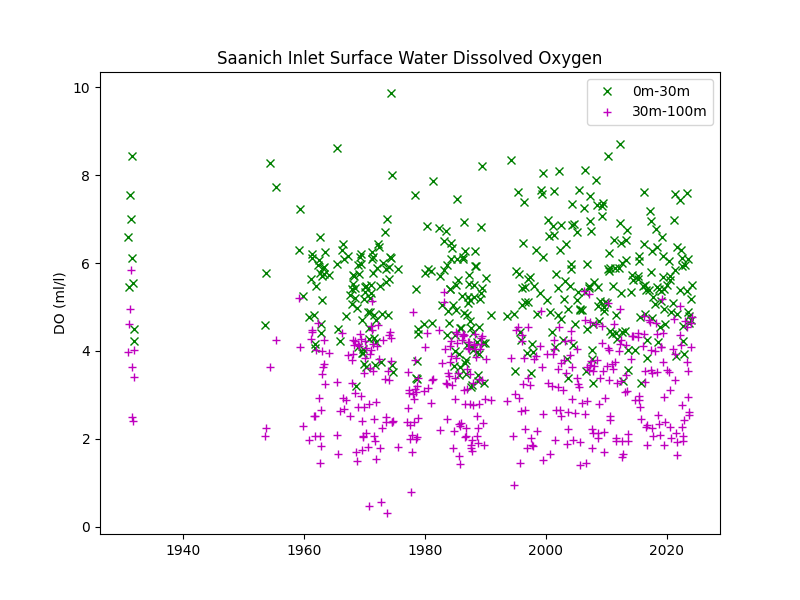
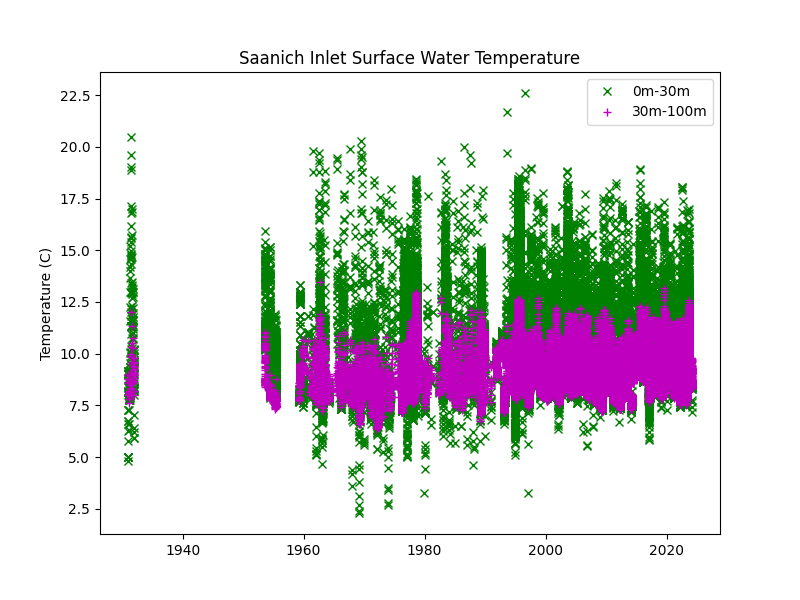
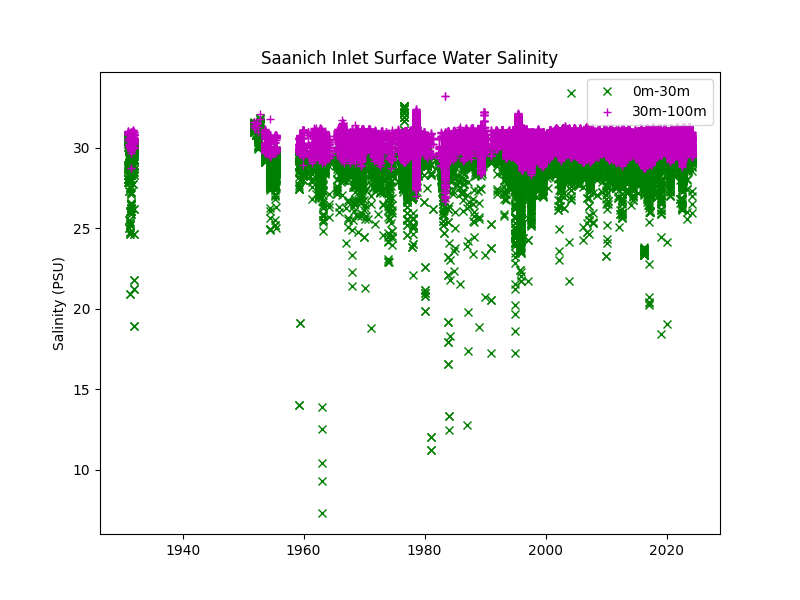
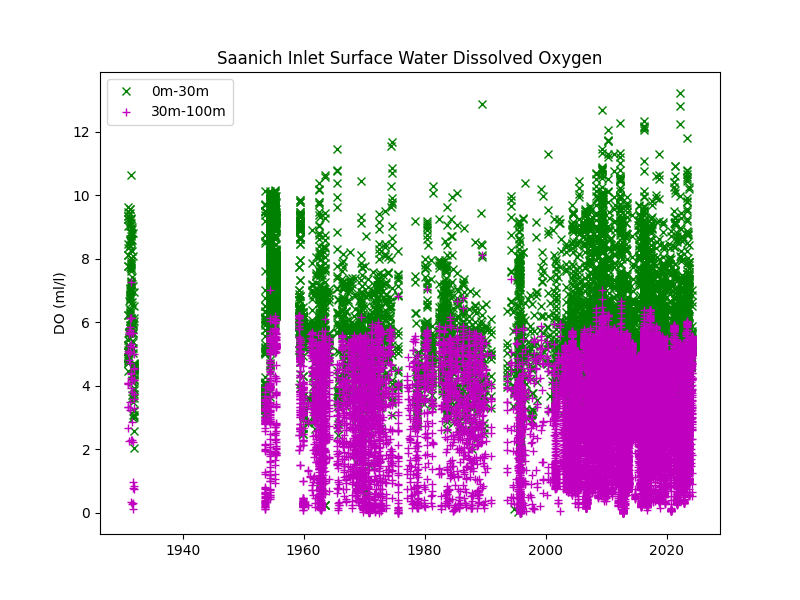
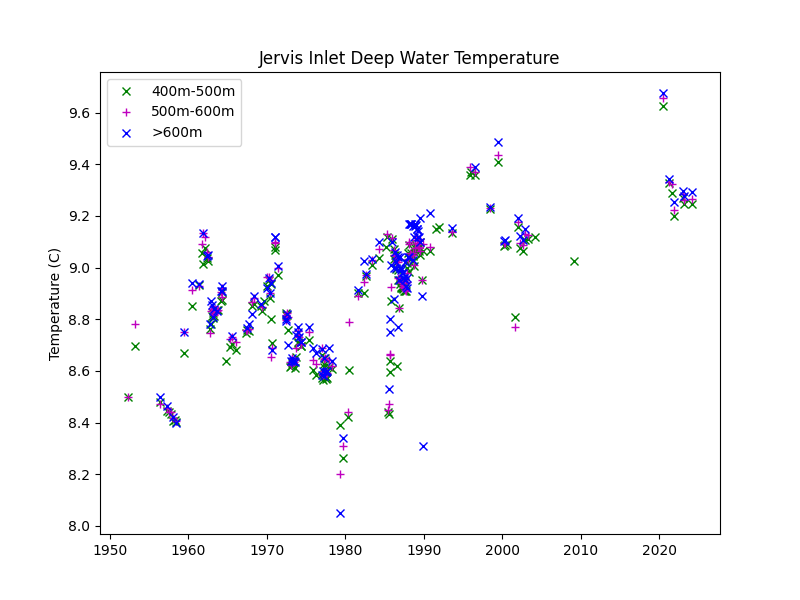
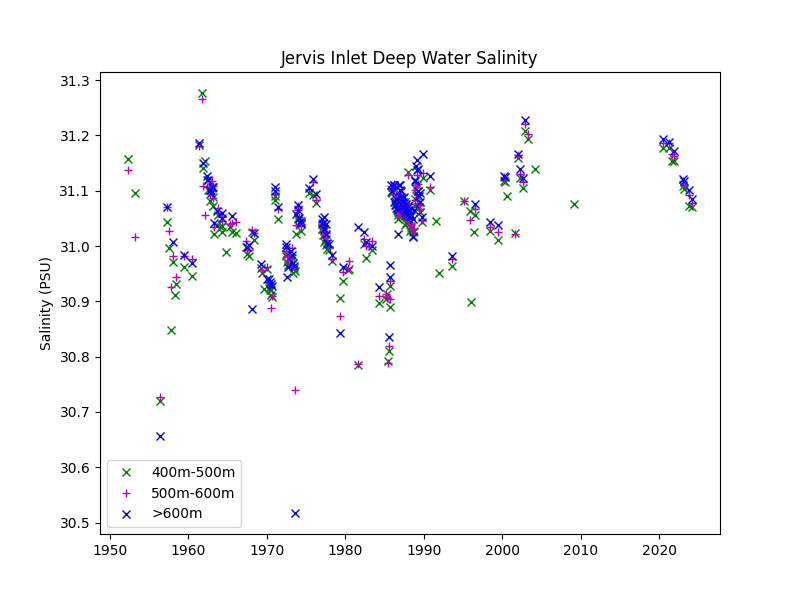
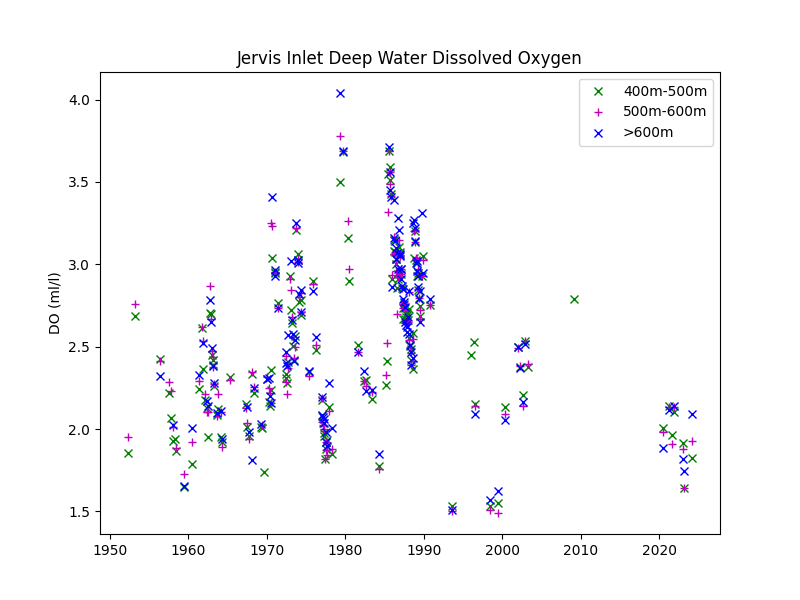
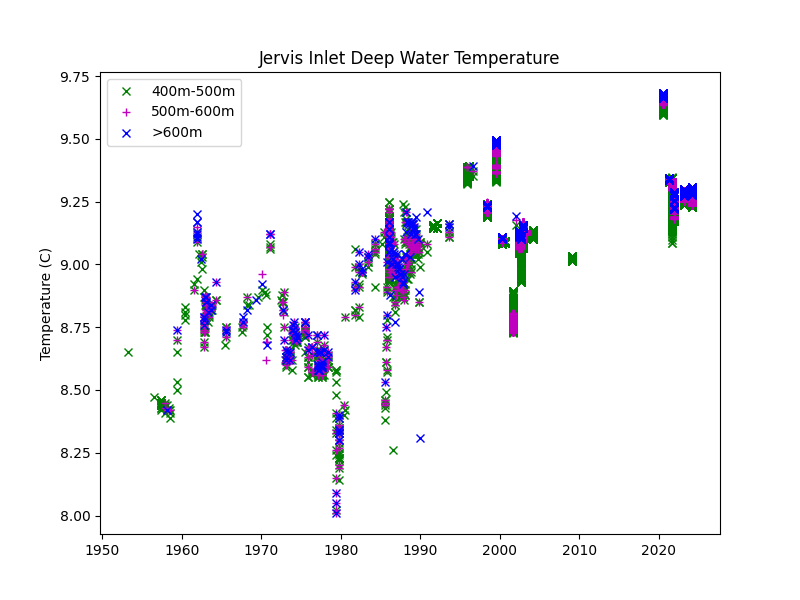
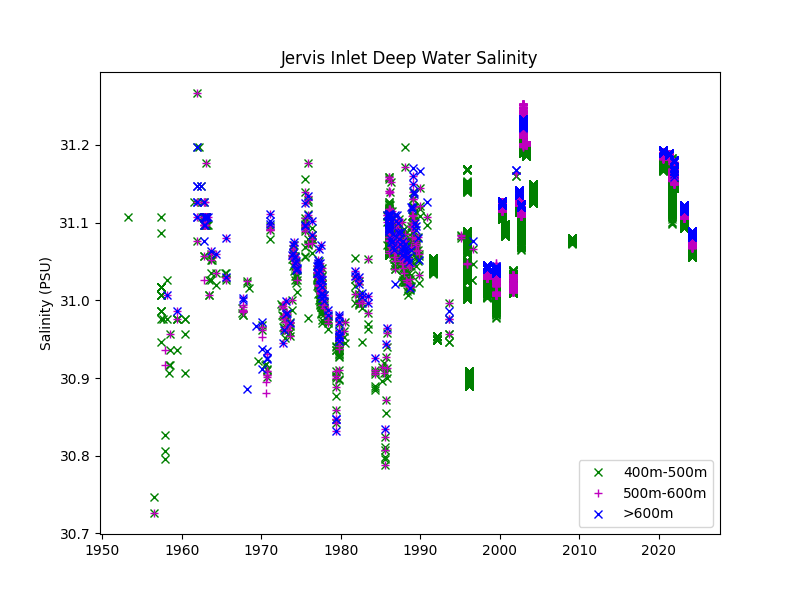
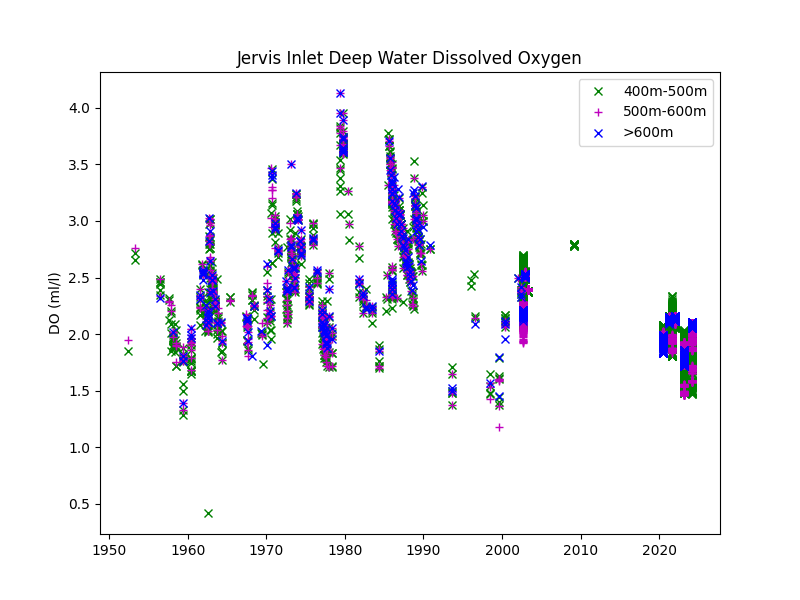
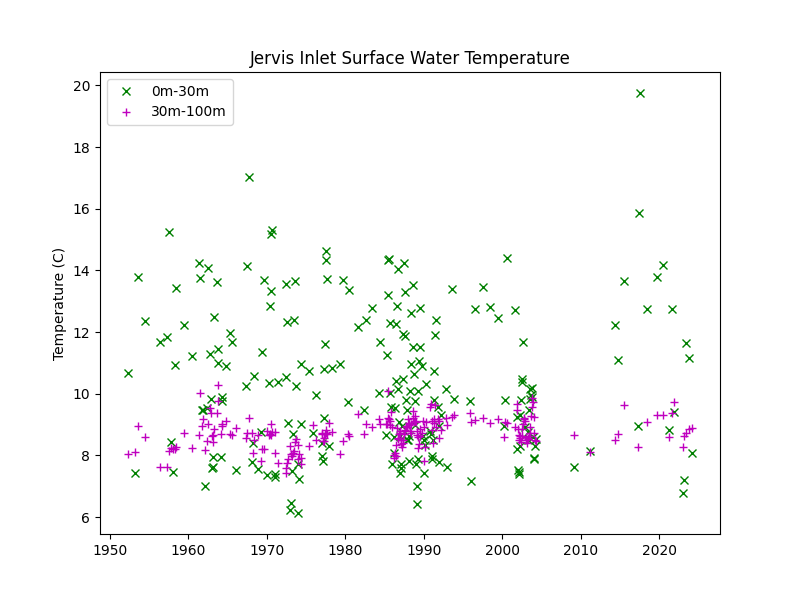
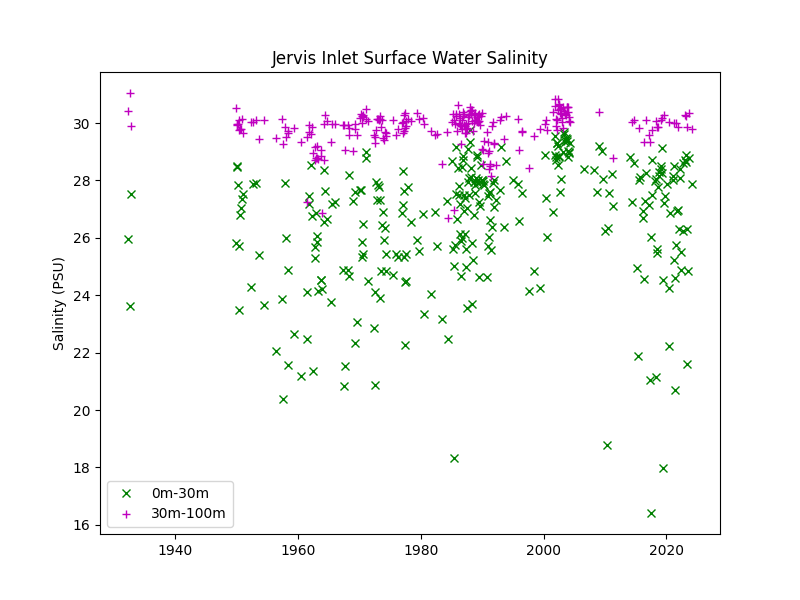
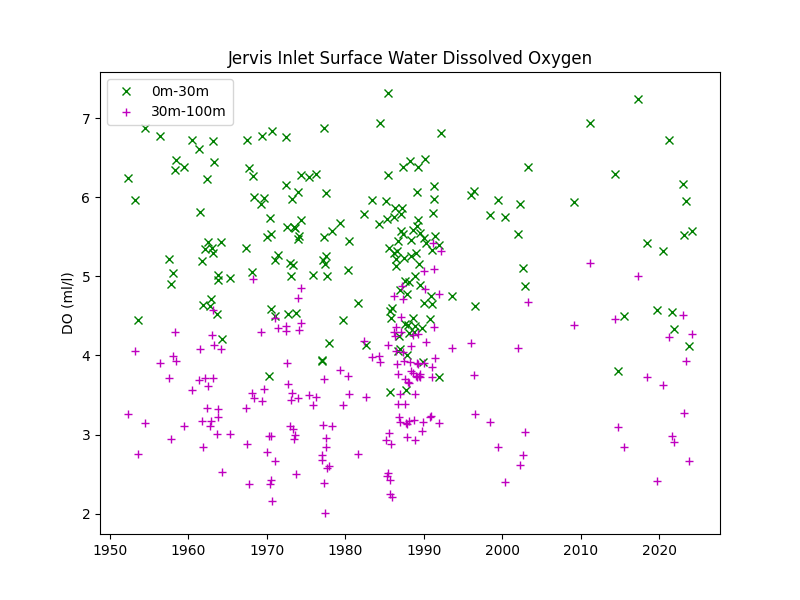
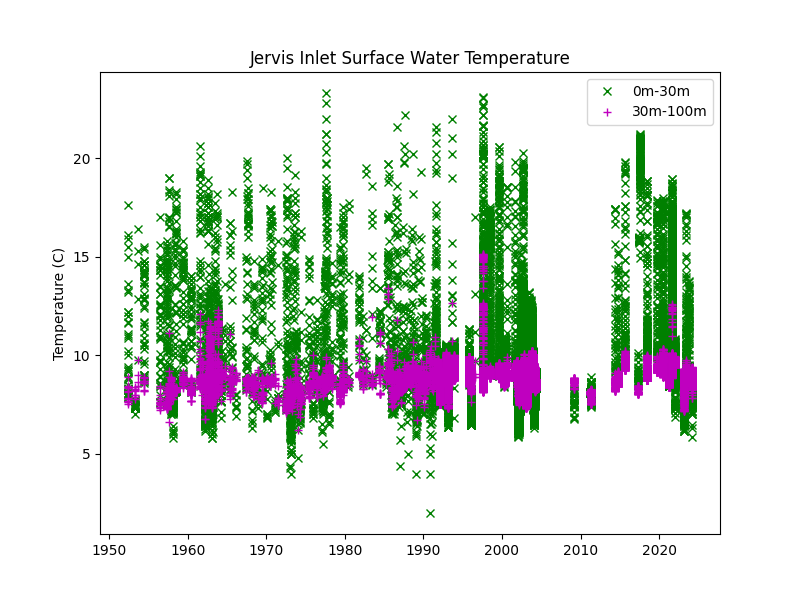
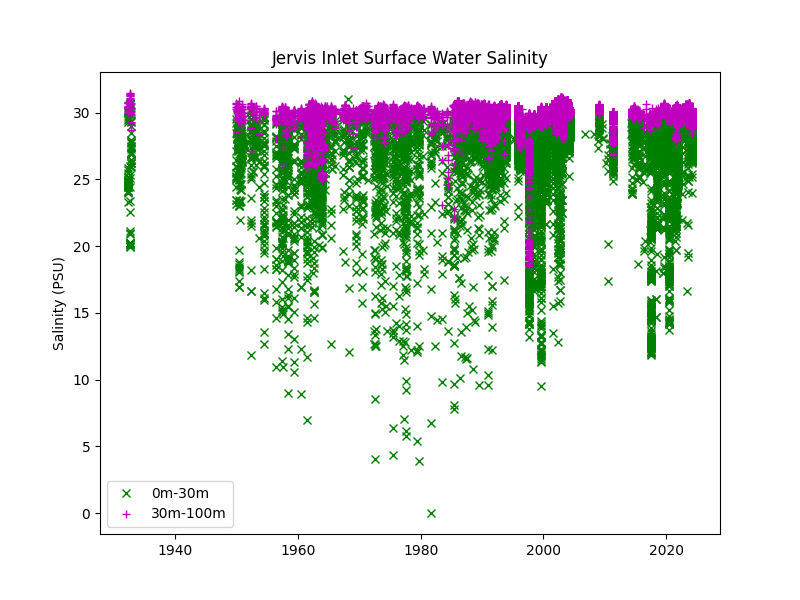
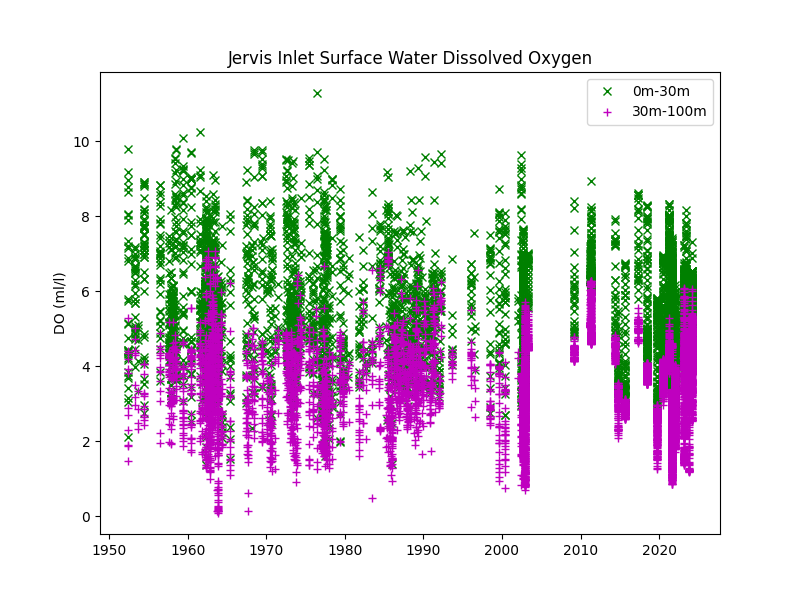
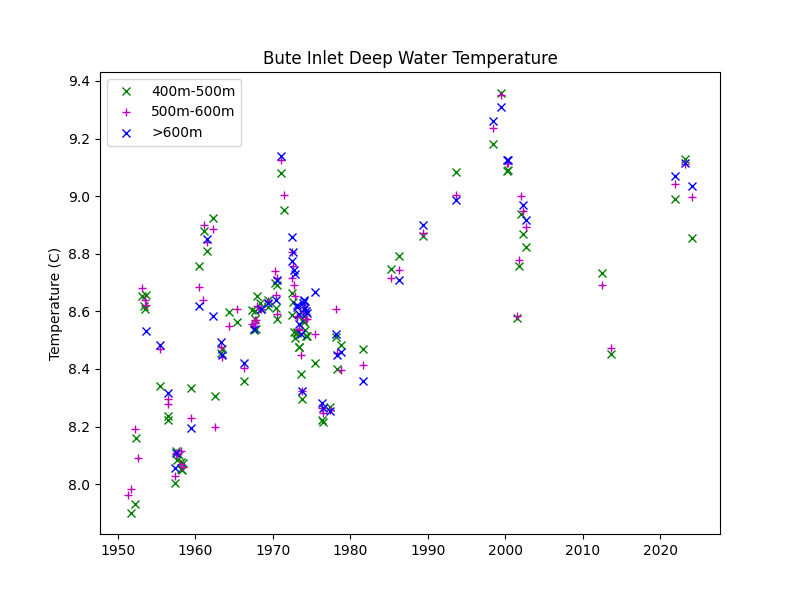
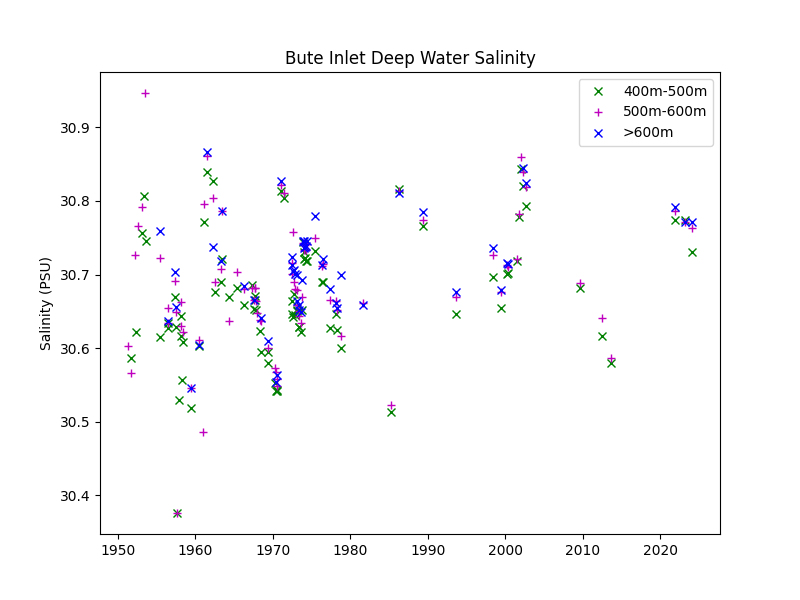
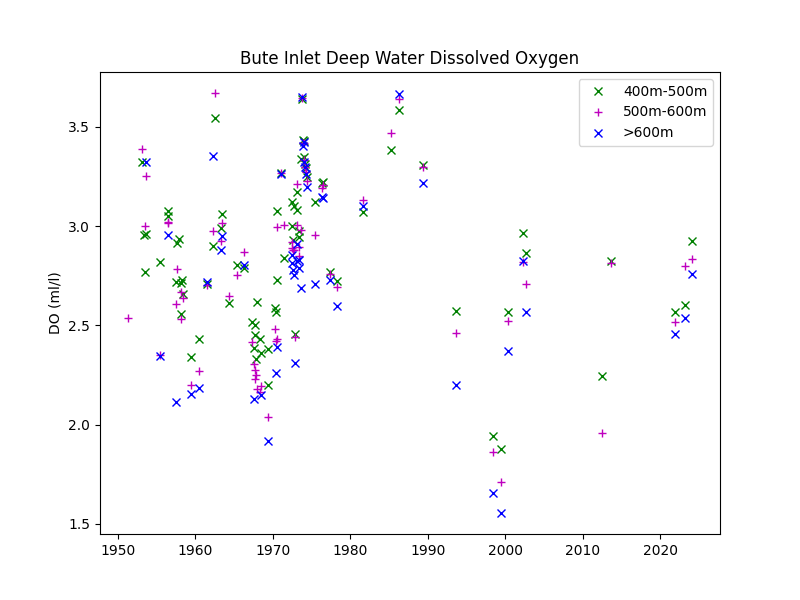
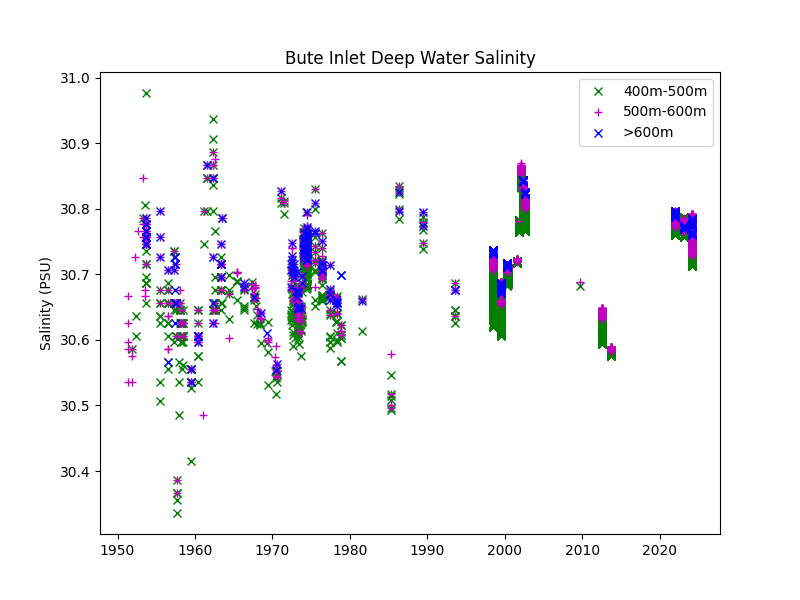
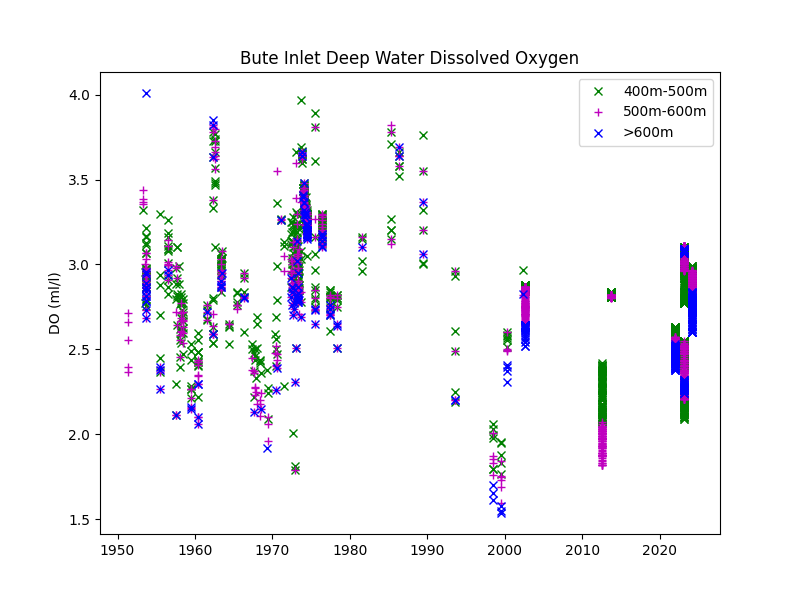
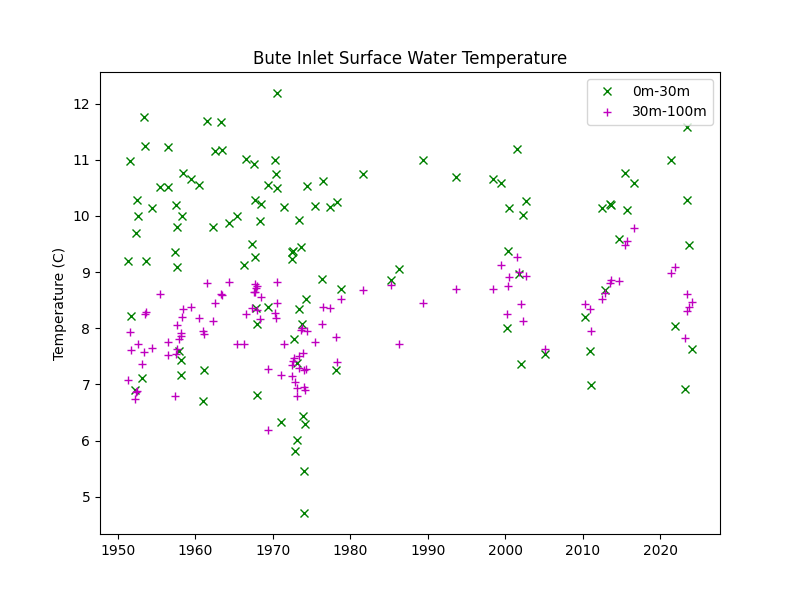
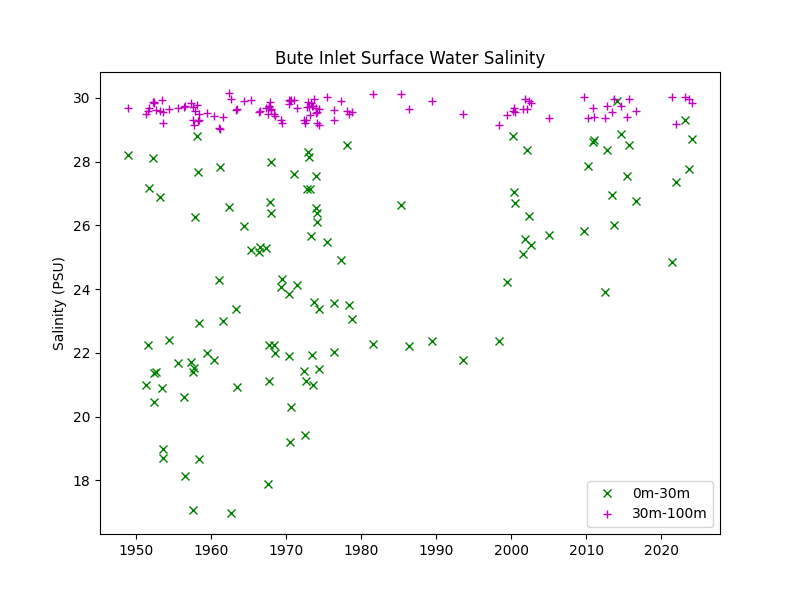
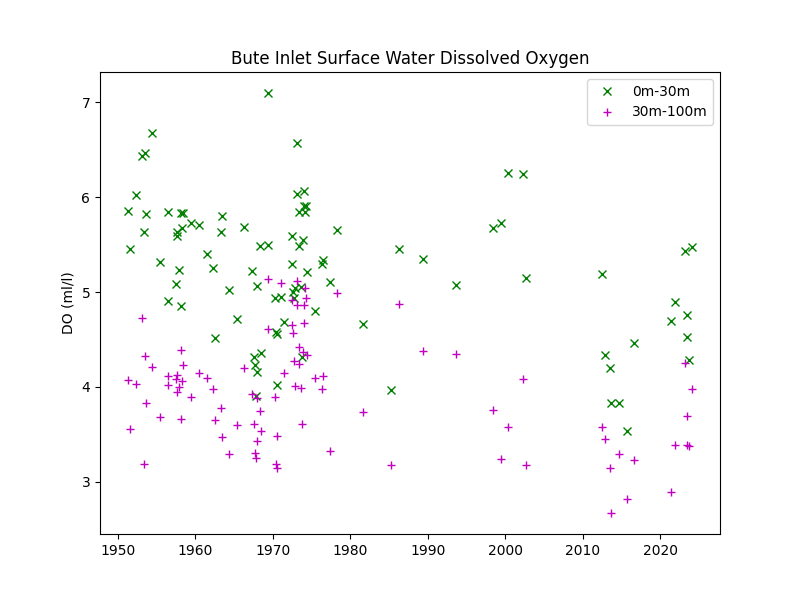
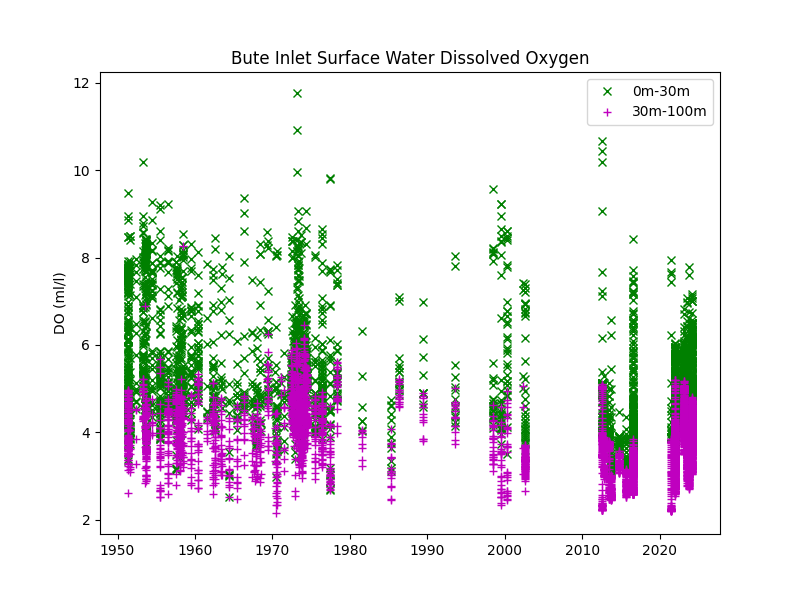
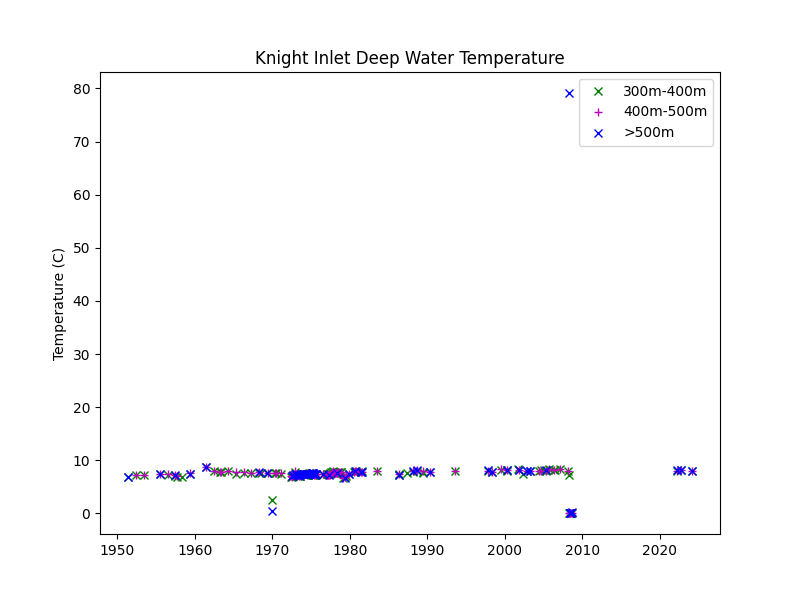
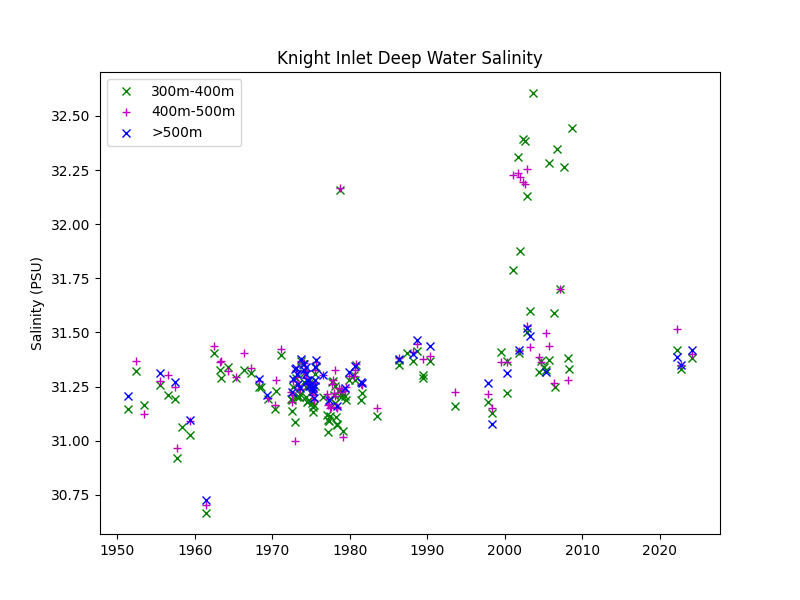
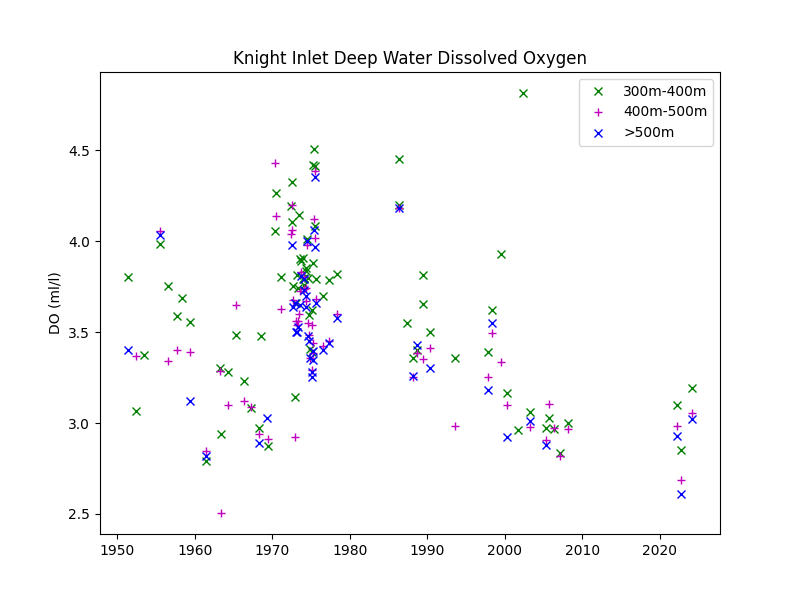
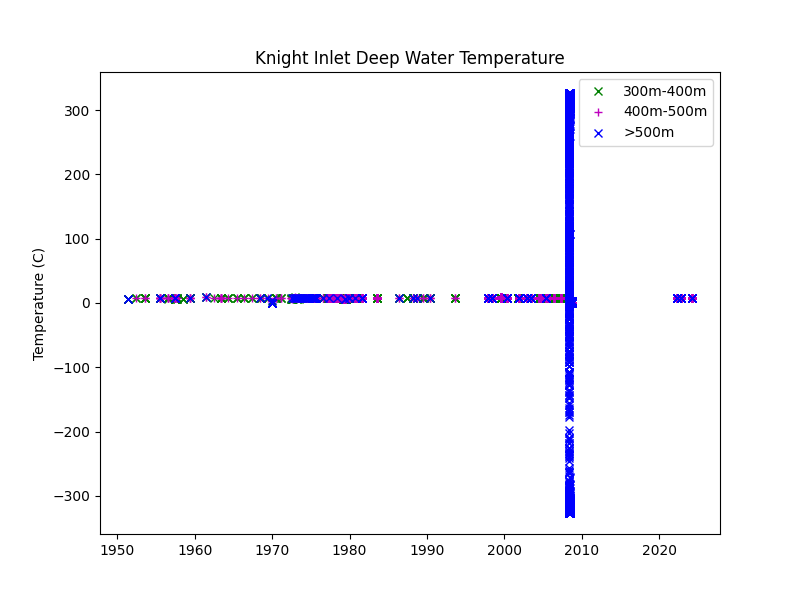
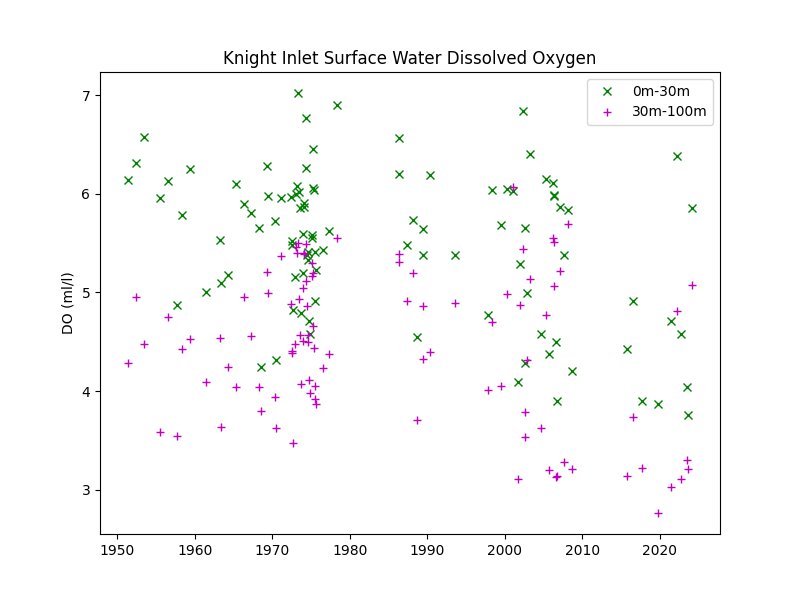
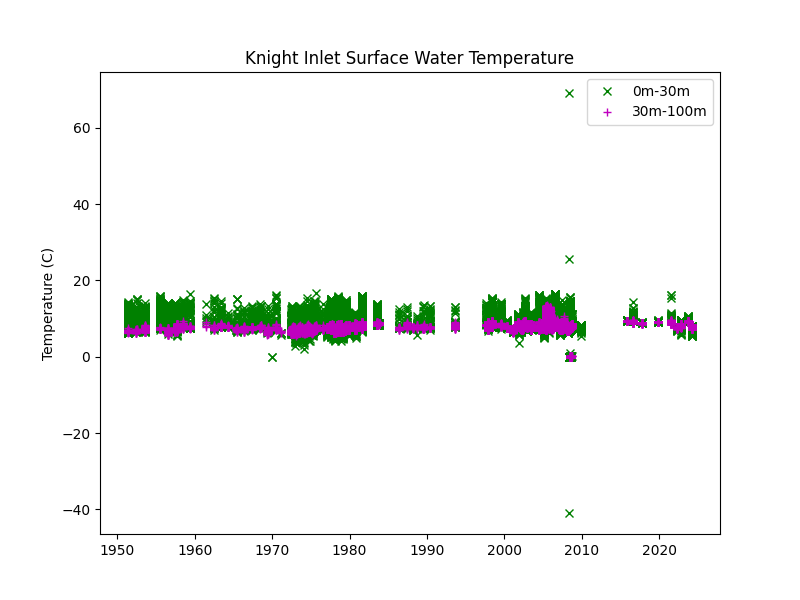
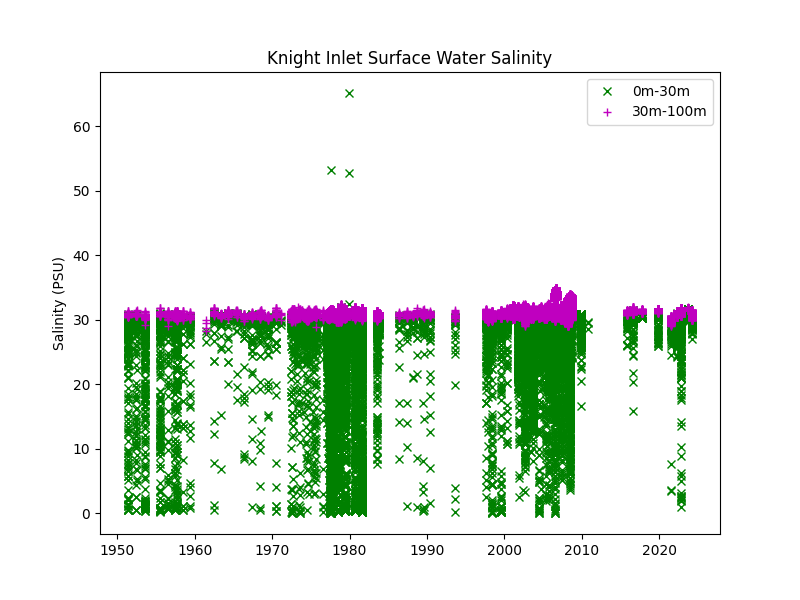
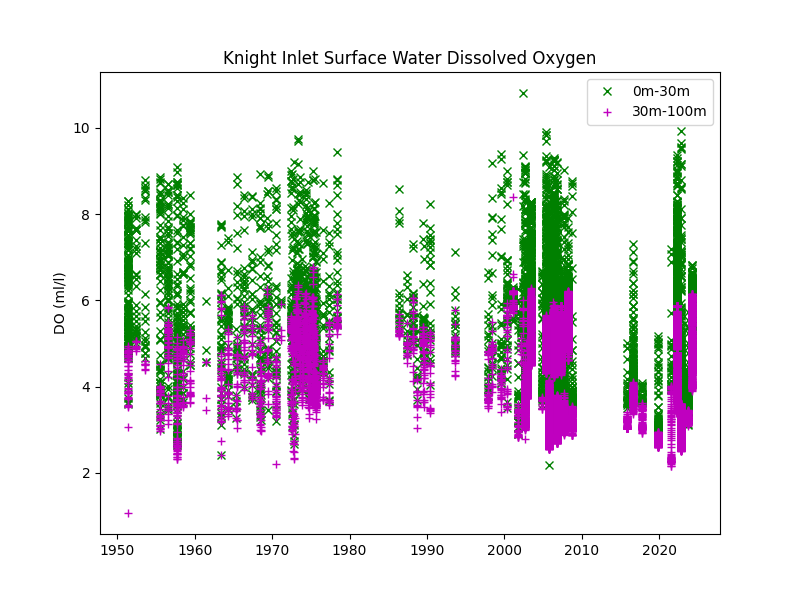
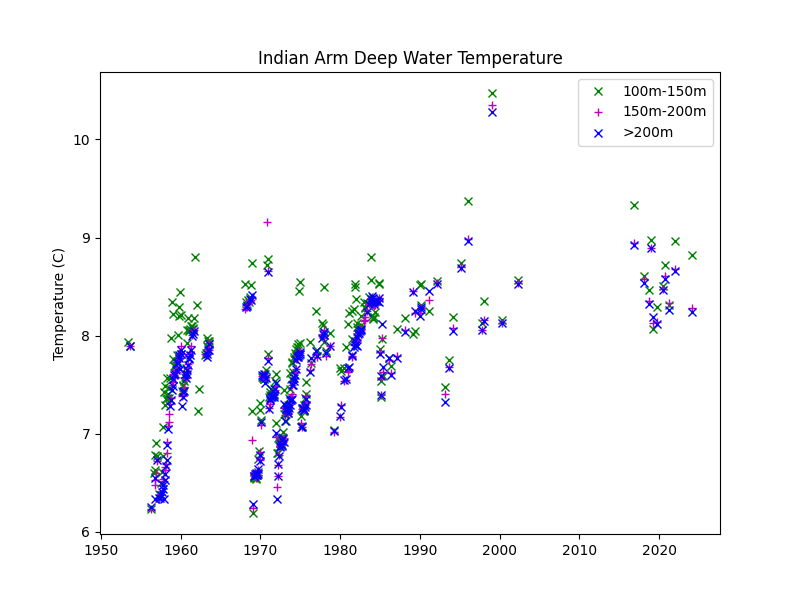
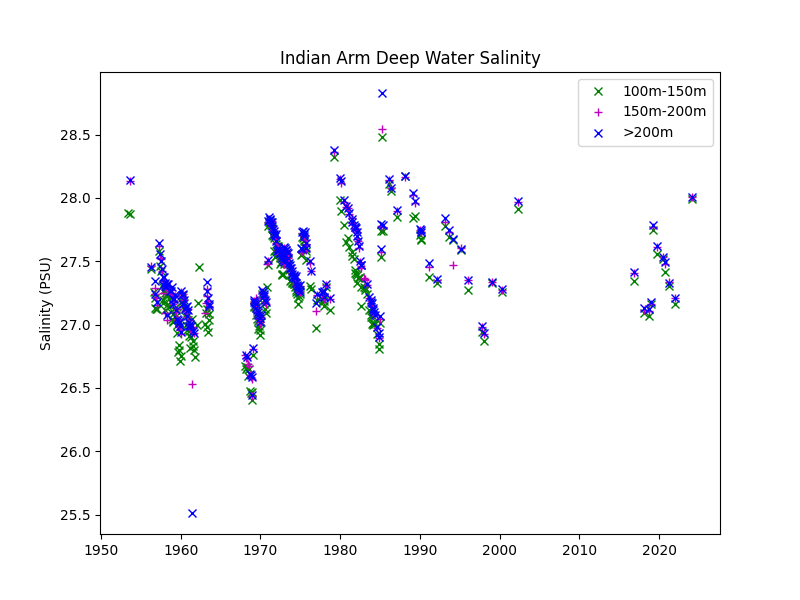
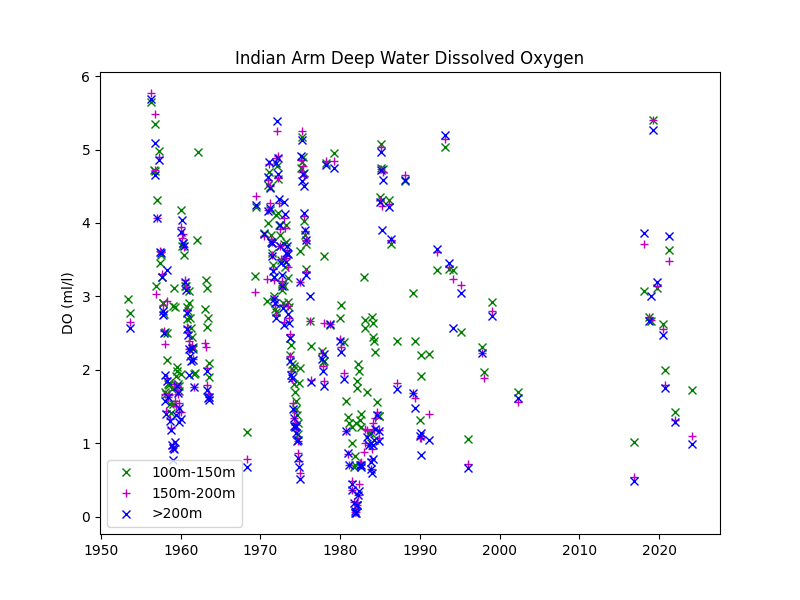
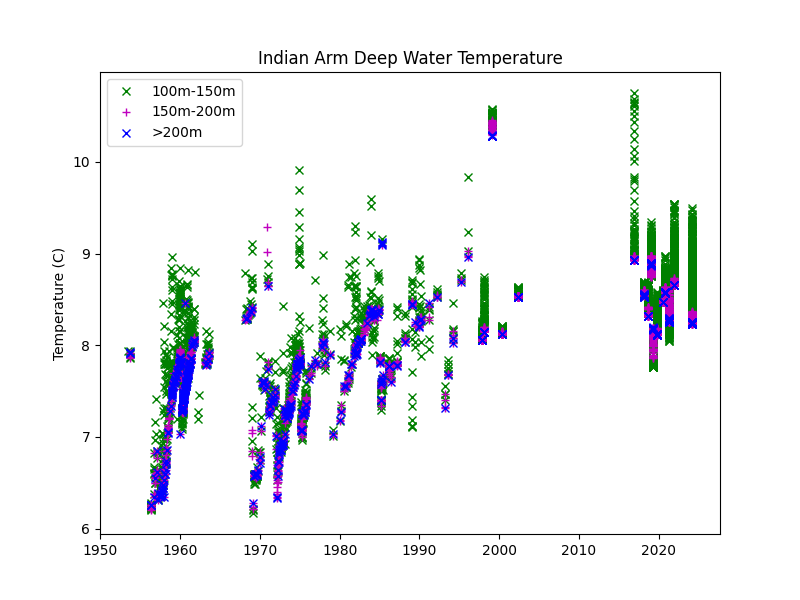
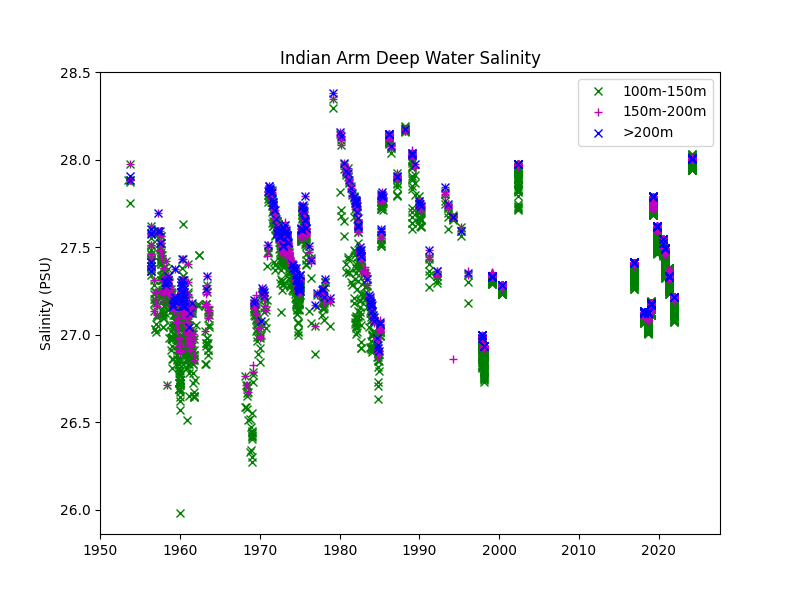
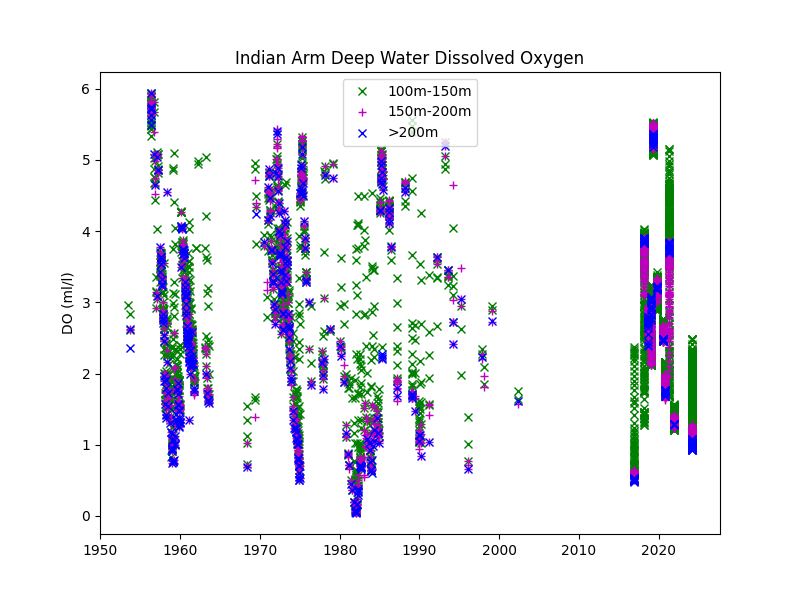
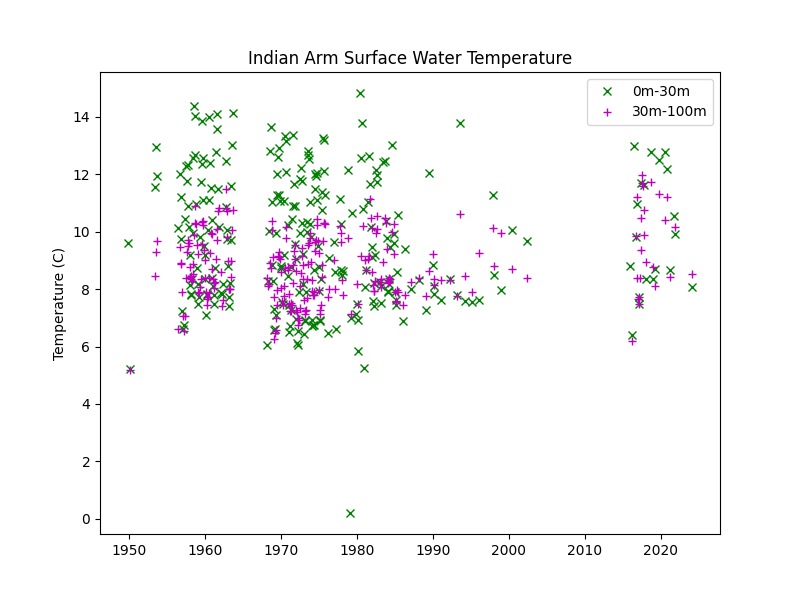
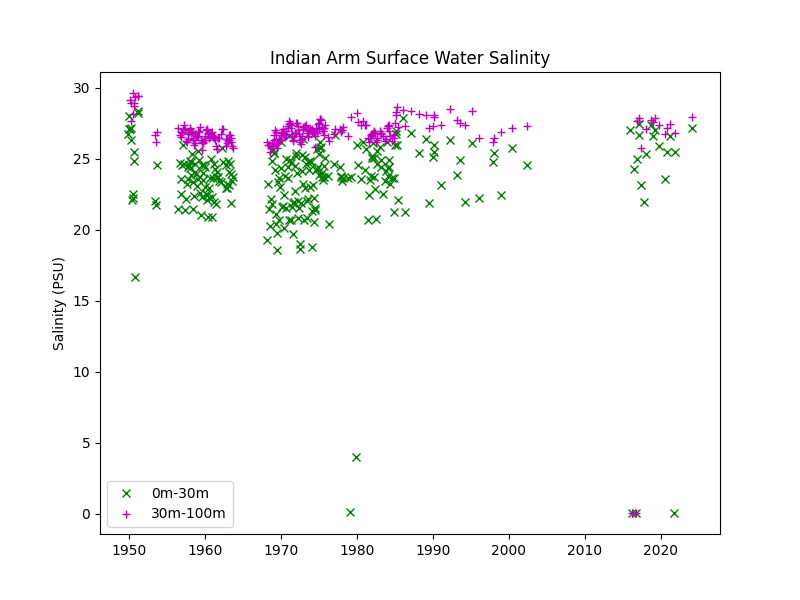
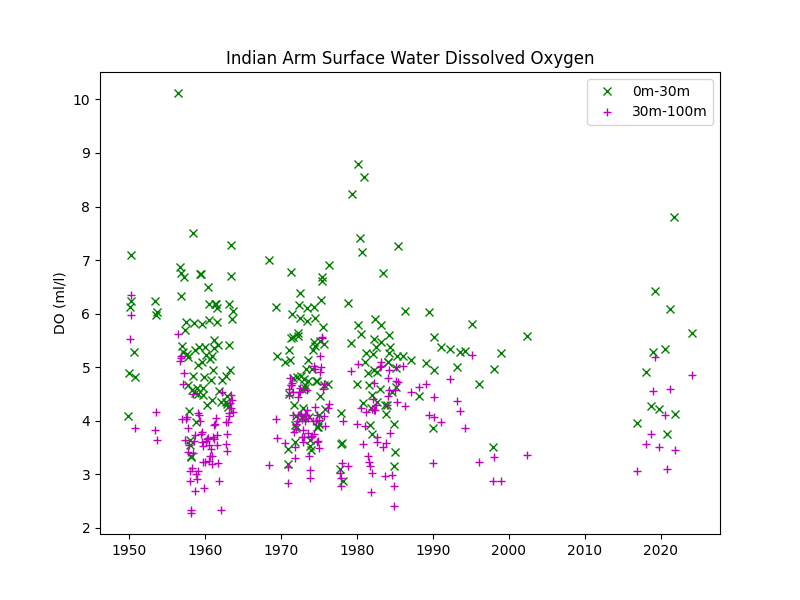
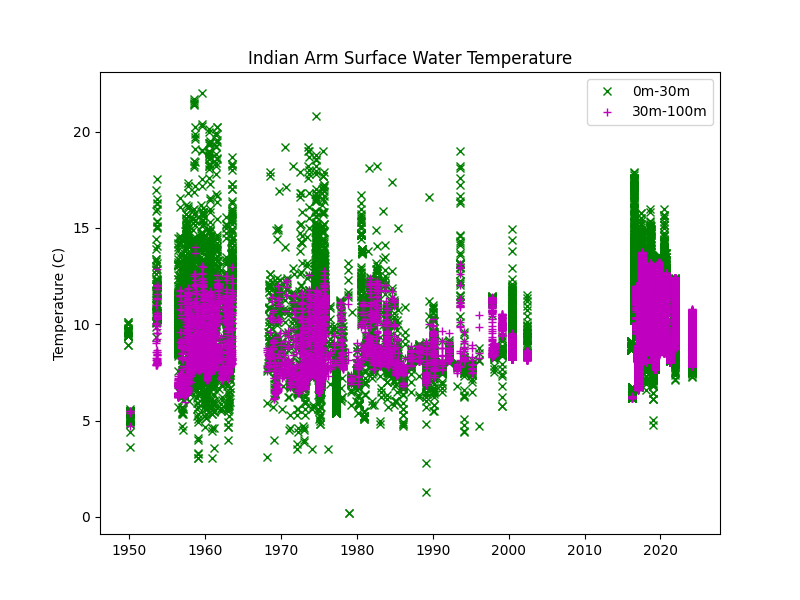
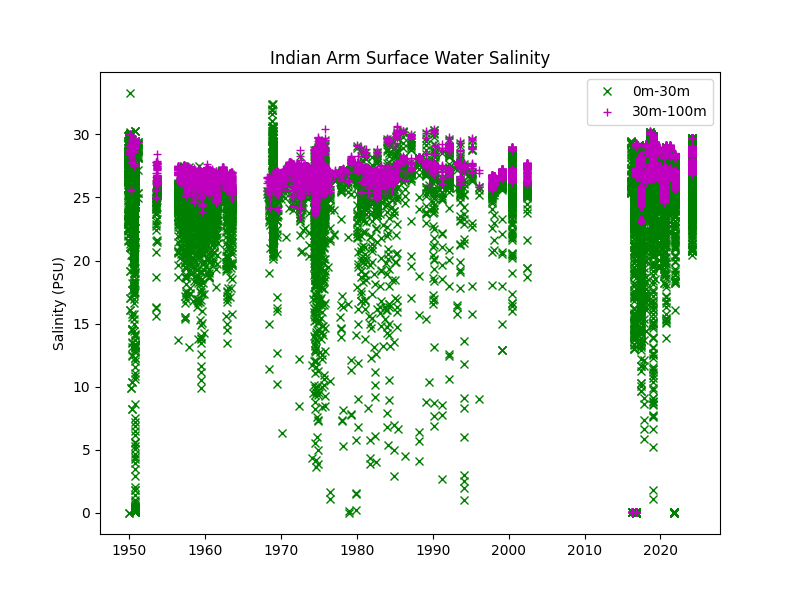
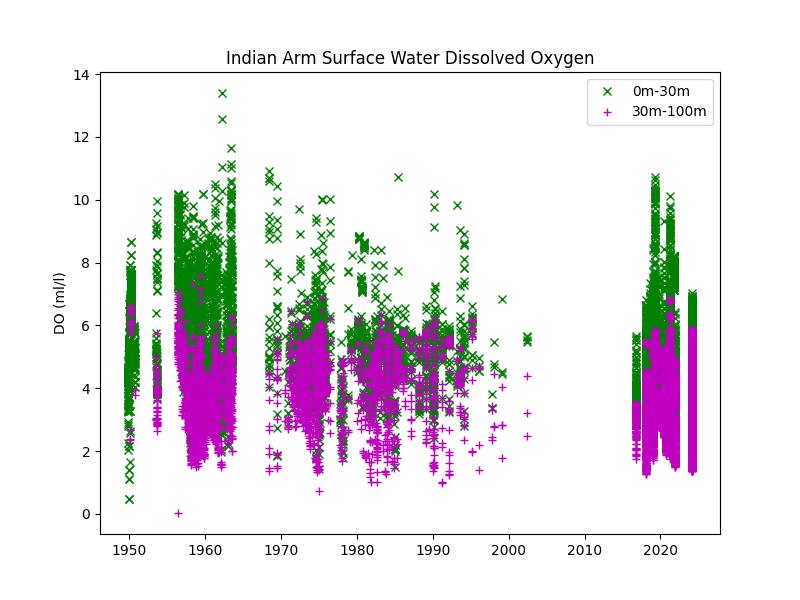
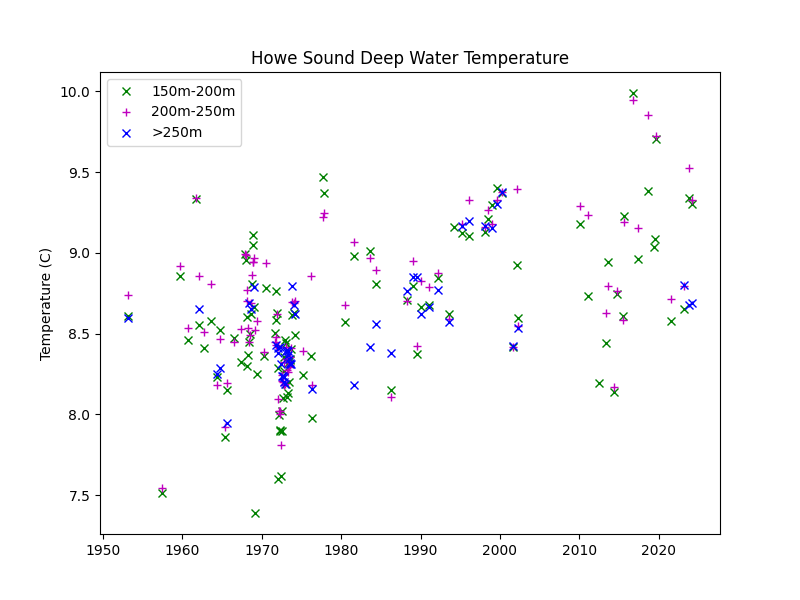
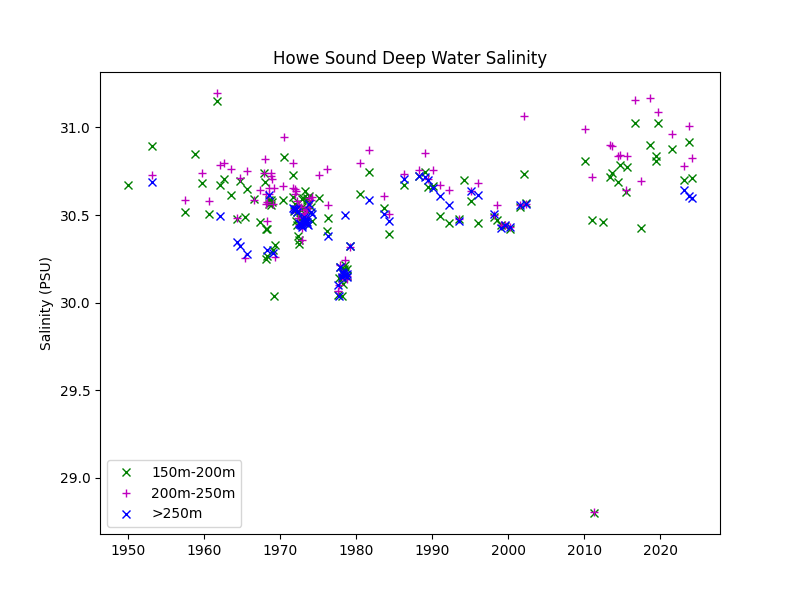
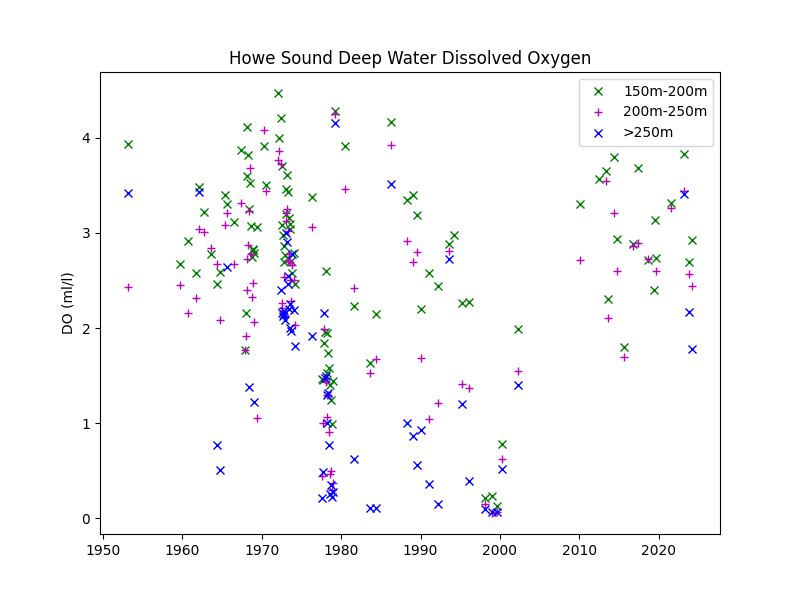
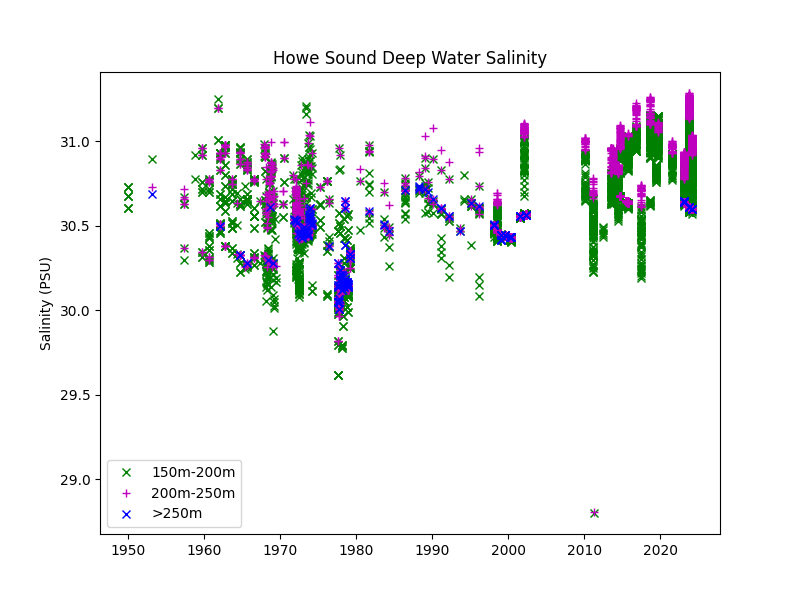
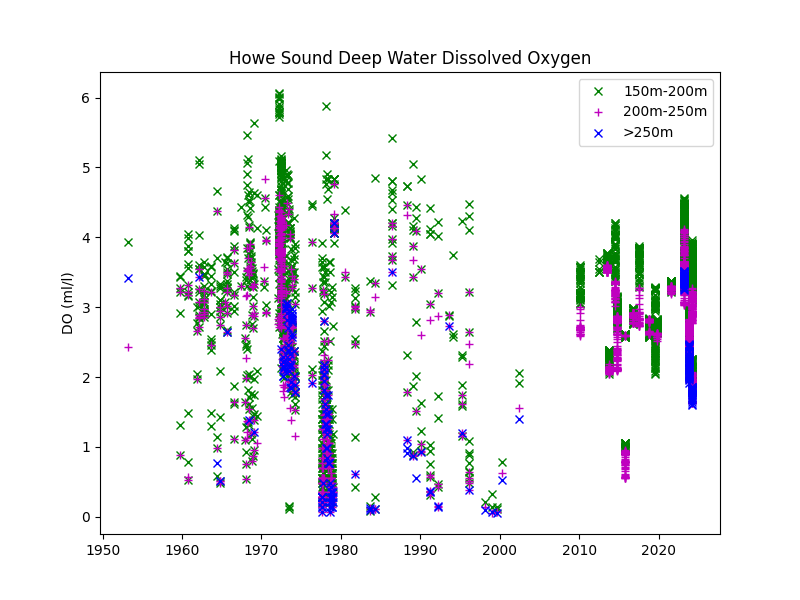
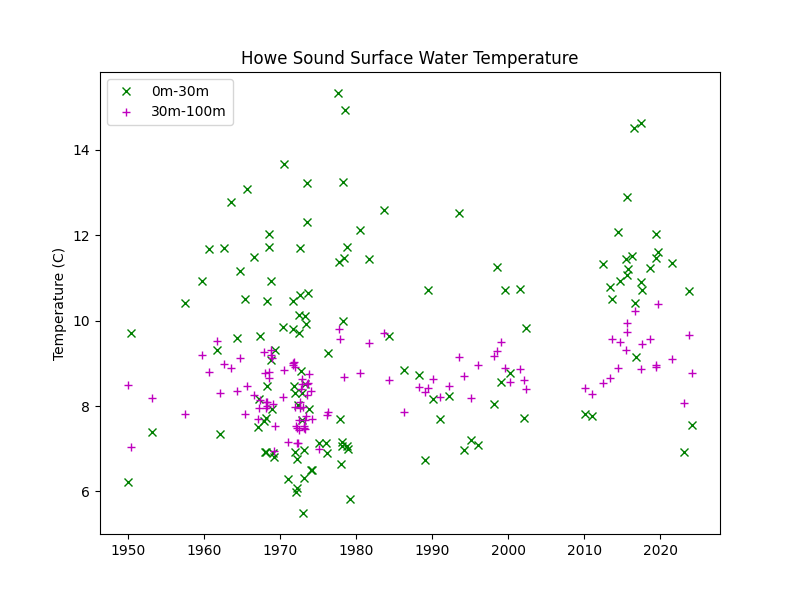
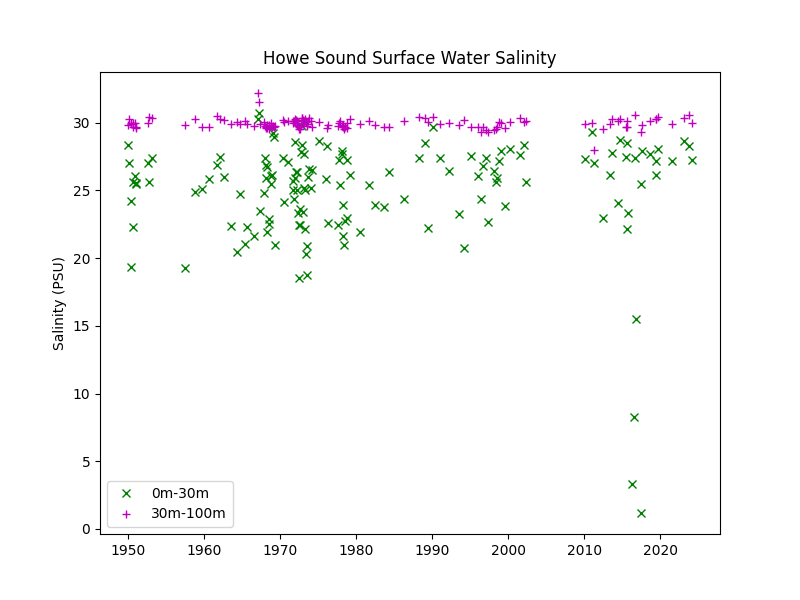
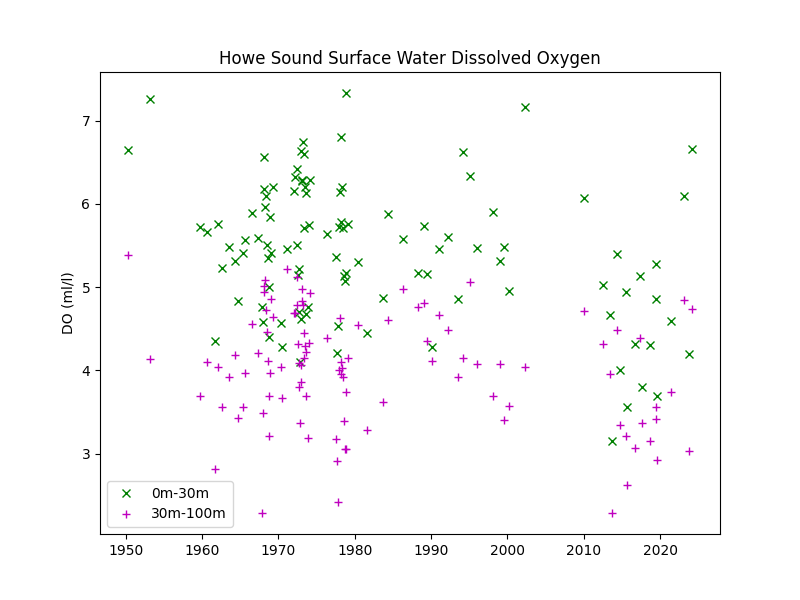
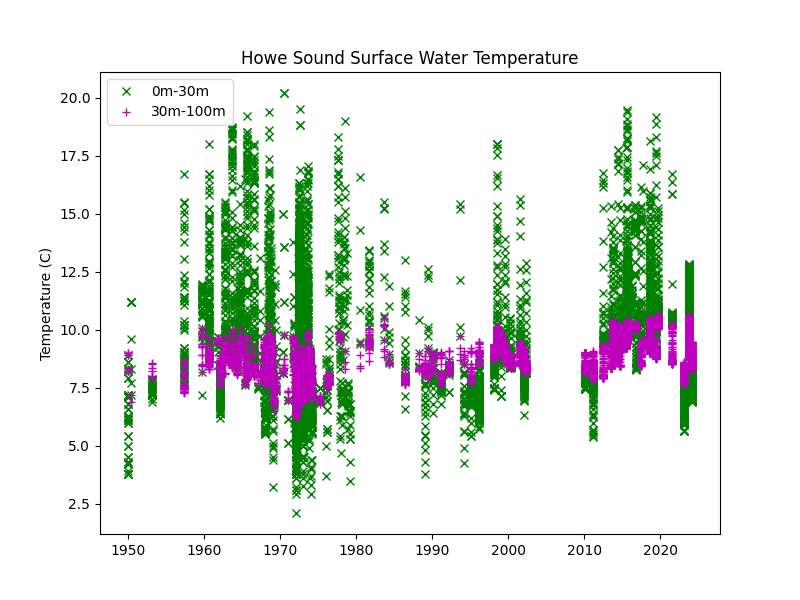
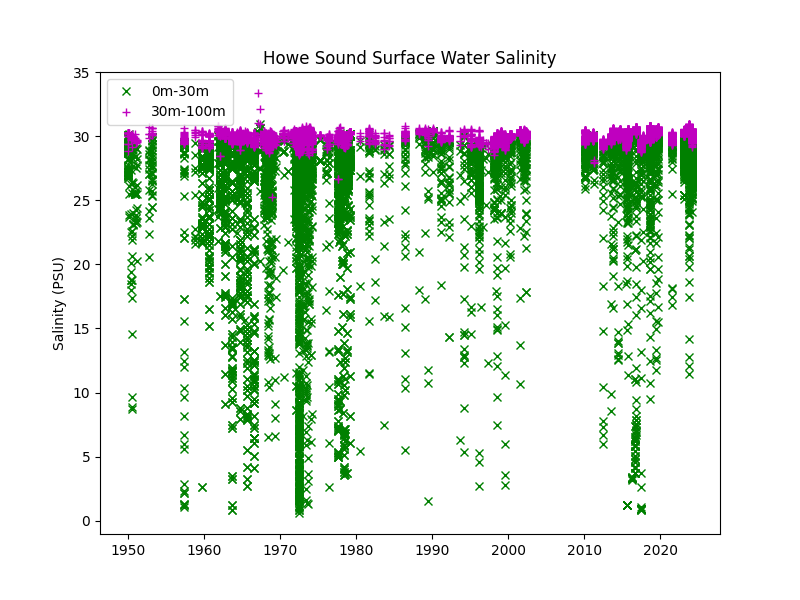
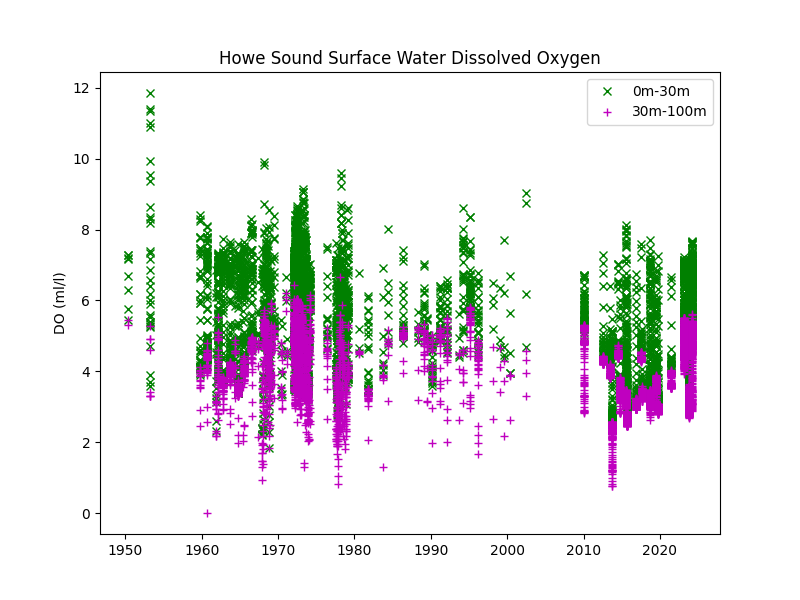
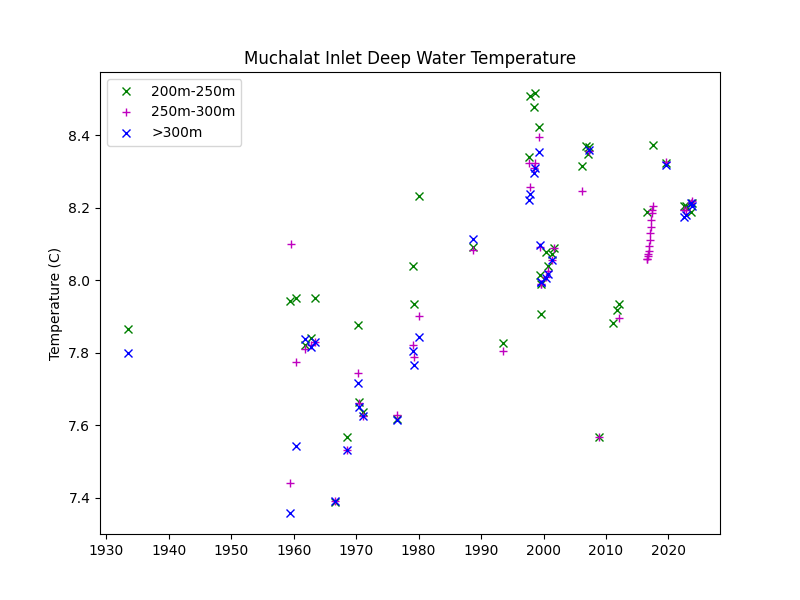
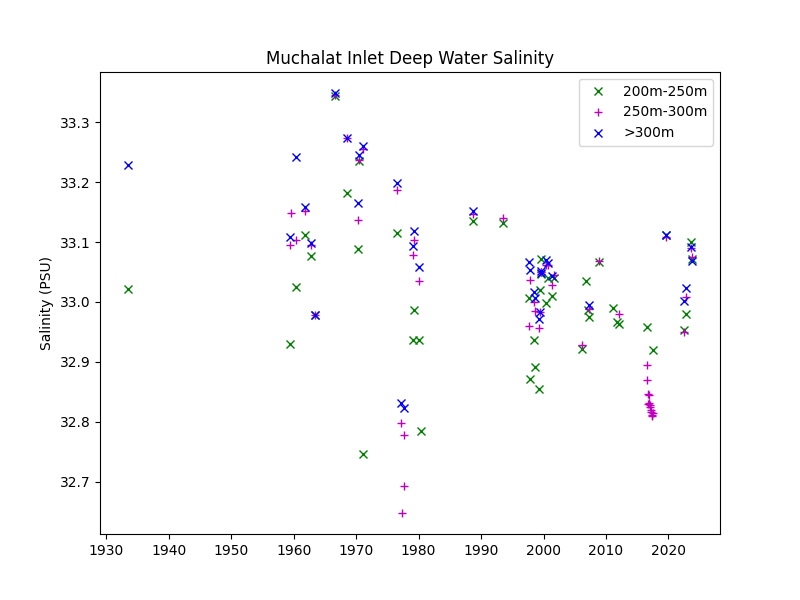
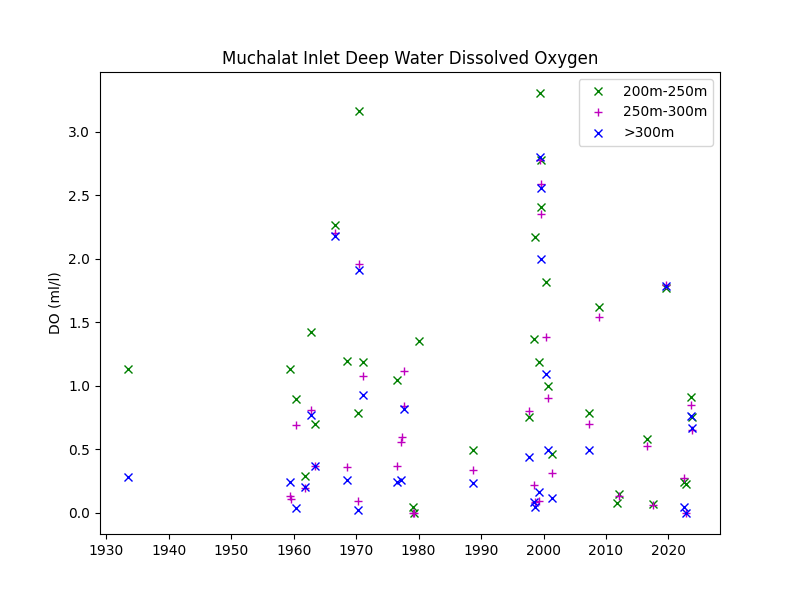
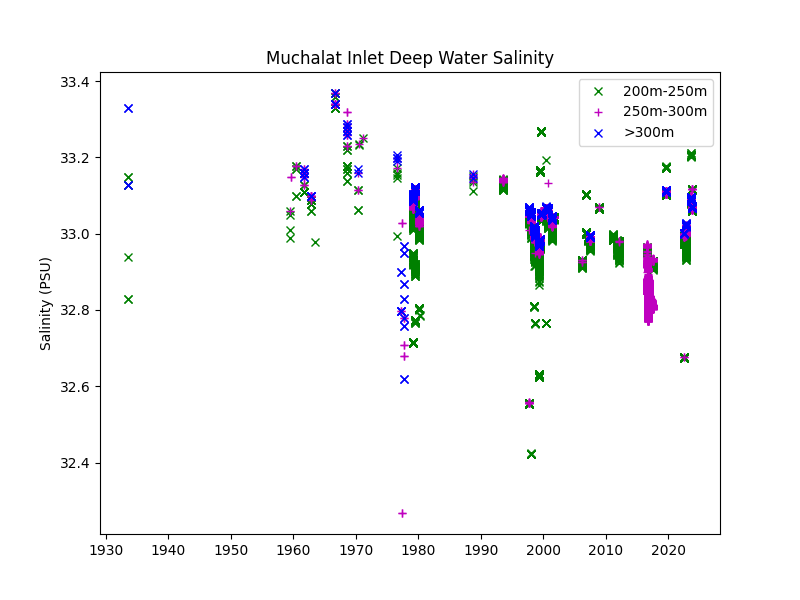
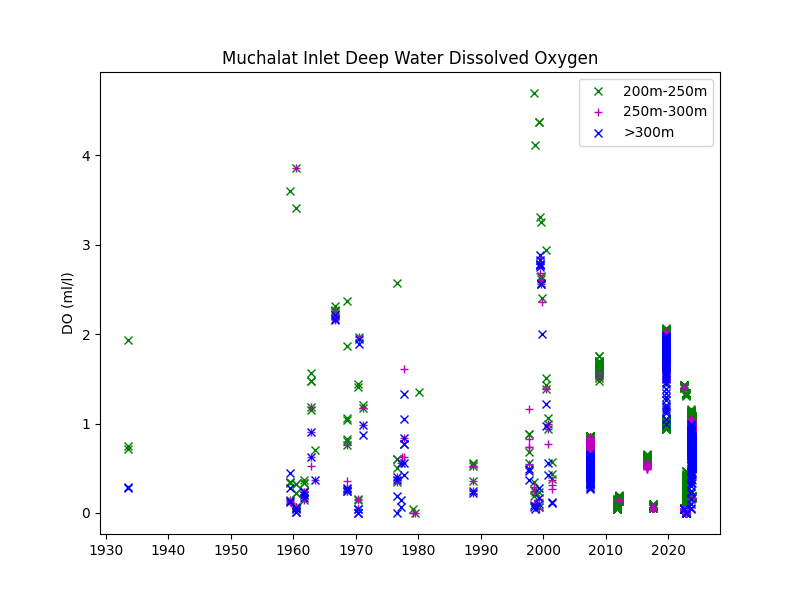
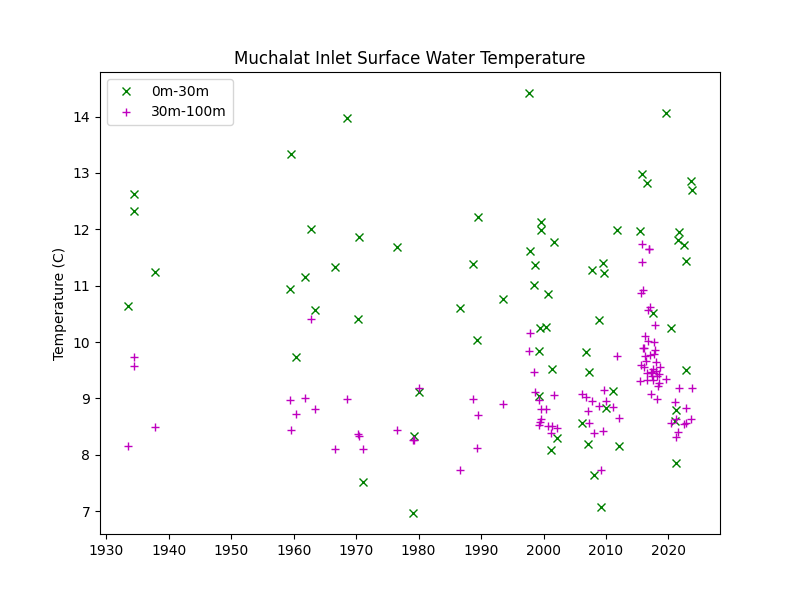
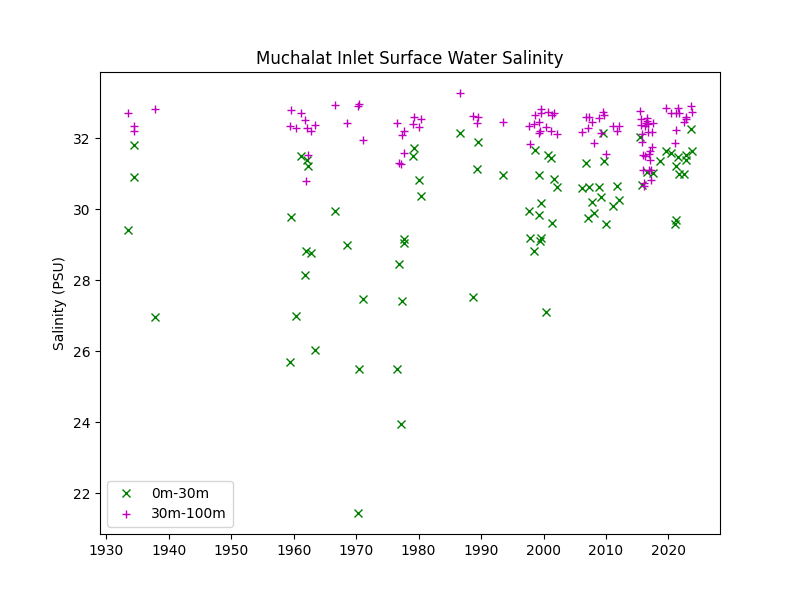
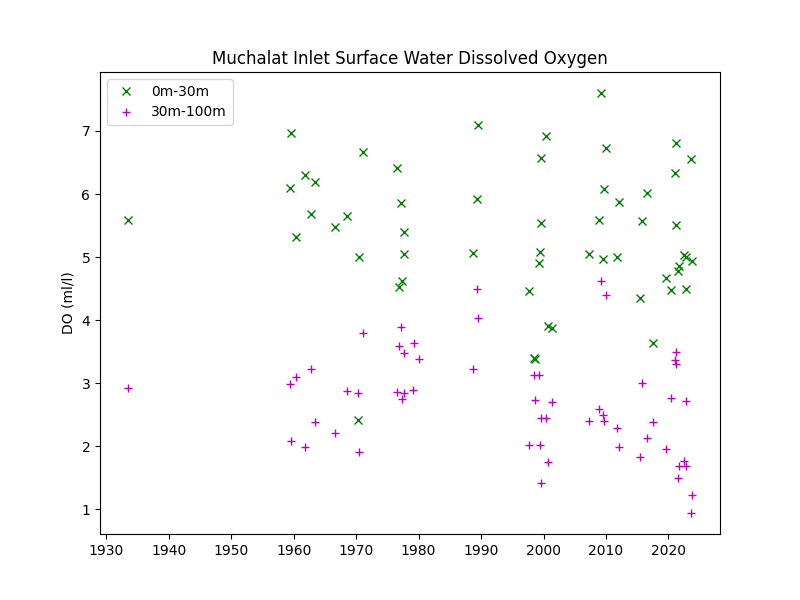
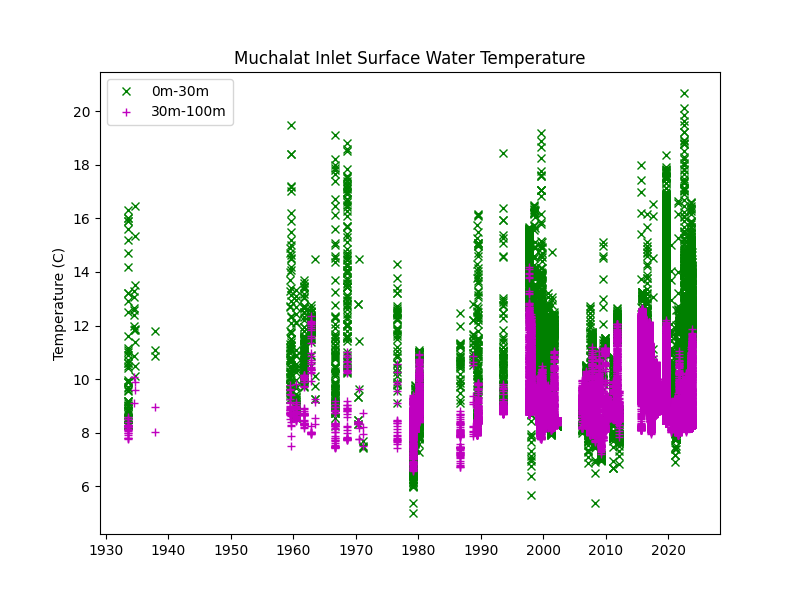
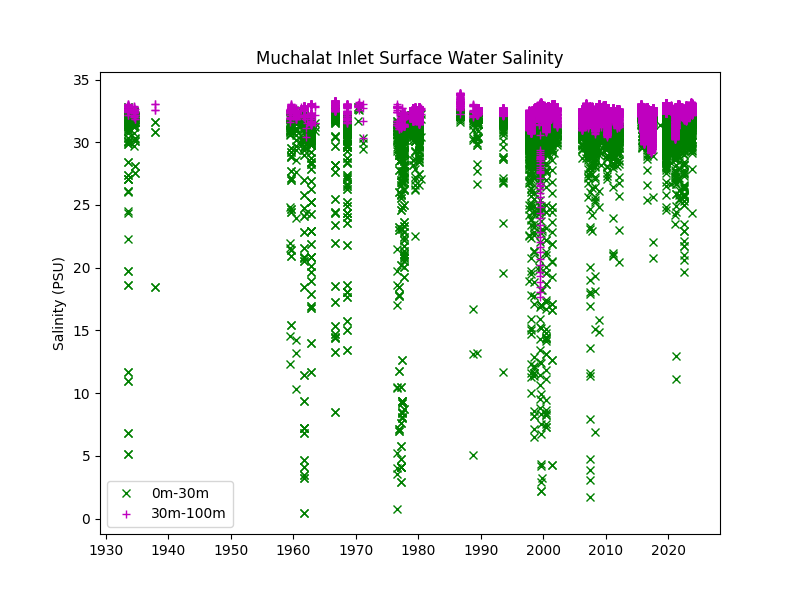
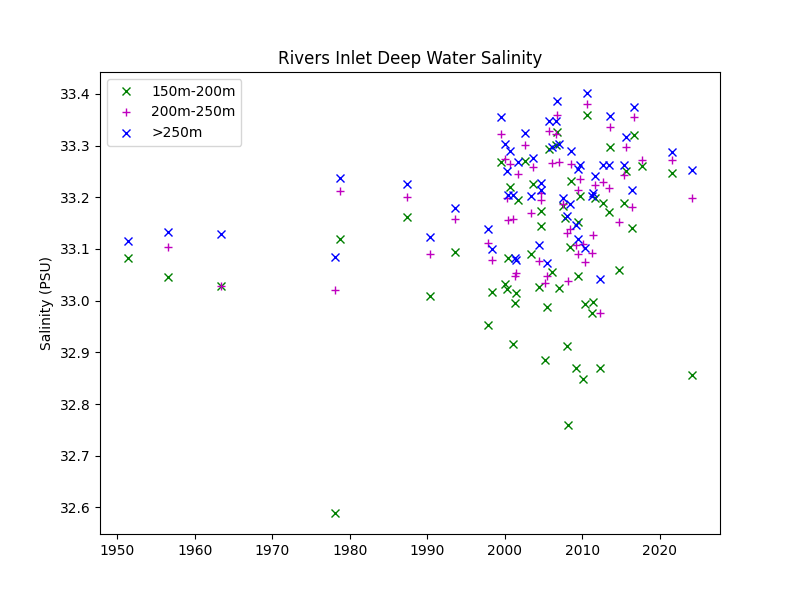
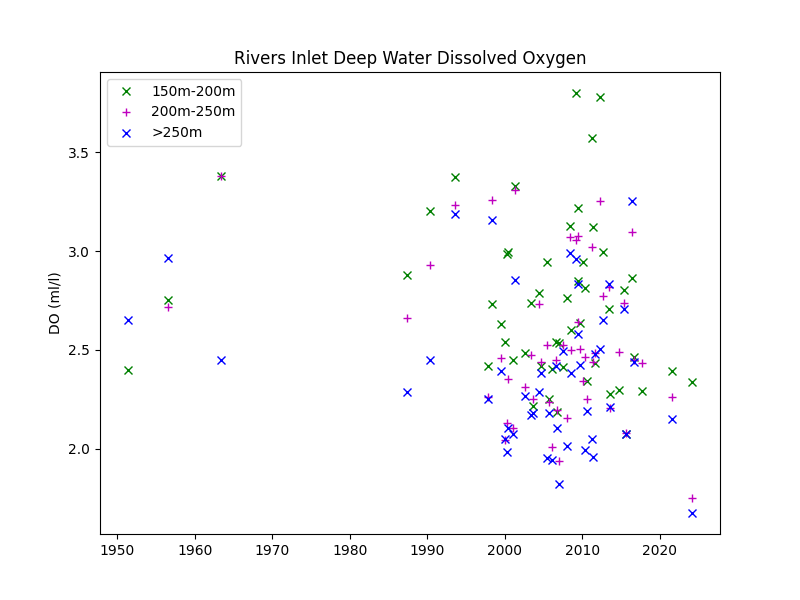
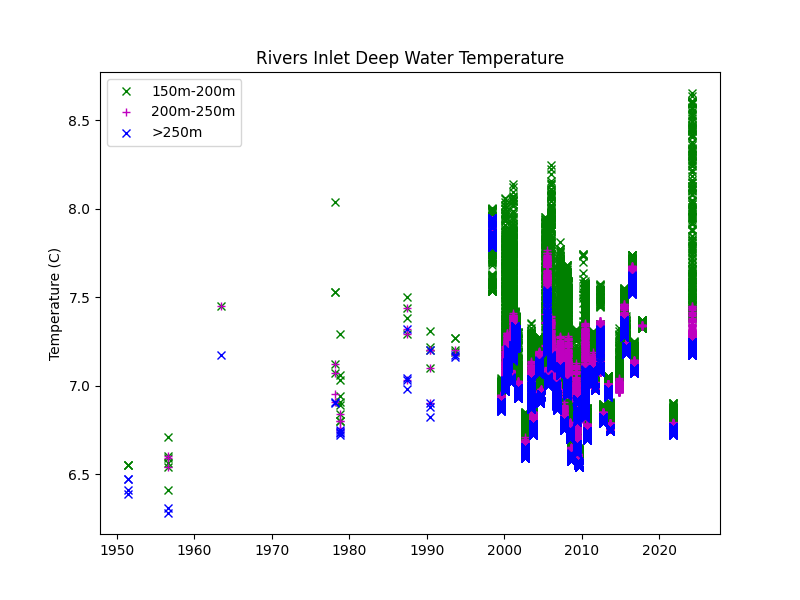
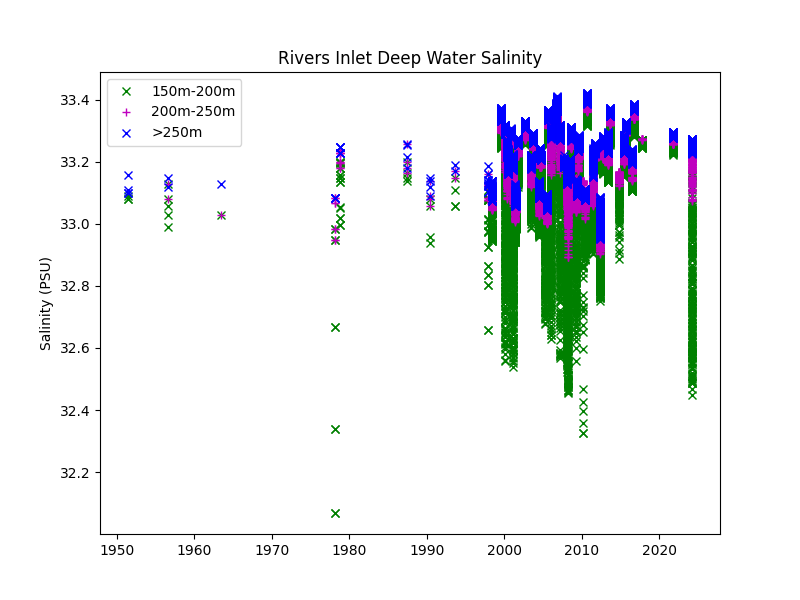
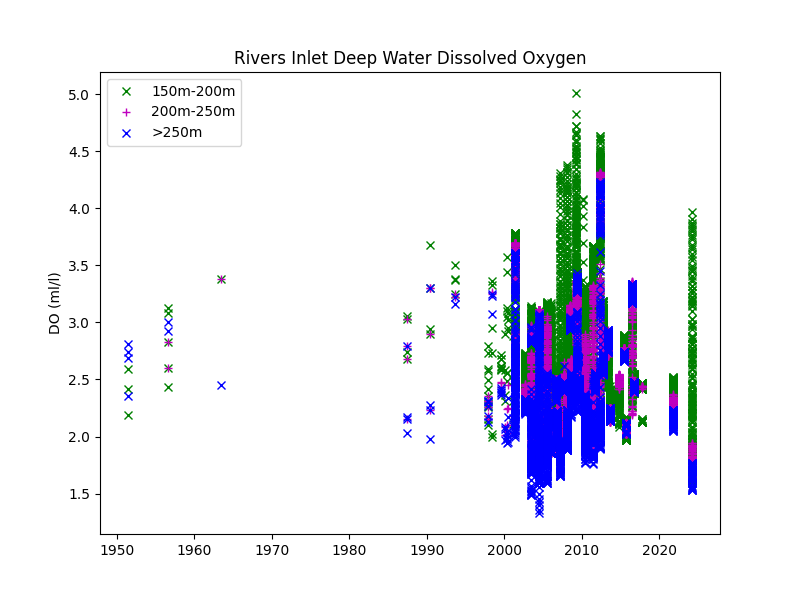
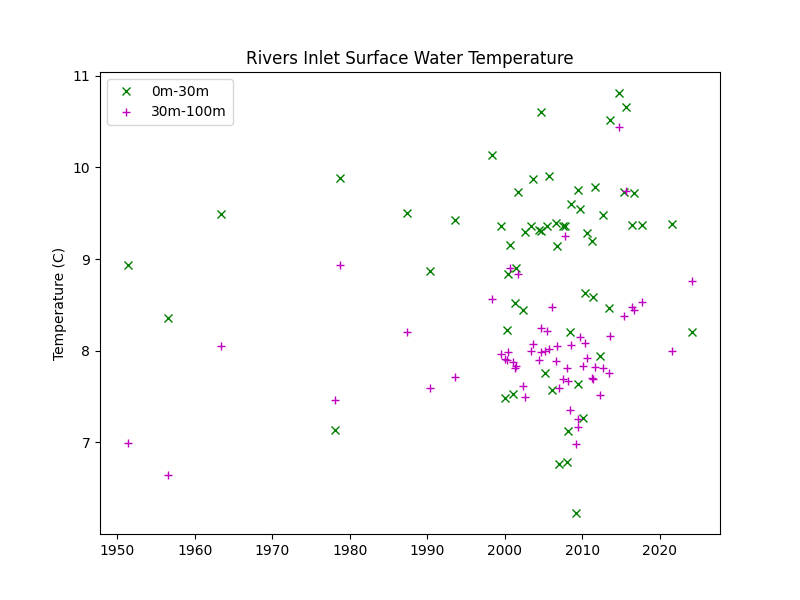
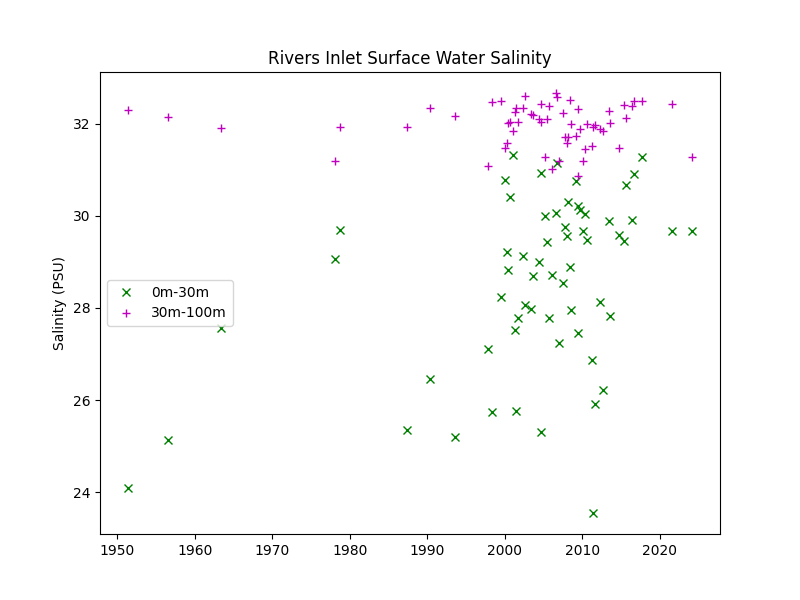
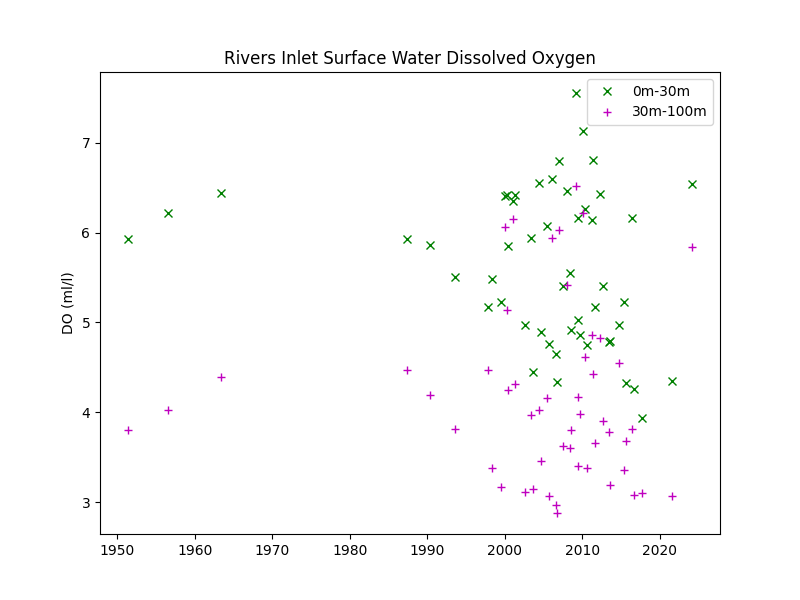
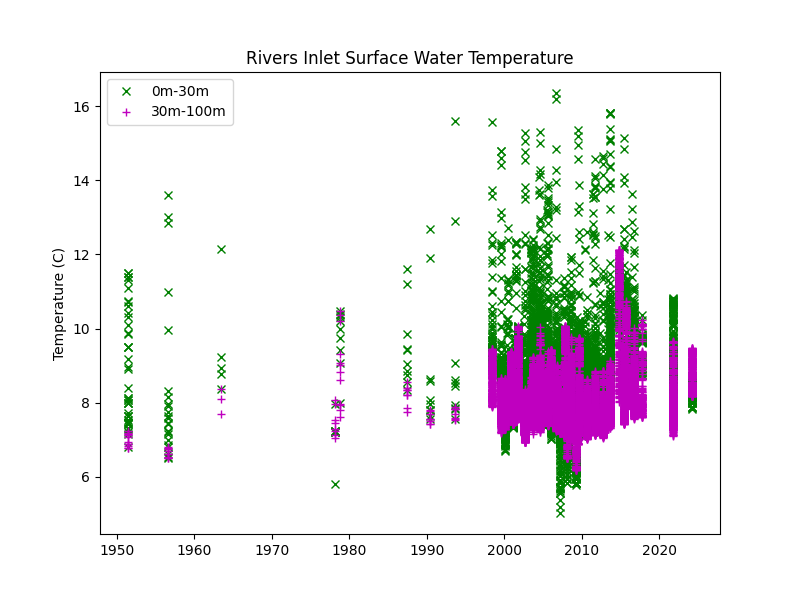
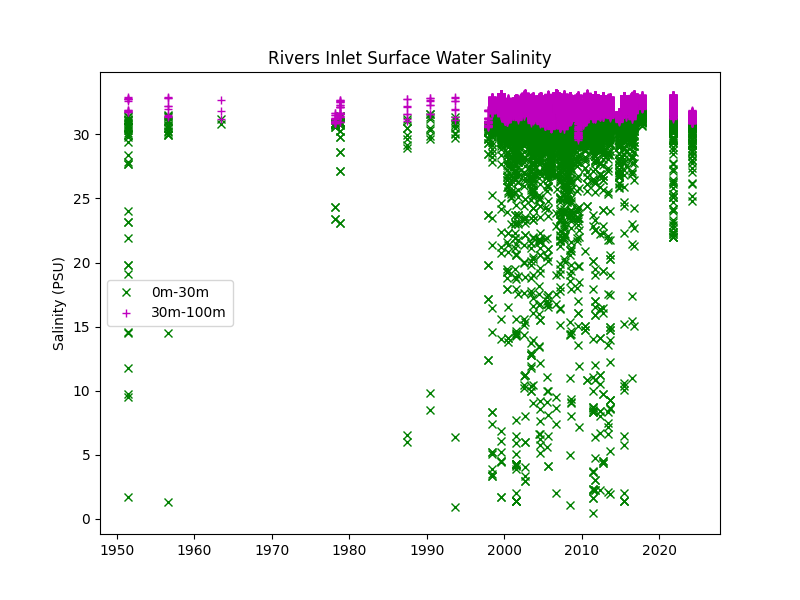
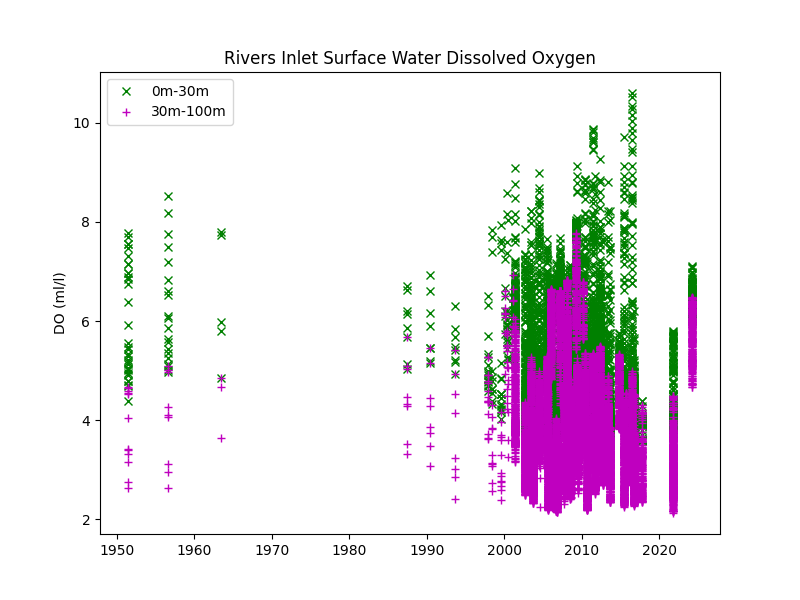
Data is not averaged. All data found is shown, coloured according to its depth.
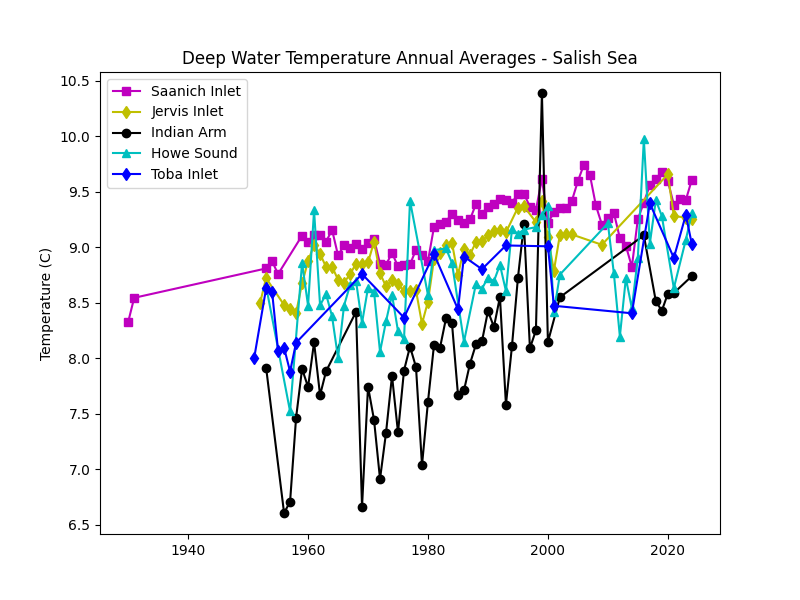
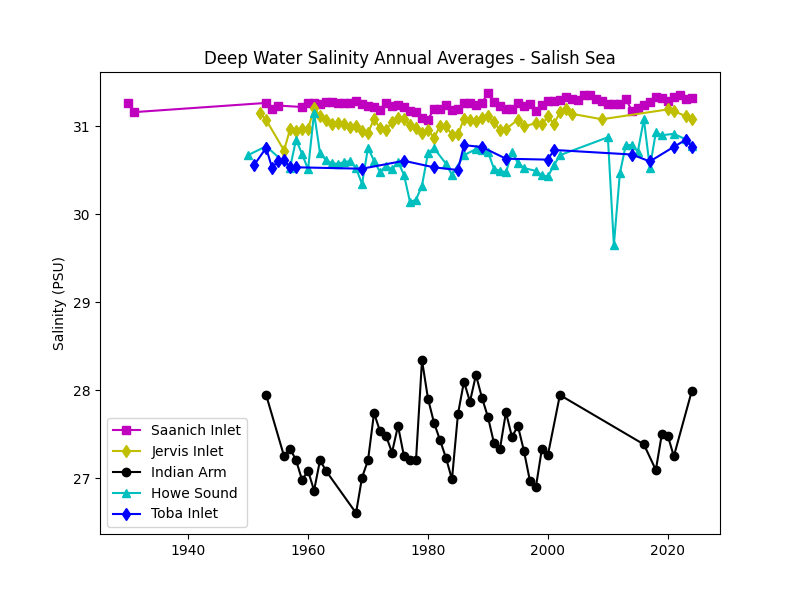
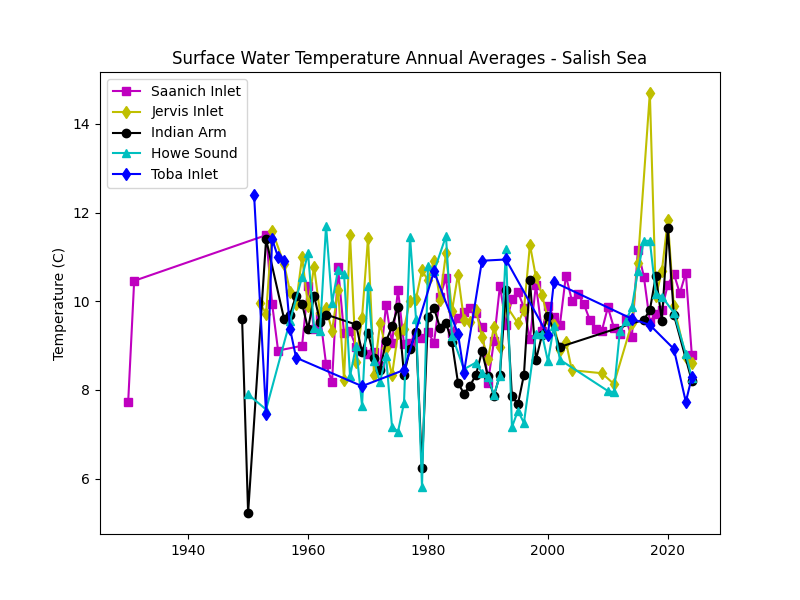
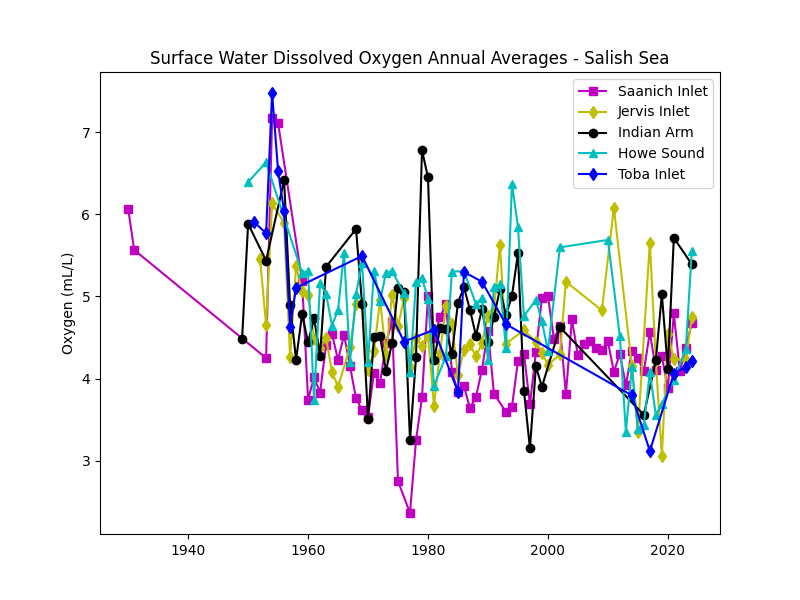
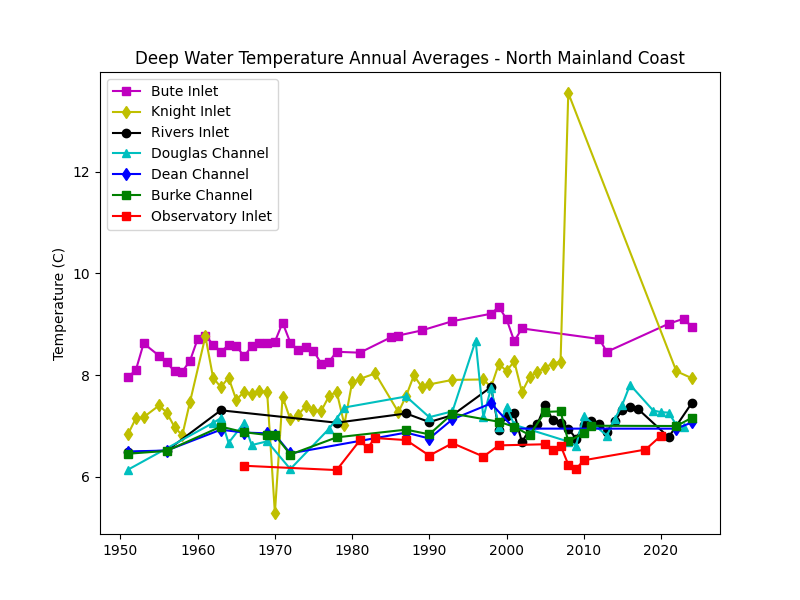
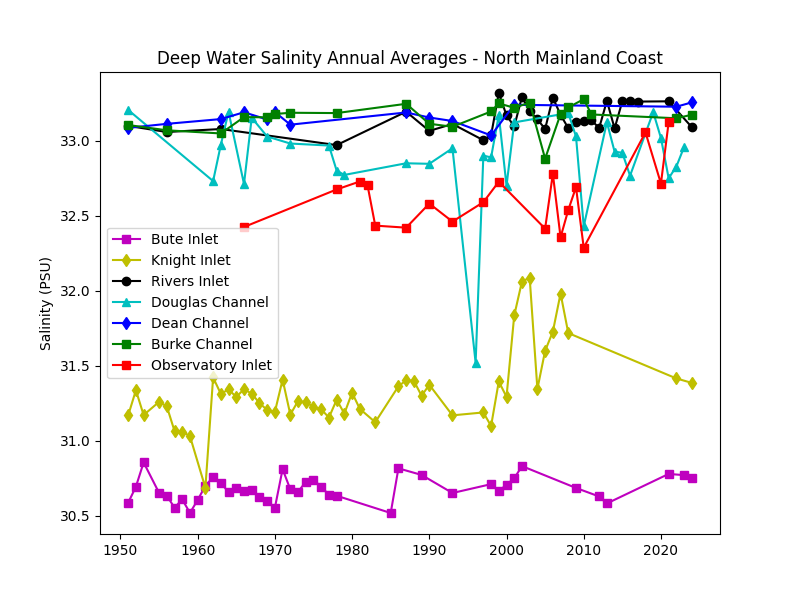
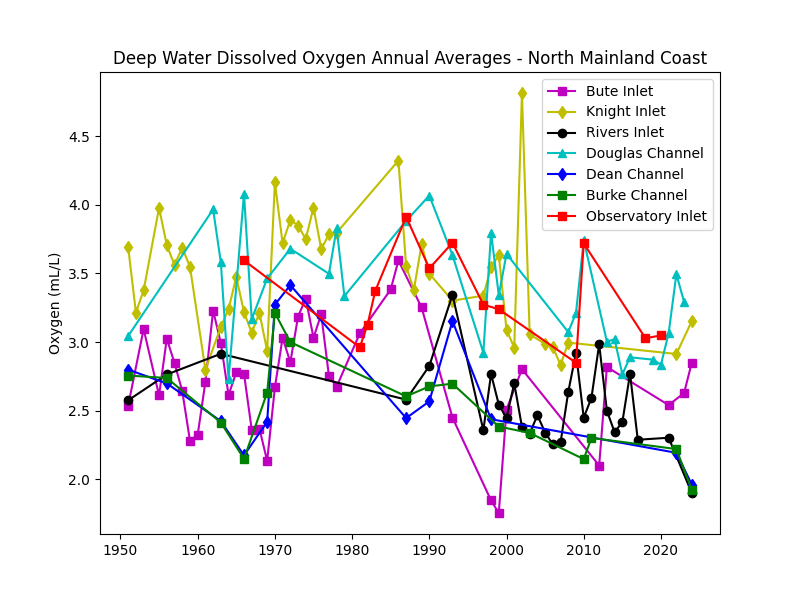
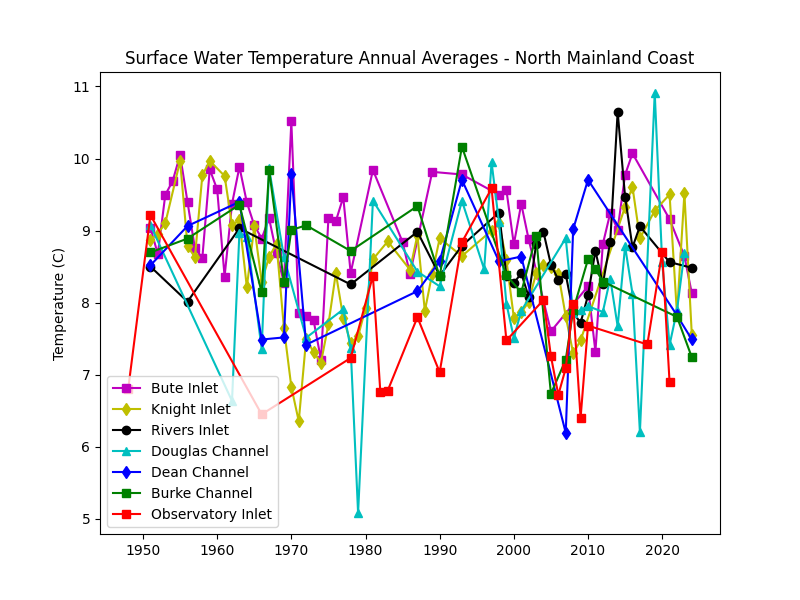
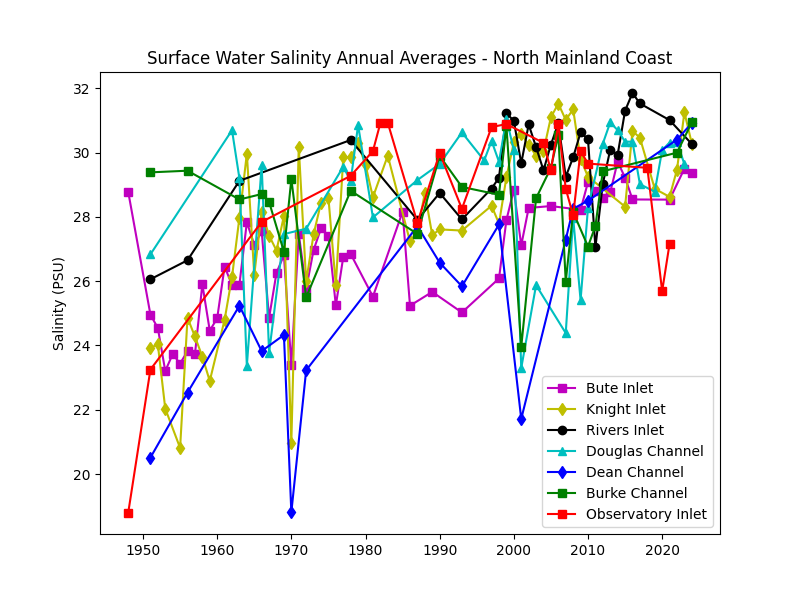
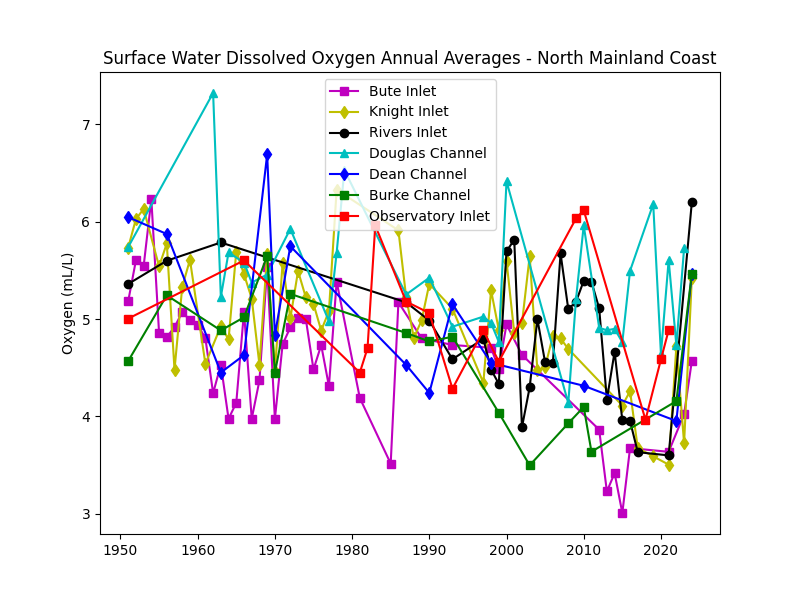
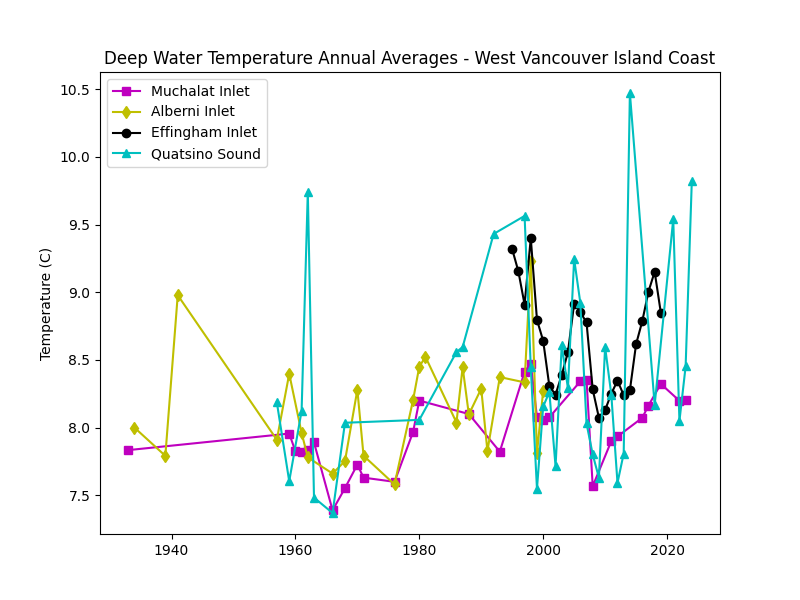
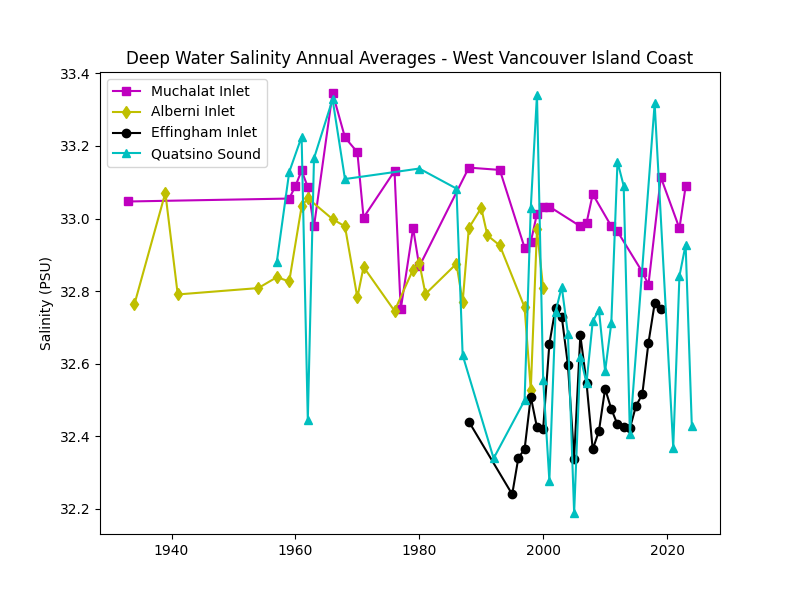
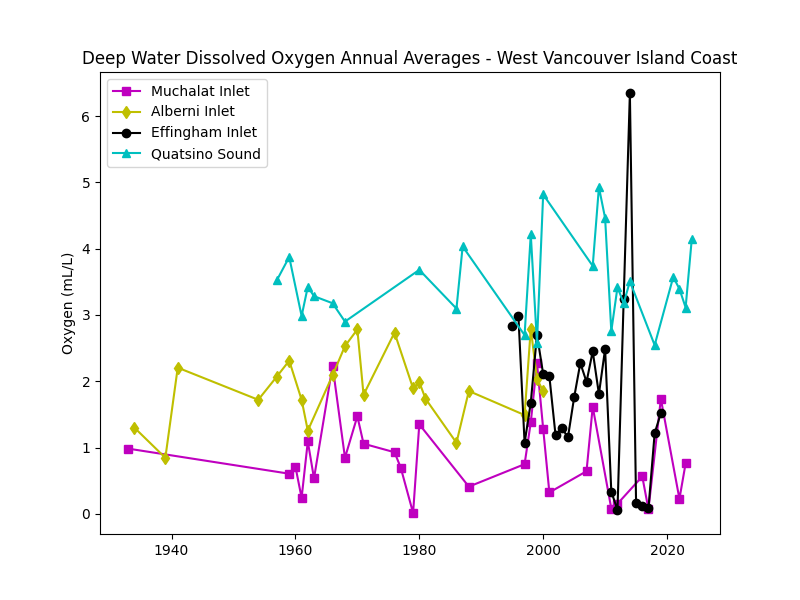
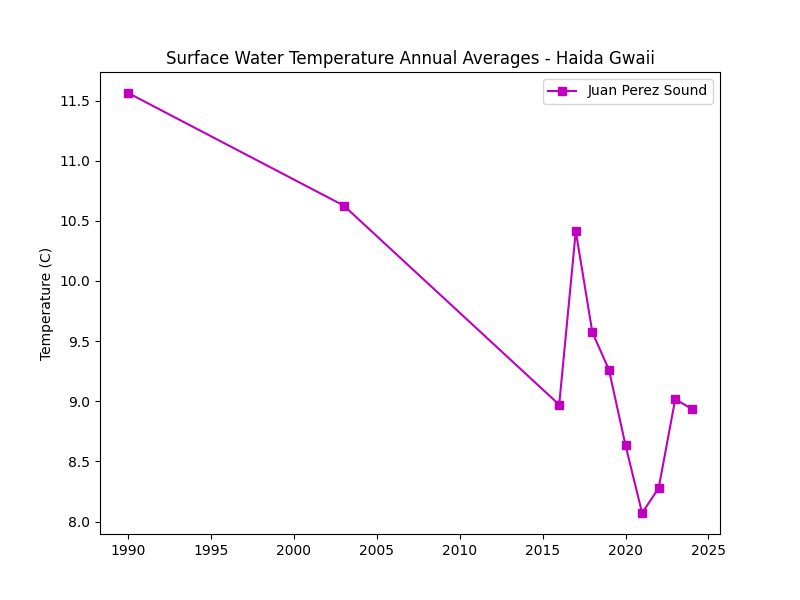
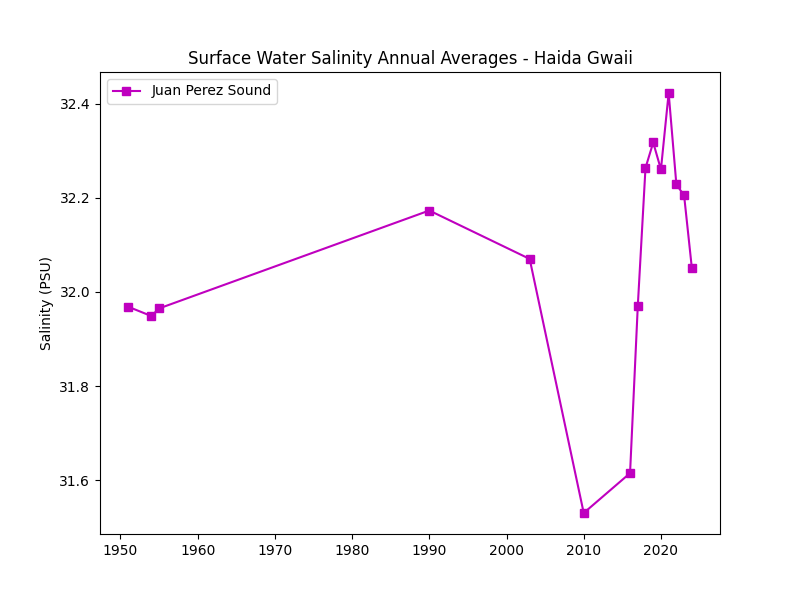
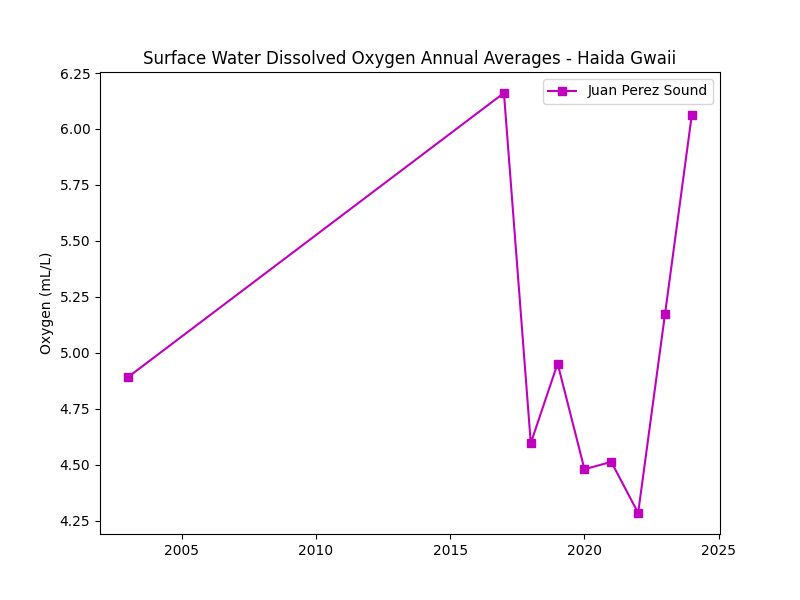
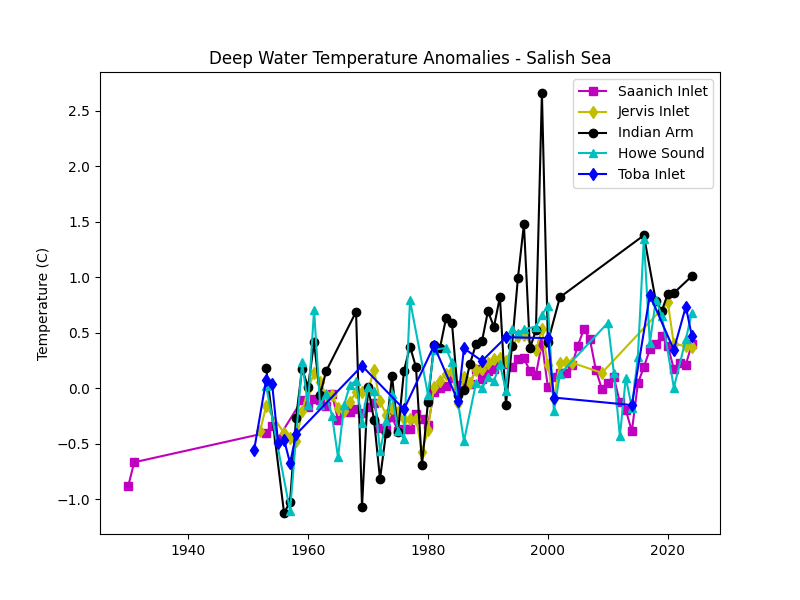
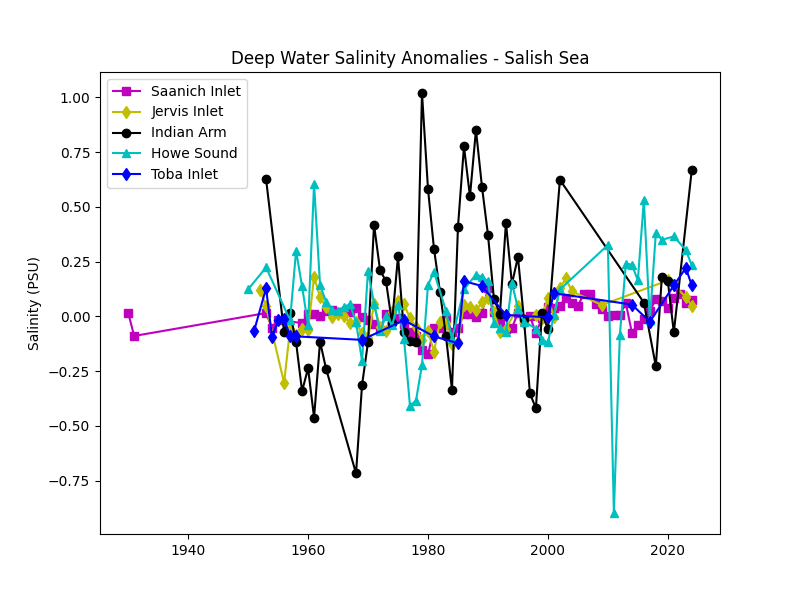
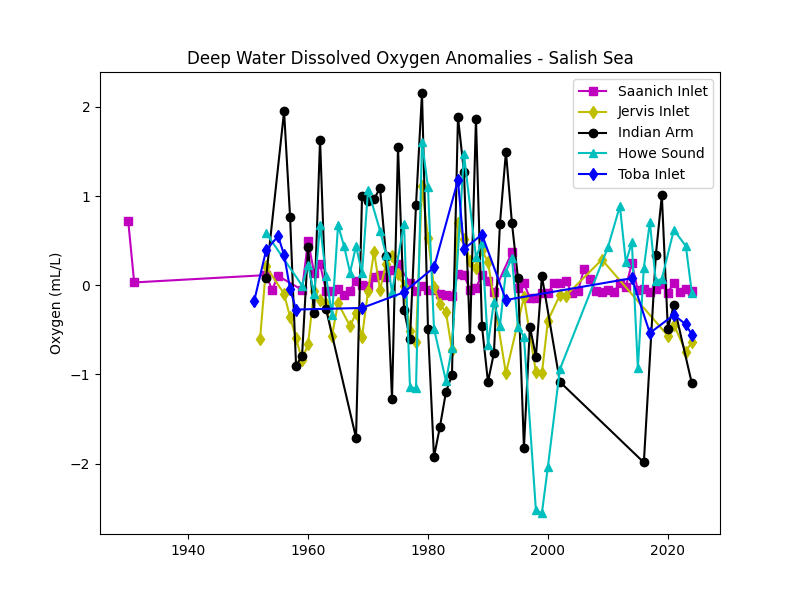
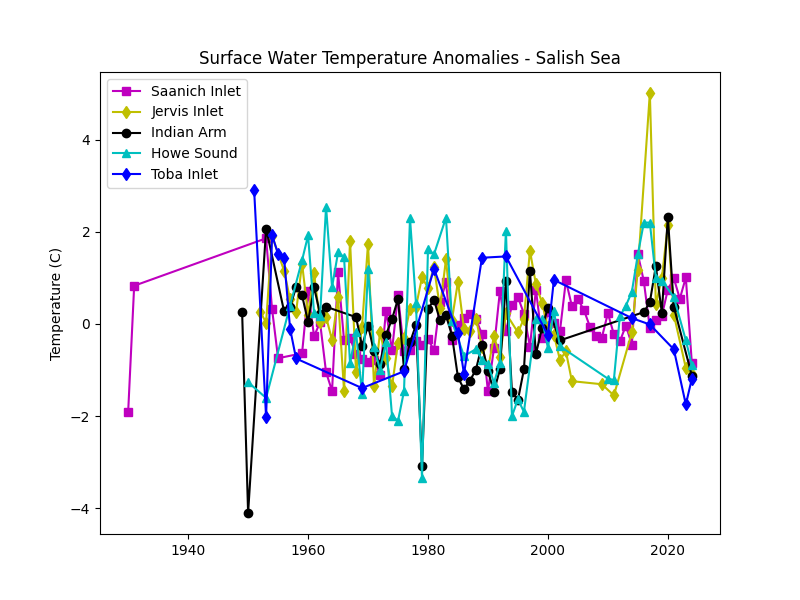
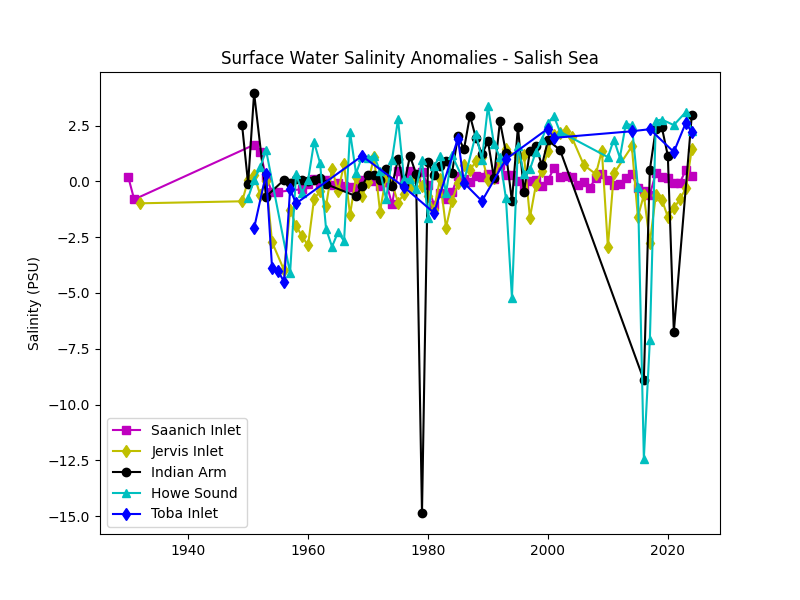
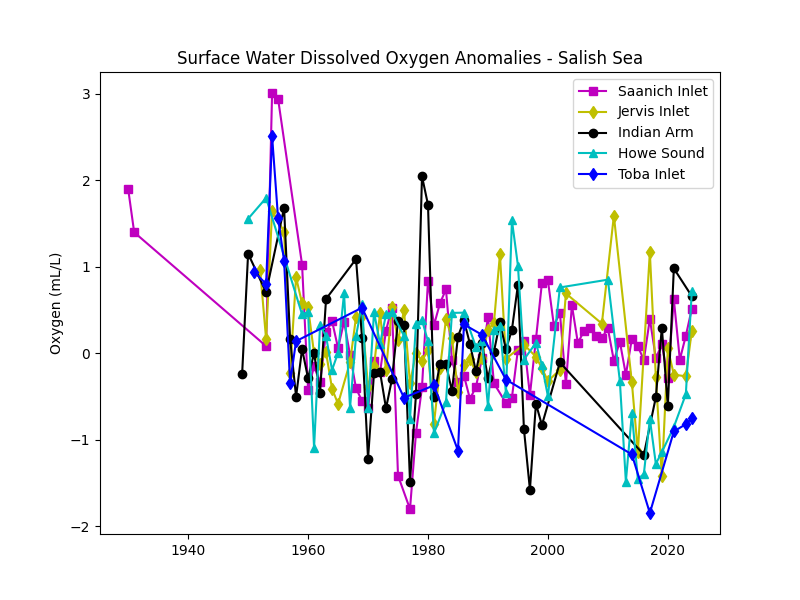
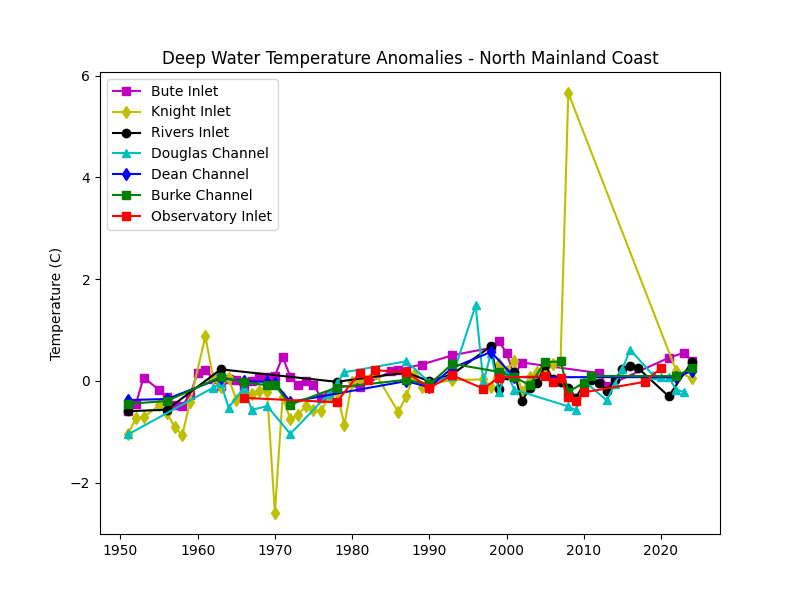
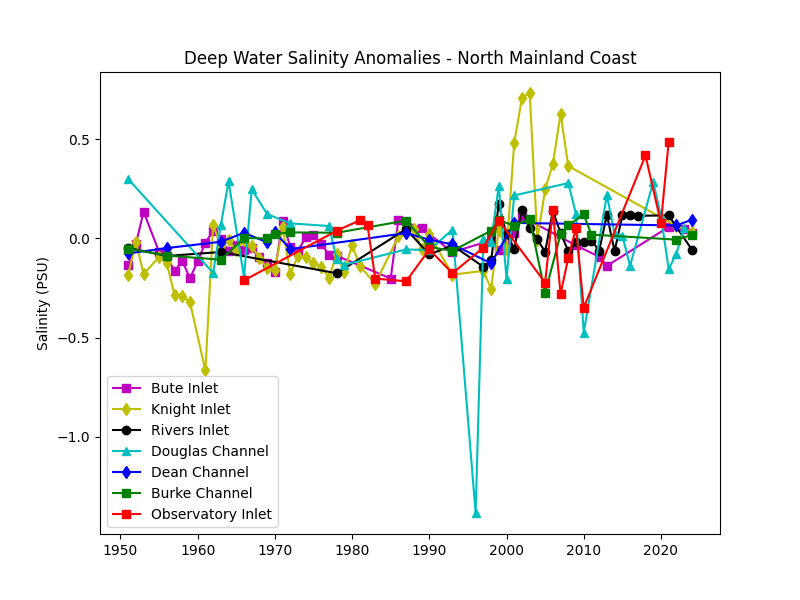
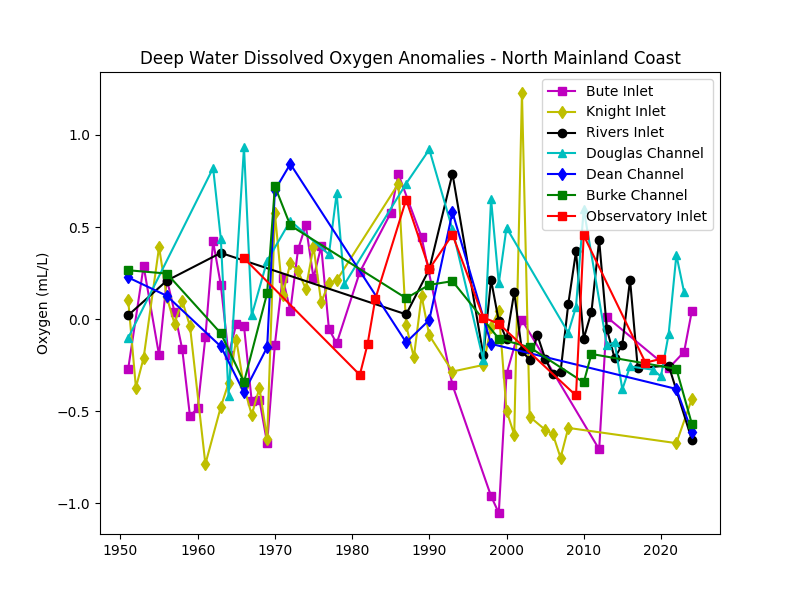
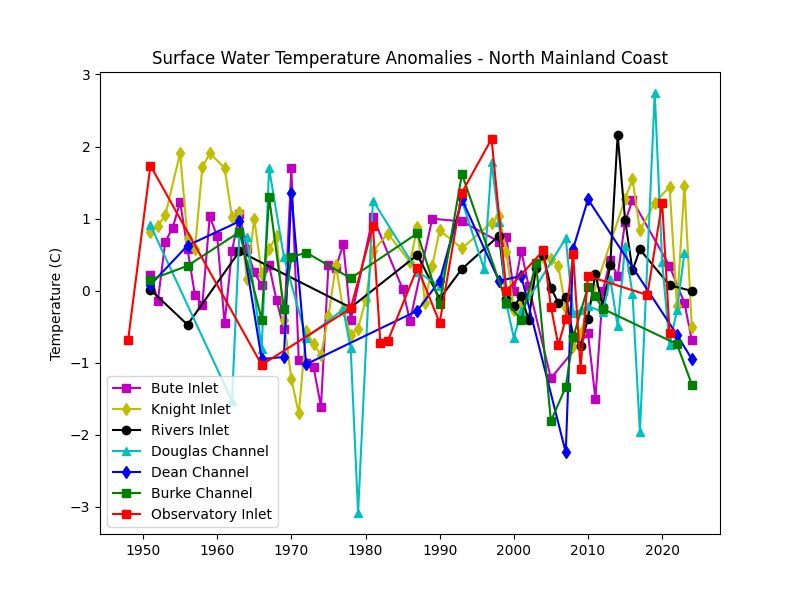
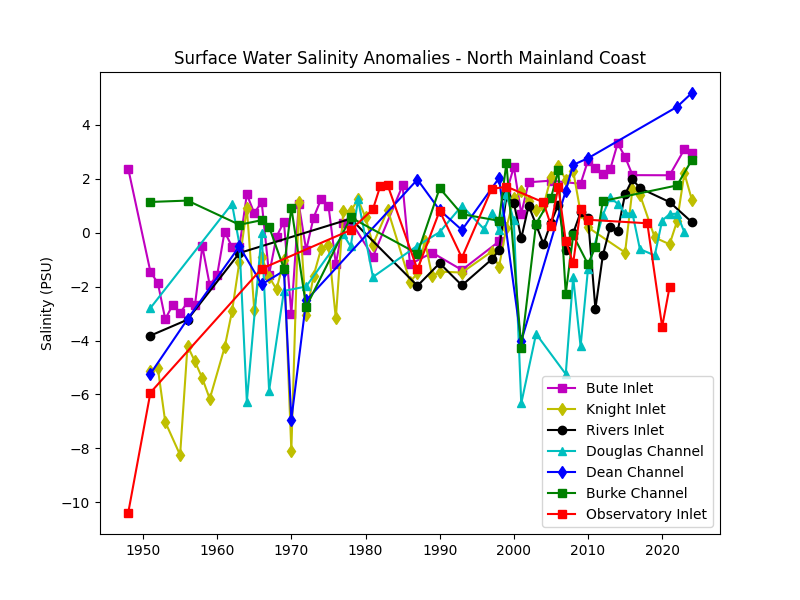
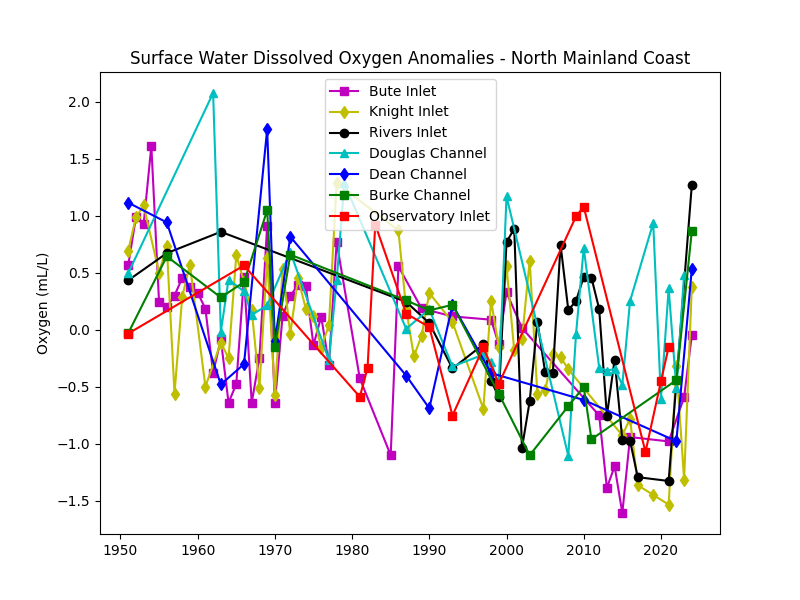
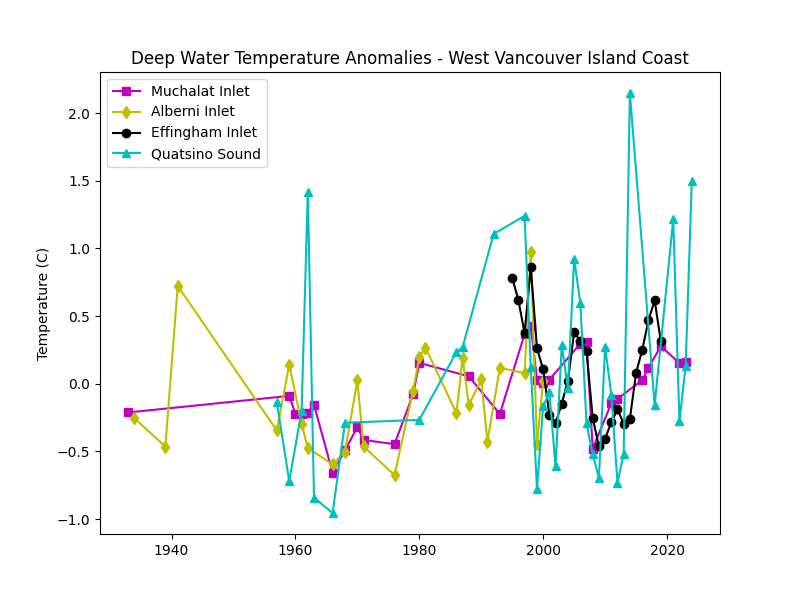
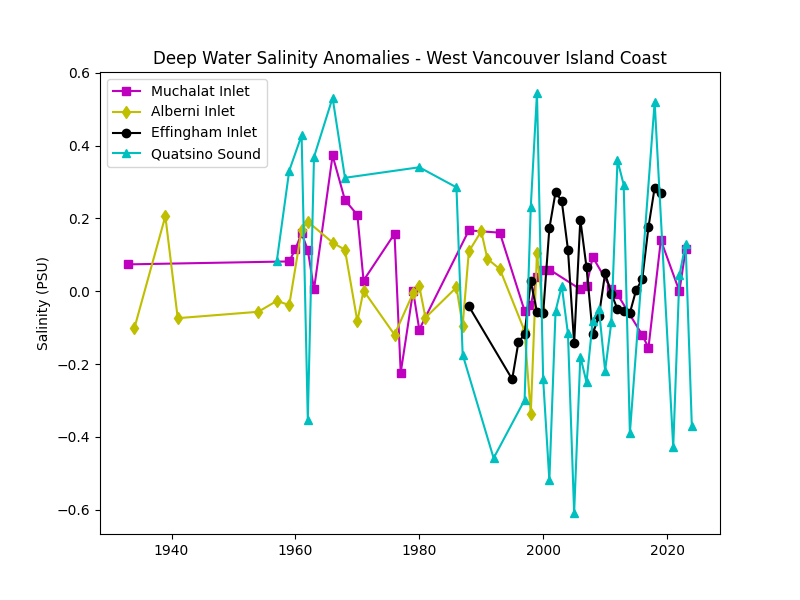
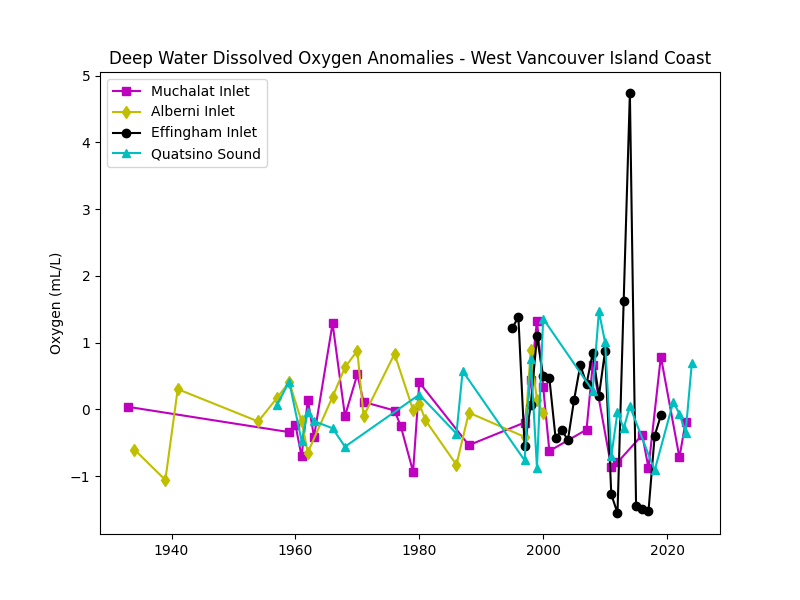
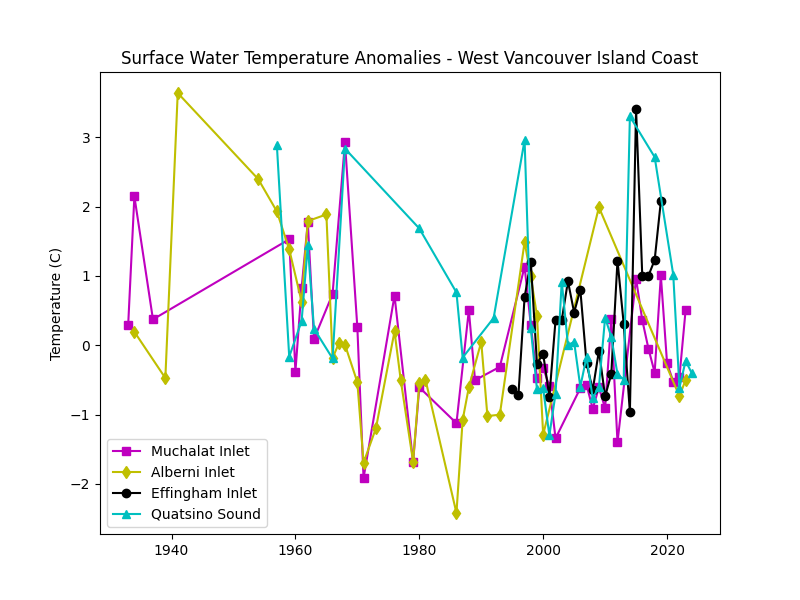
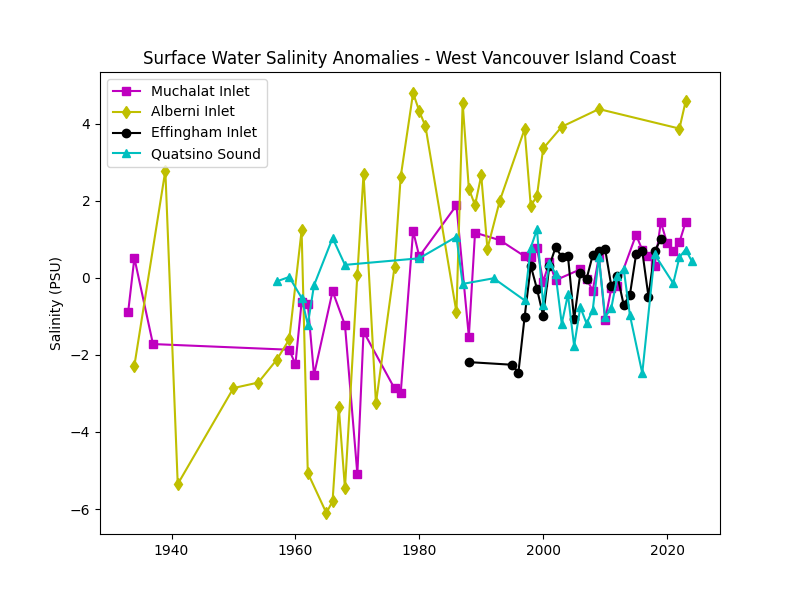
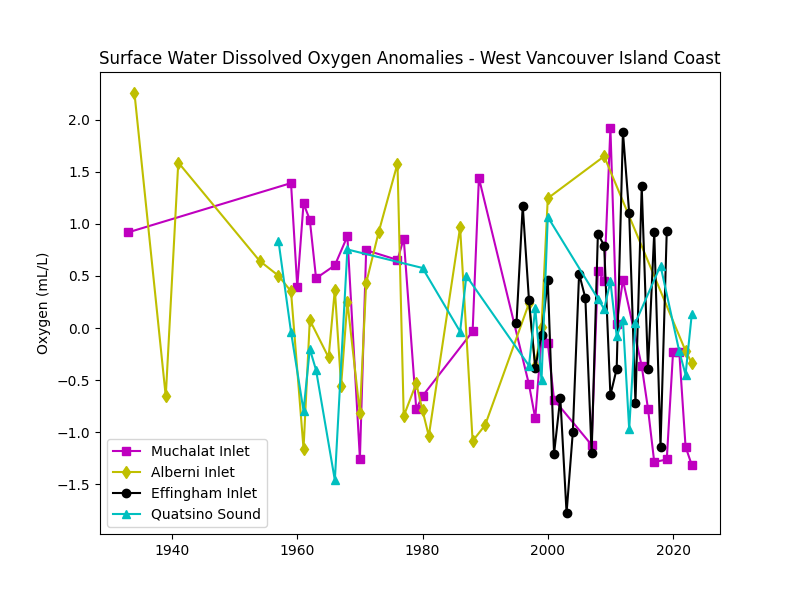
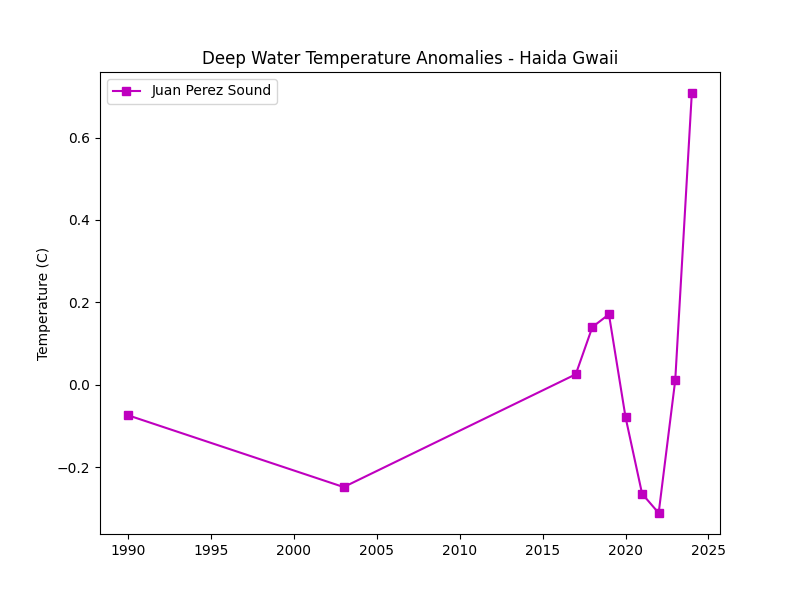
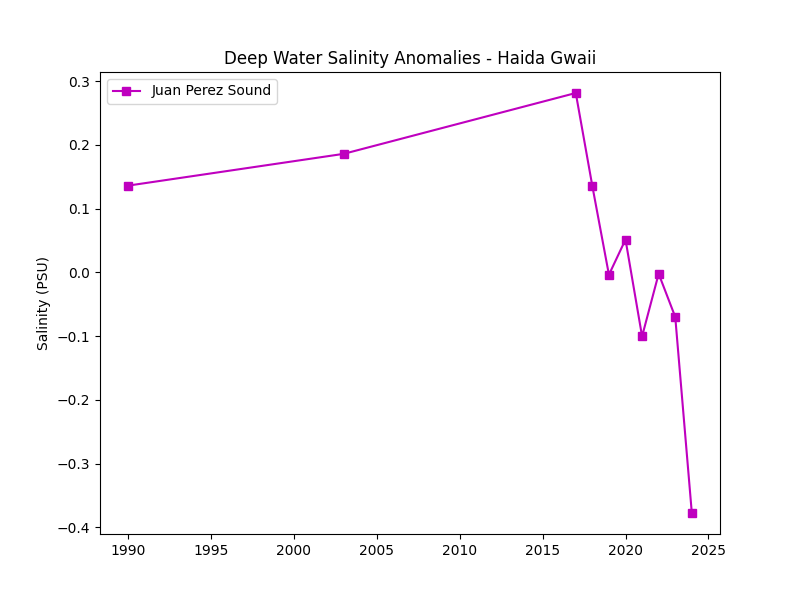
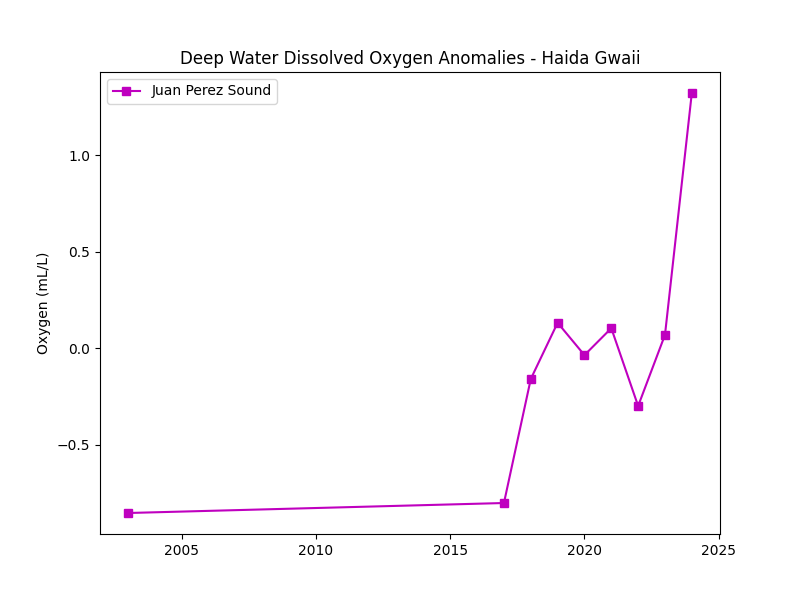
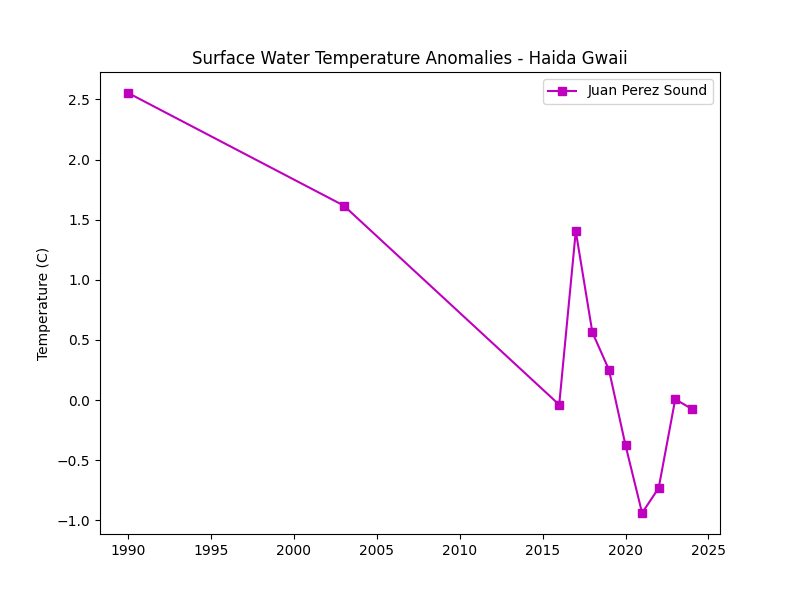
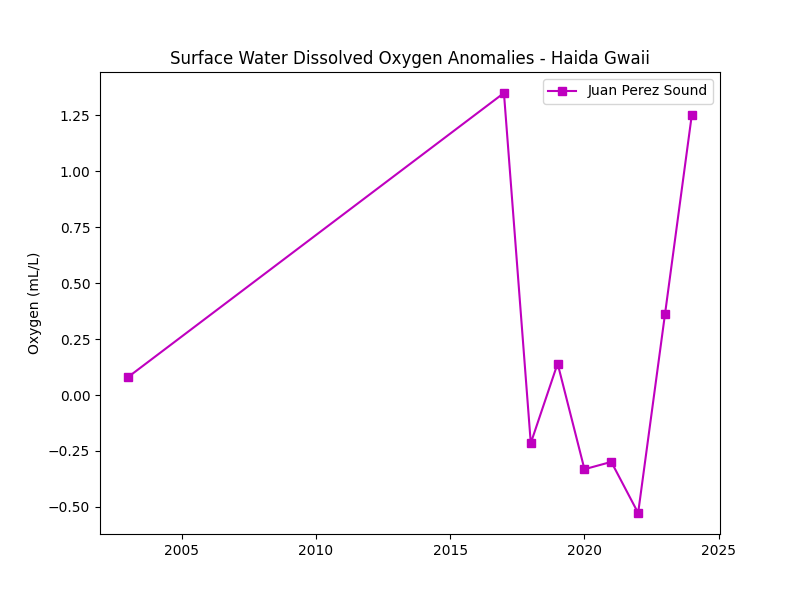
Annual averages and anomalies time series of deep water properties facilitate the comparison of deep water variations among the inlets. For individual inlets, arithmetic means of deep water properties were calculated for each data file/profile, each month, and then each year for annual averages. Annual anomalies were calculated as the departure of the annually averages deep water property from the mean of the time series from the start year of the time series to the present. Annual averages and anomalies for temperature, salinity, and dissolved oxygen are shown below.
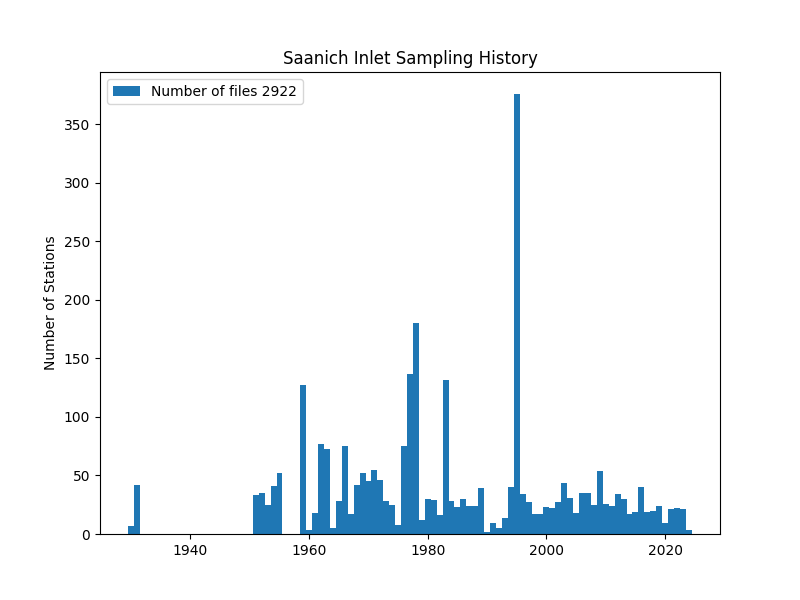
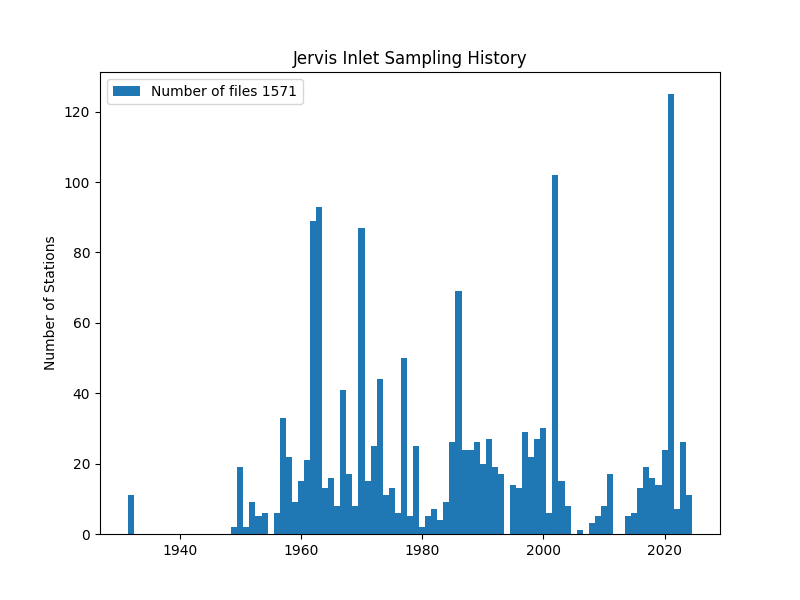
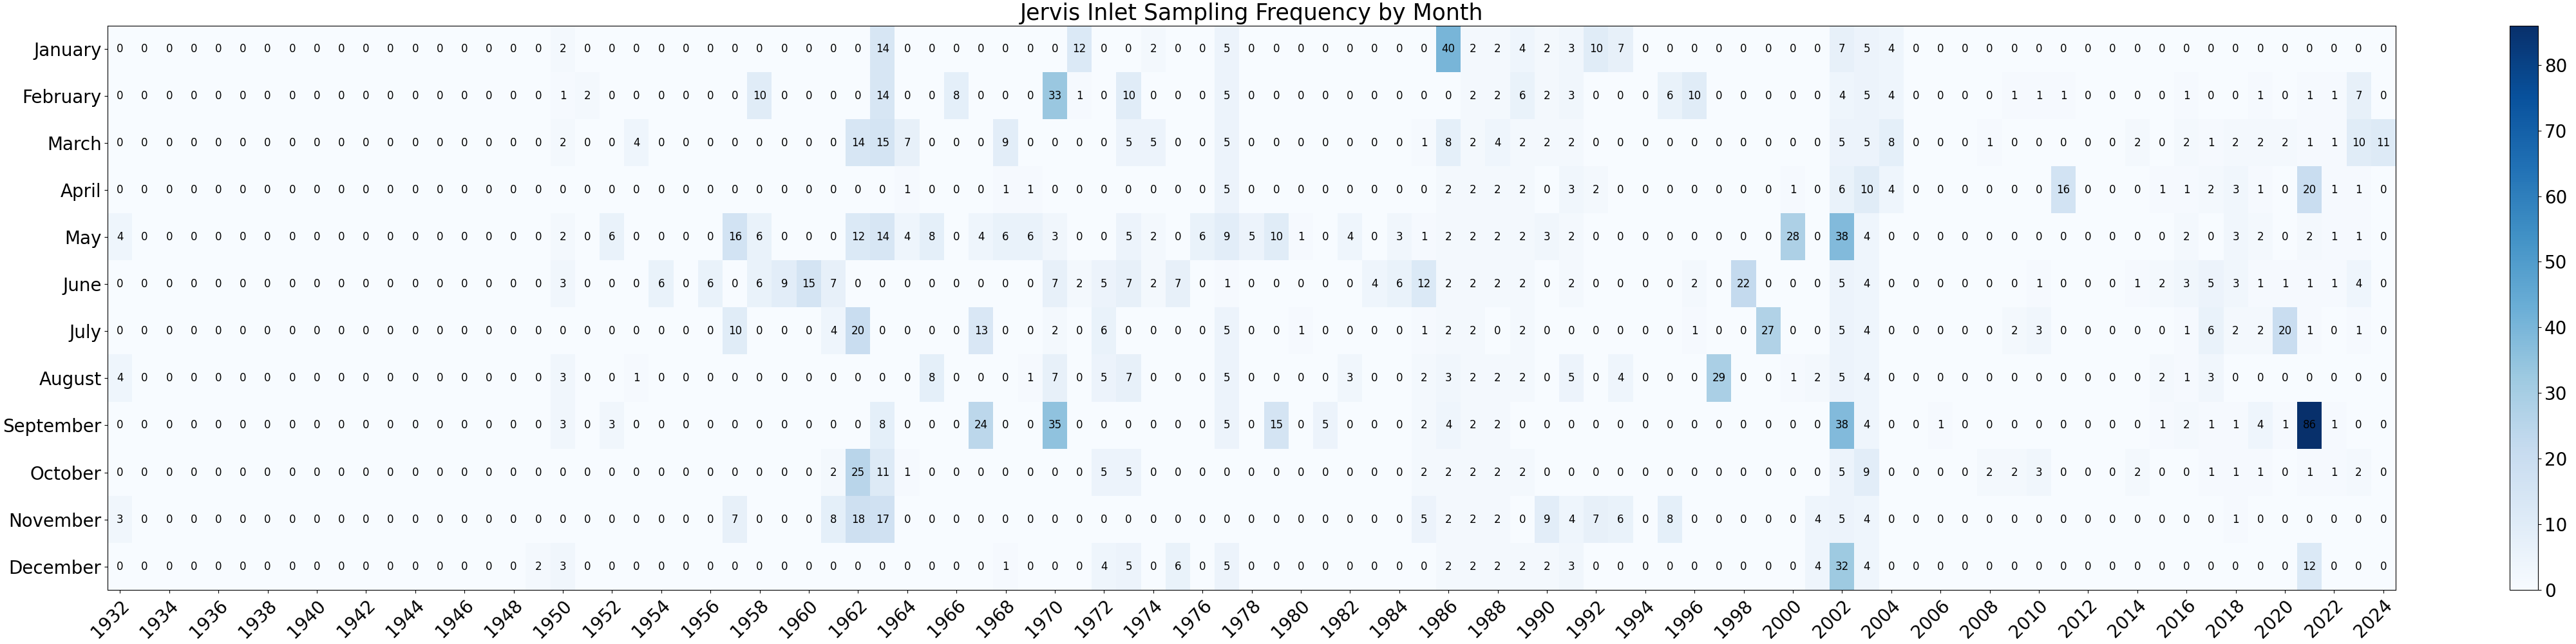
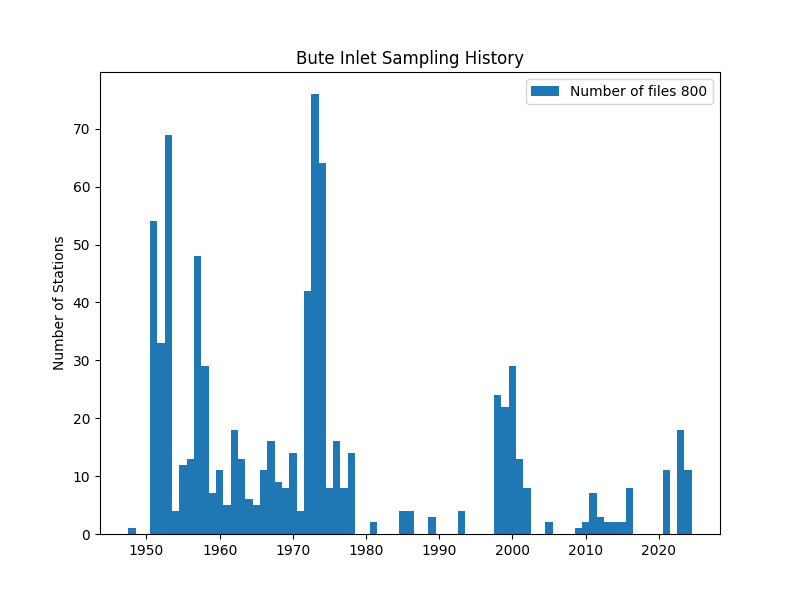
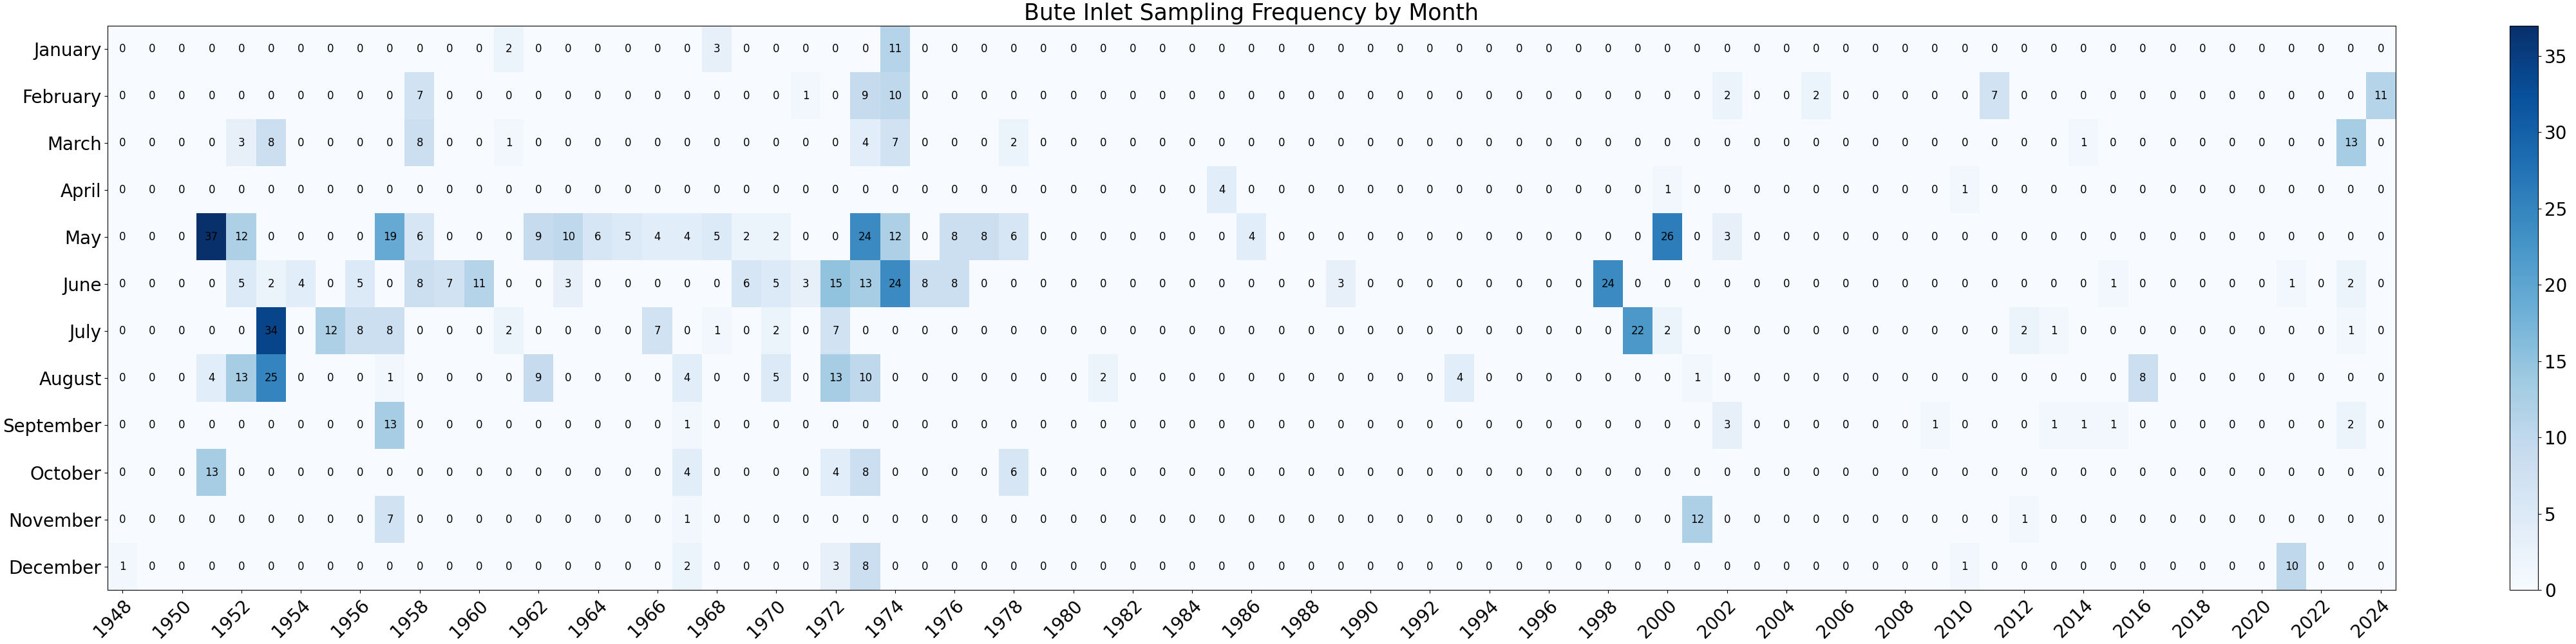
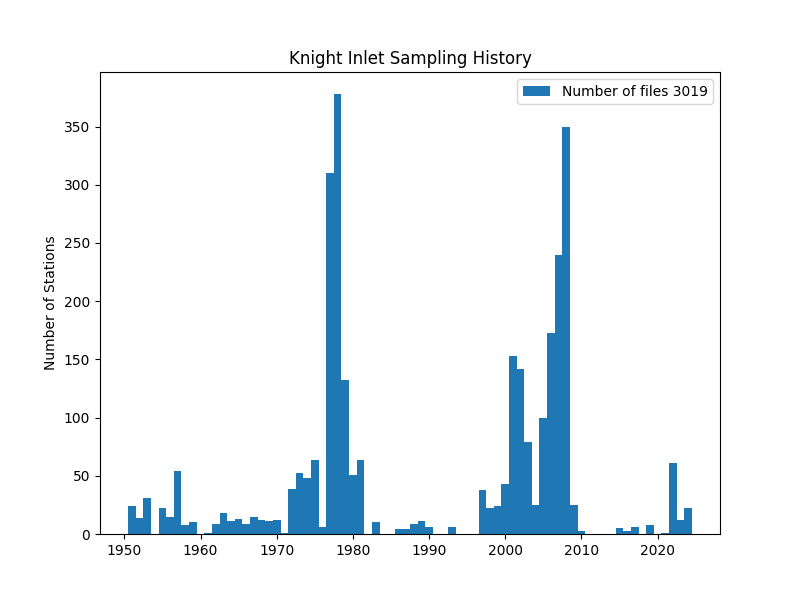
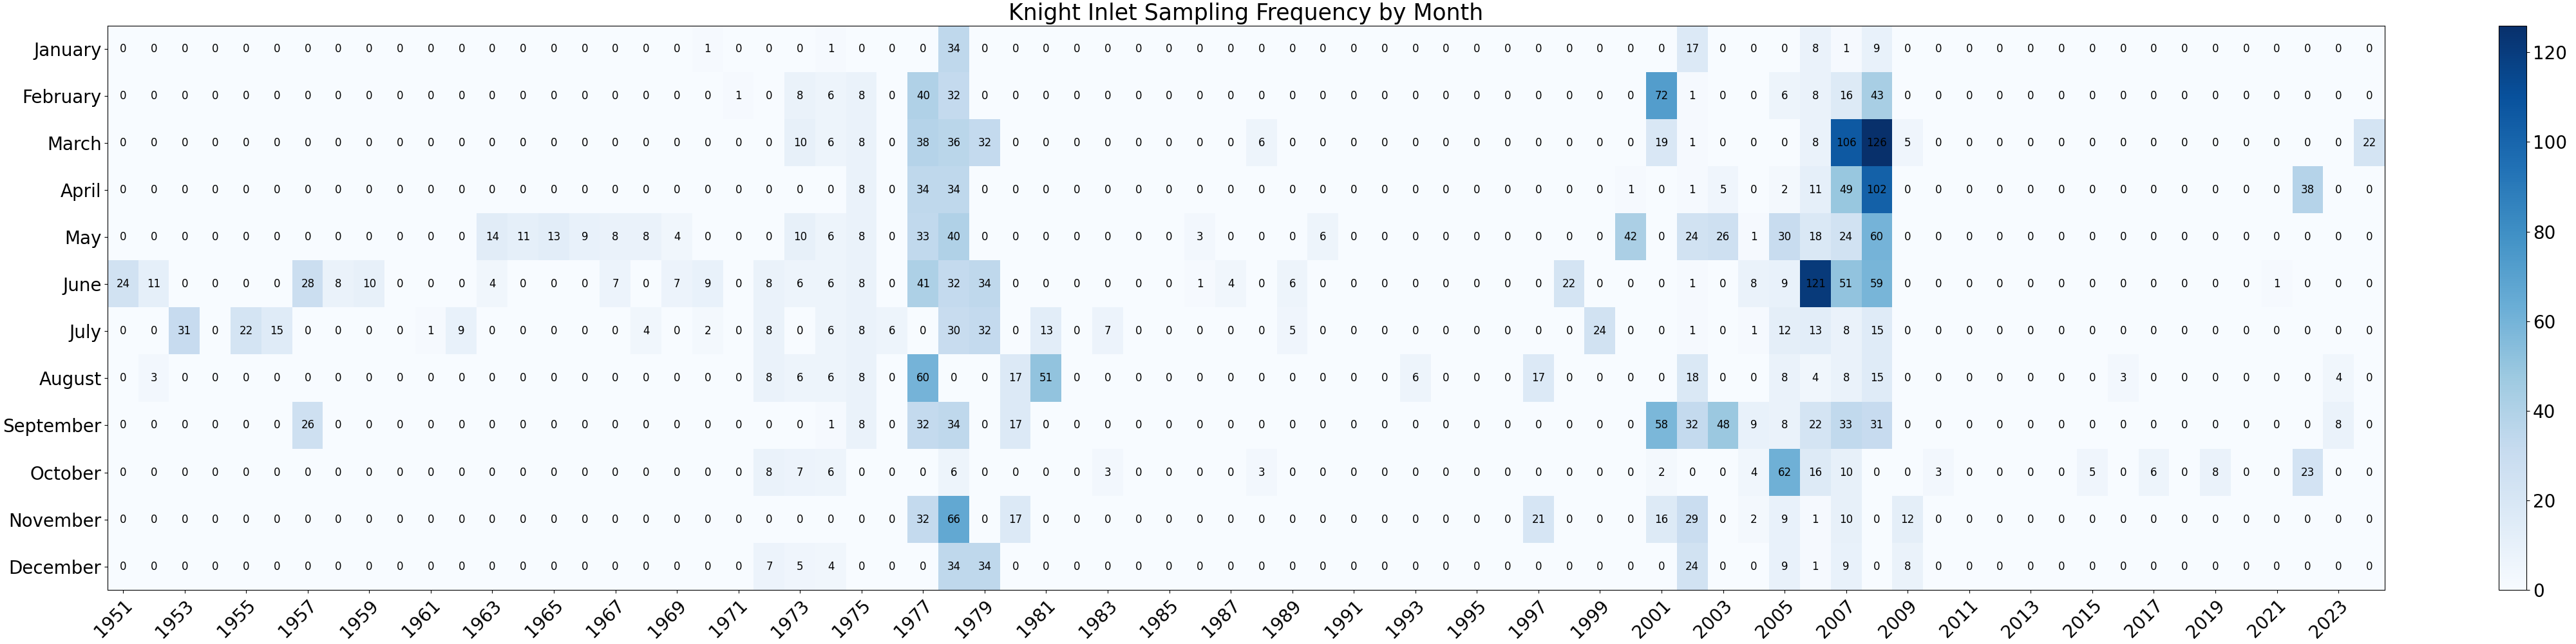
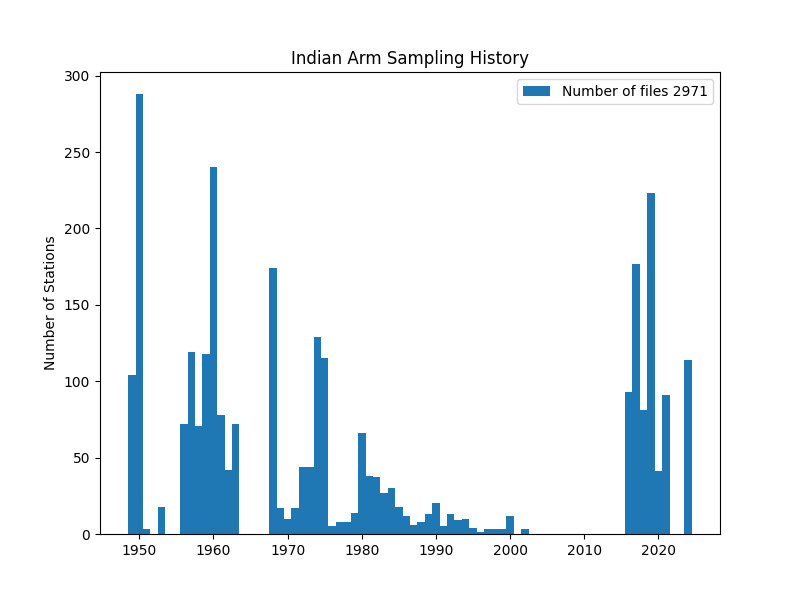
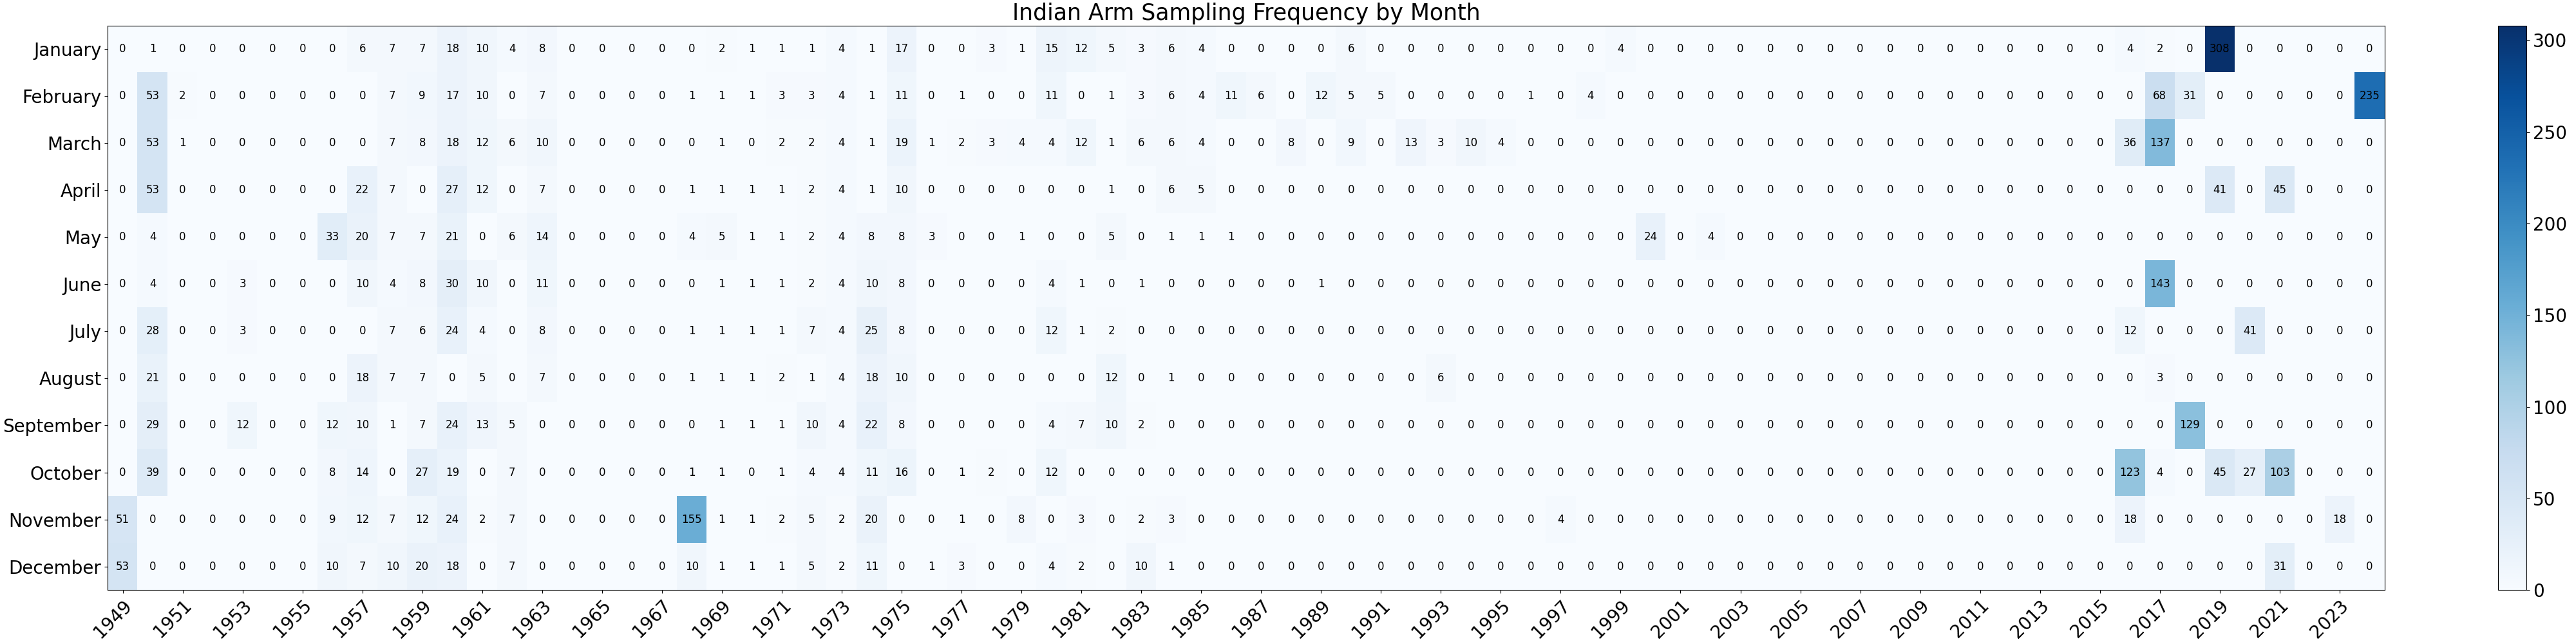
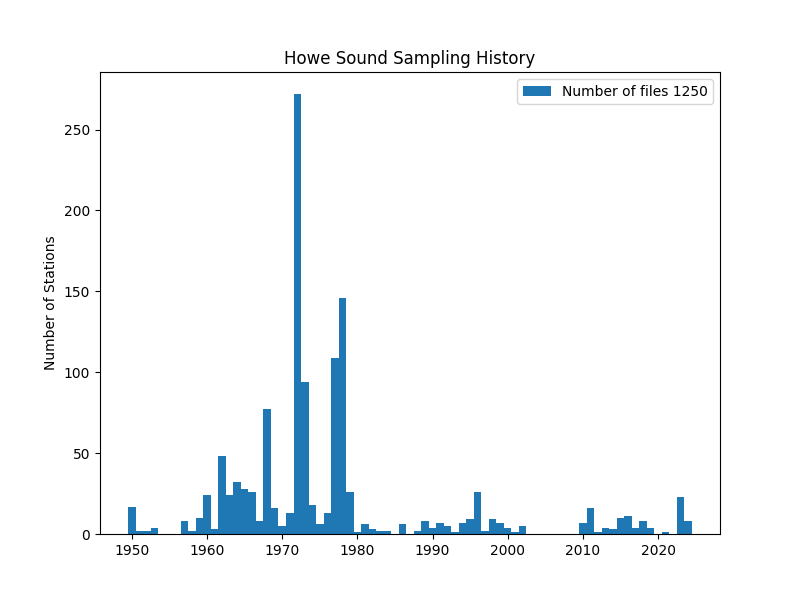
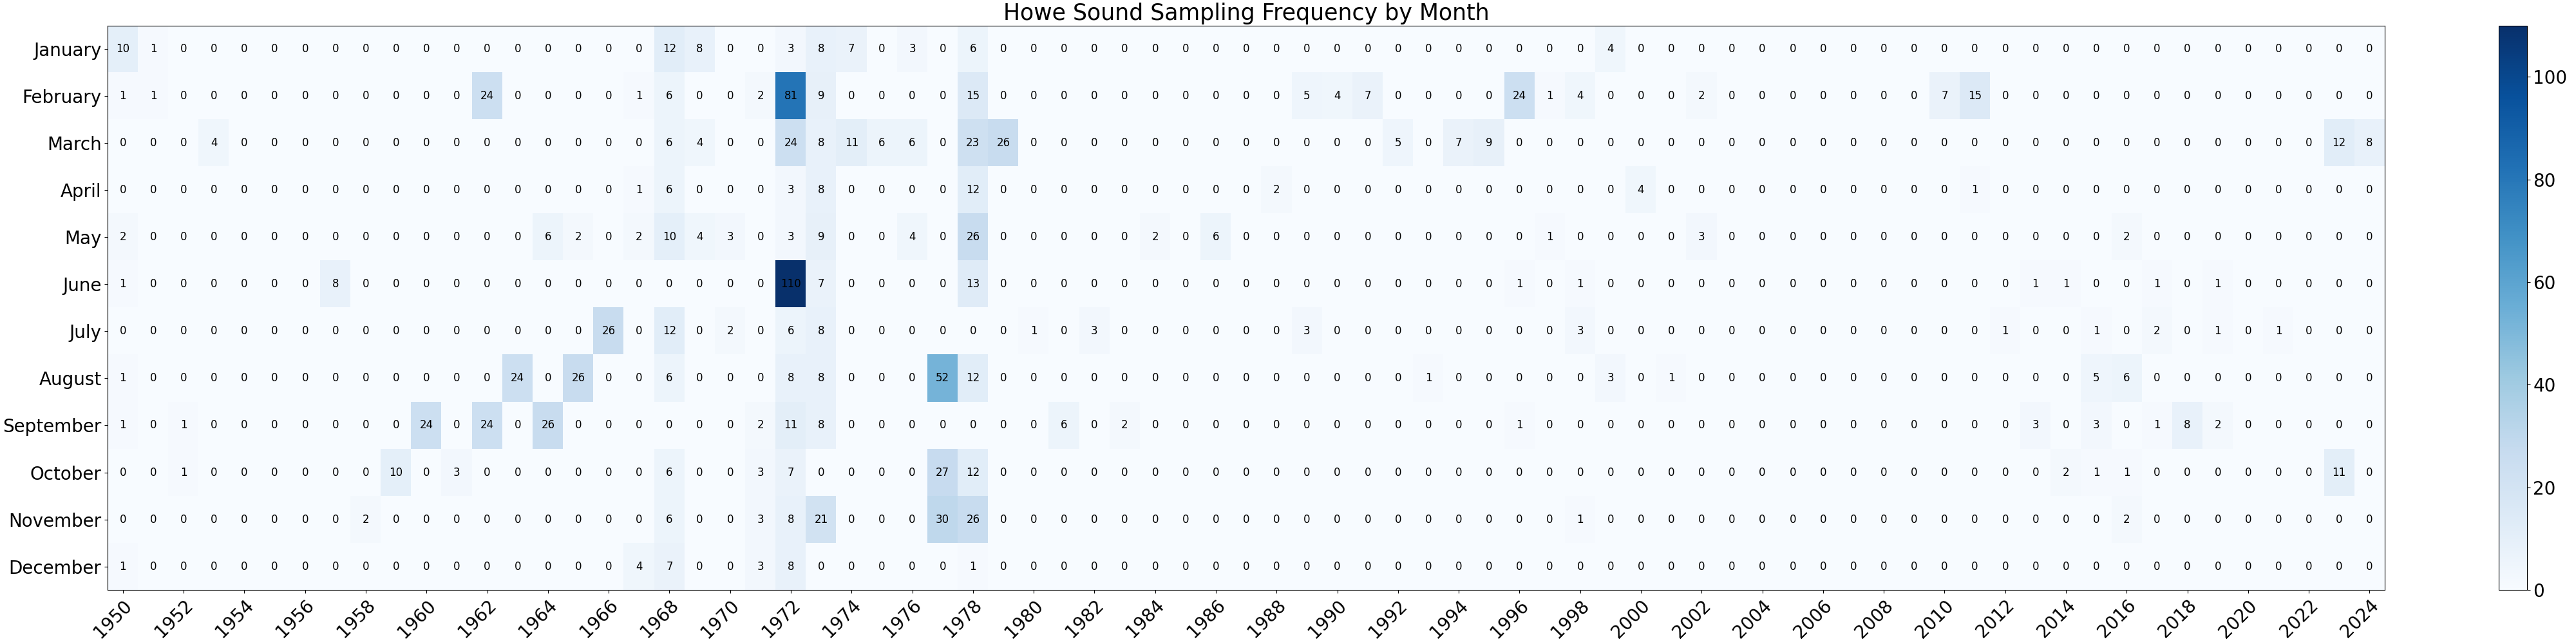
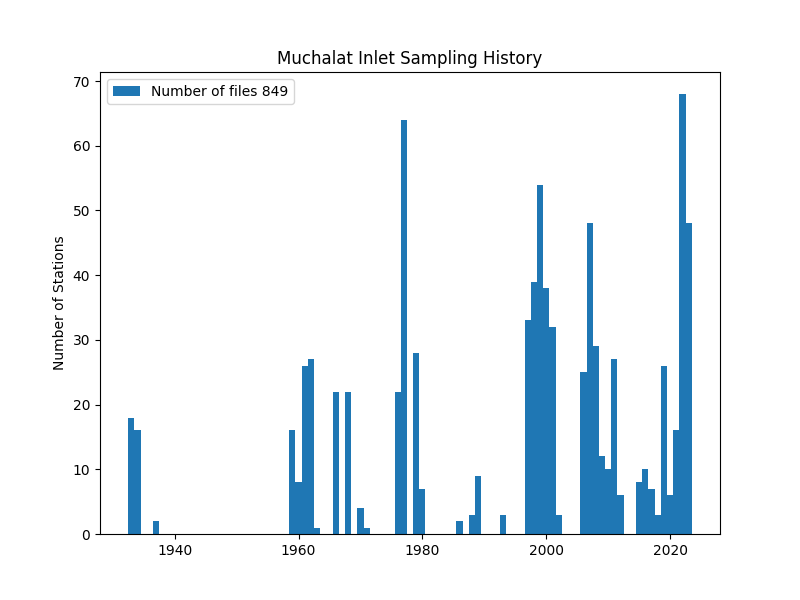
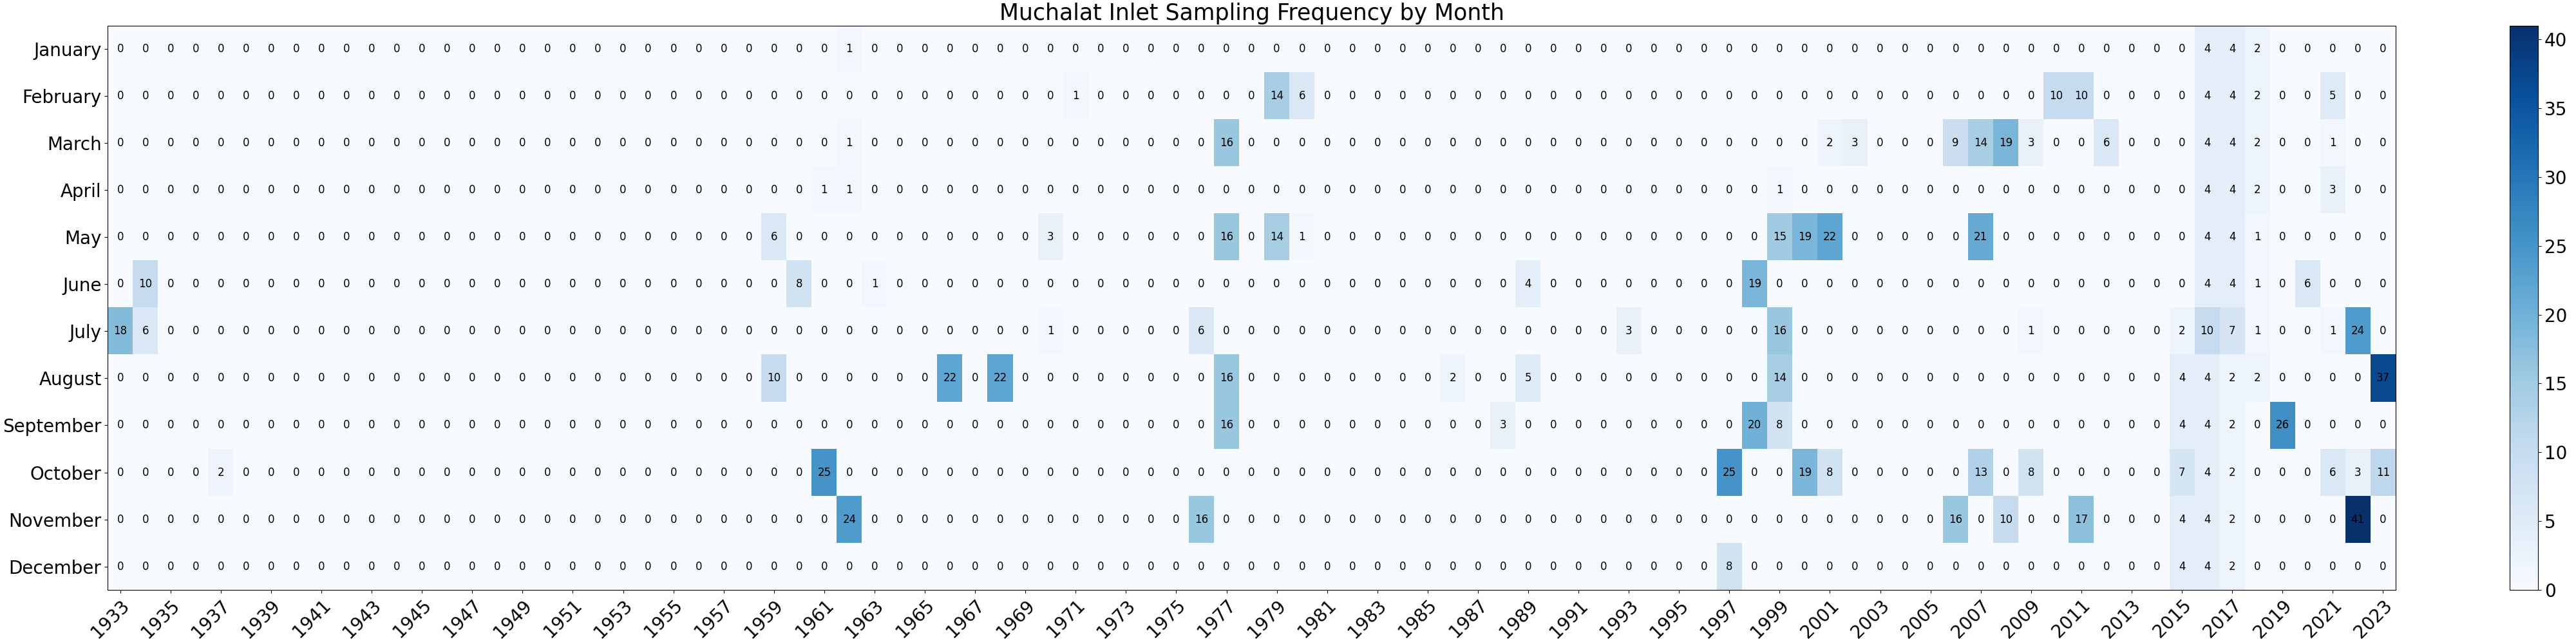
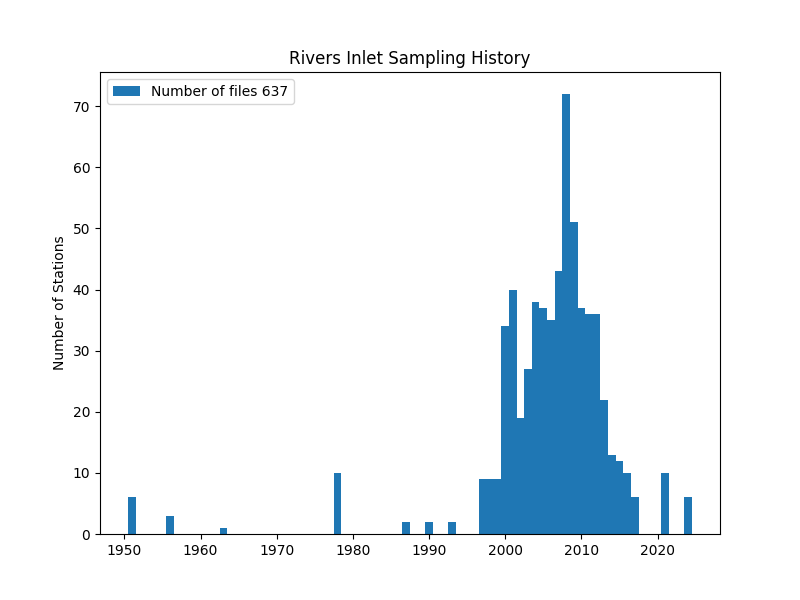
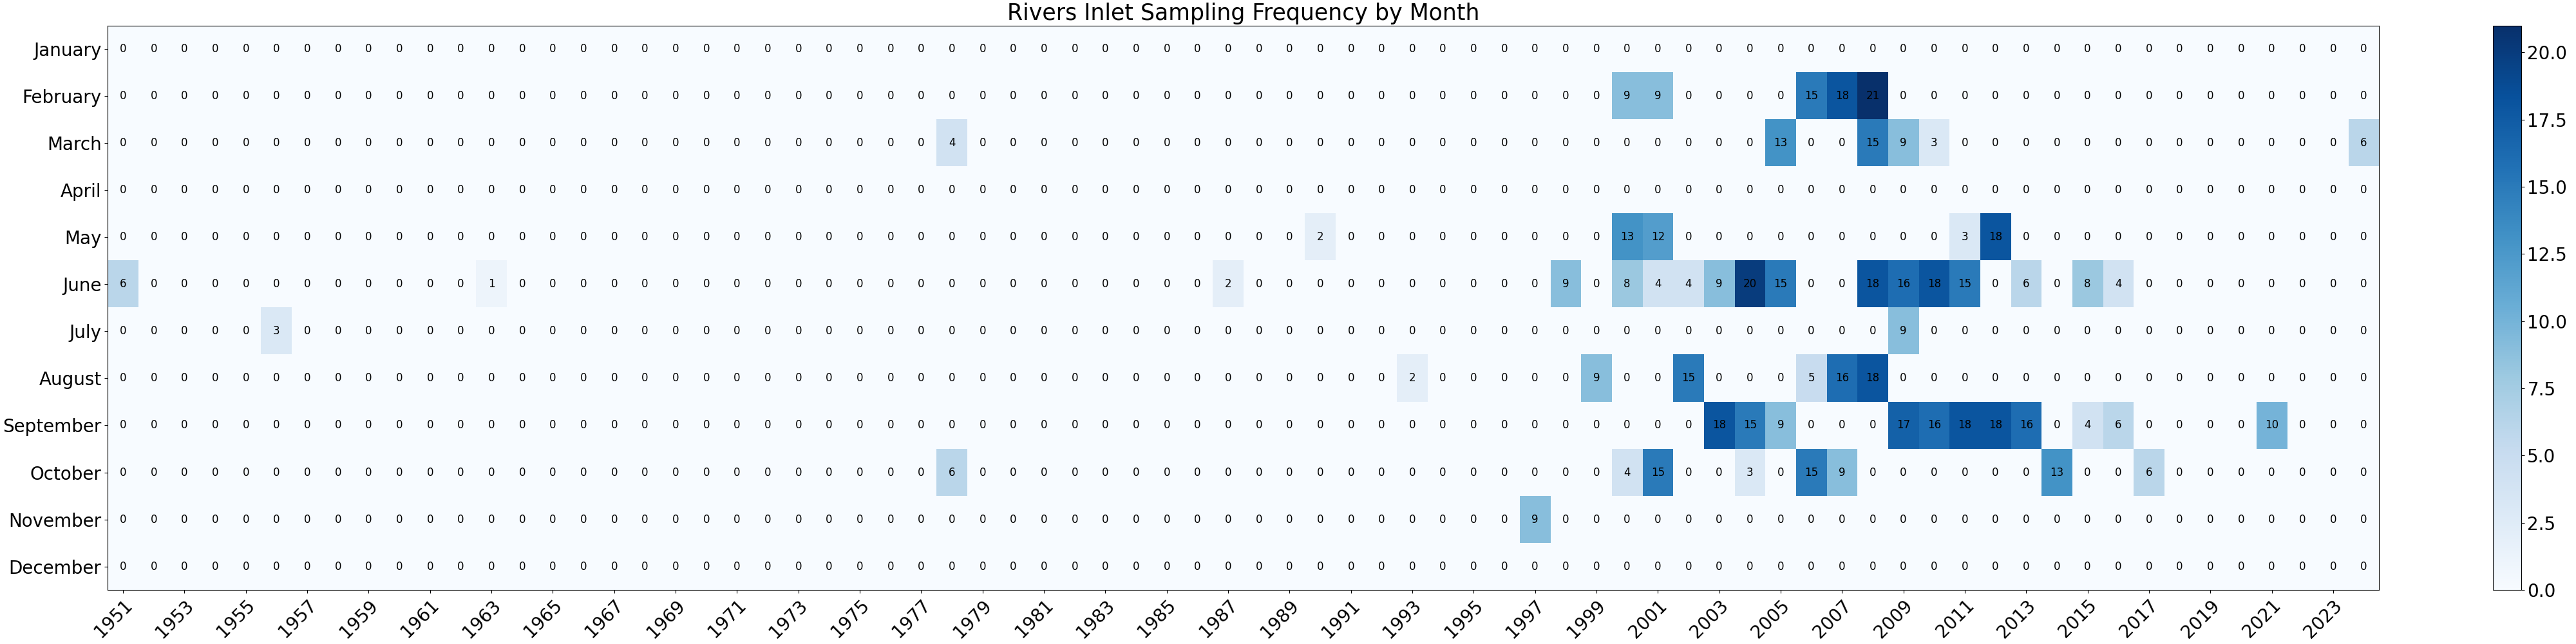
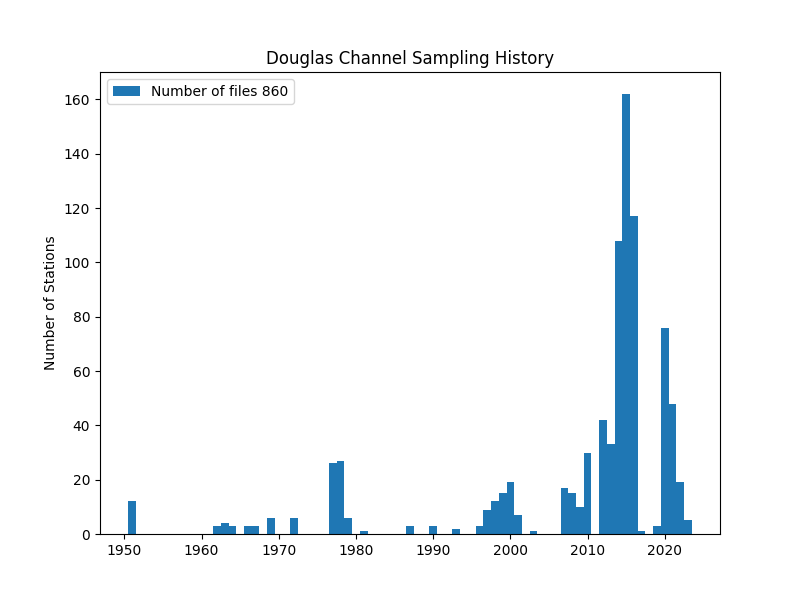
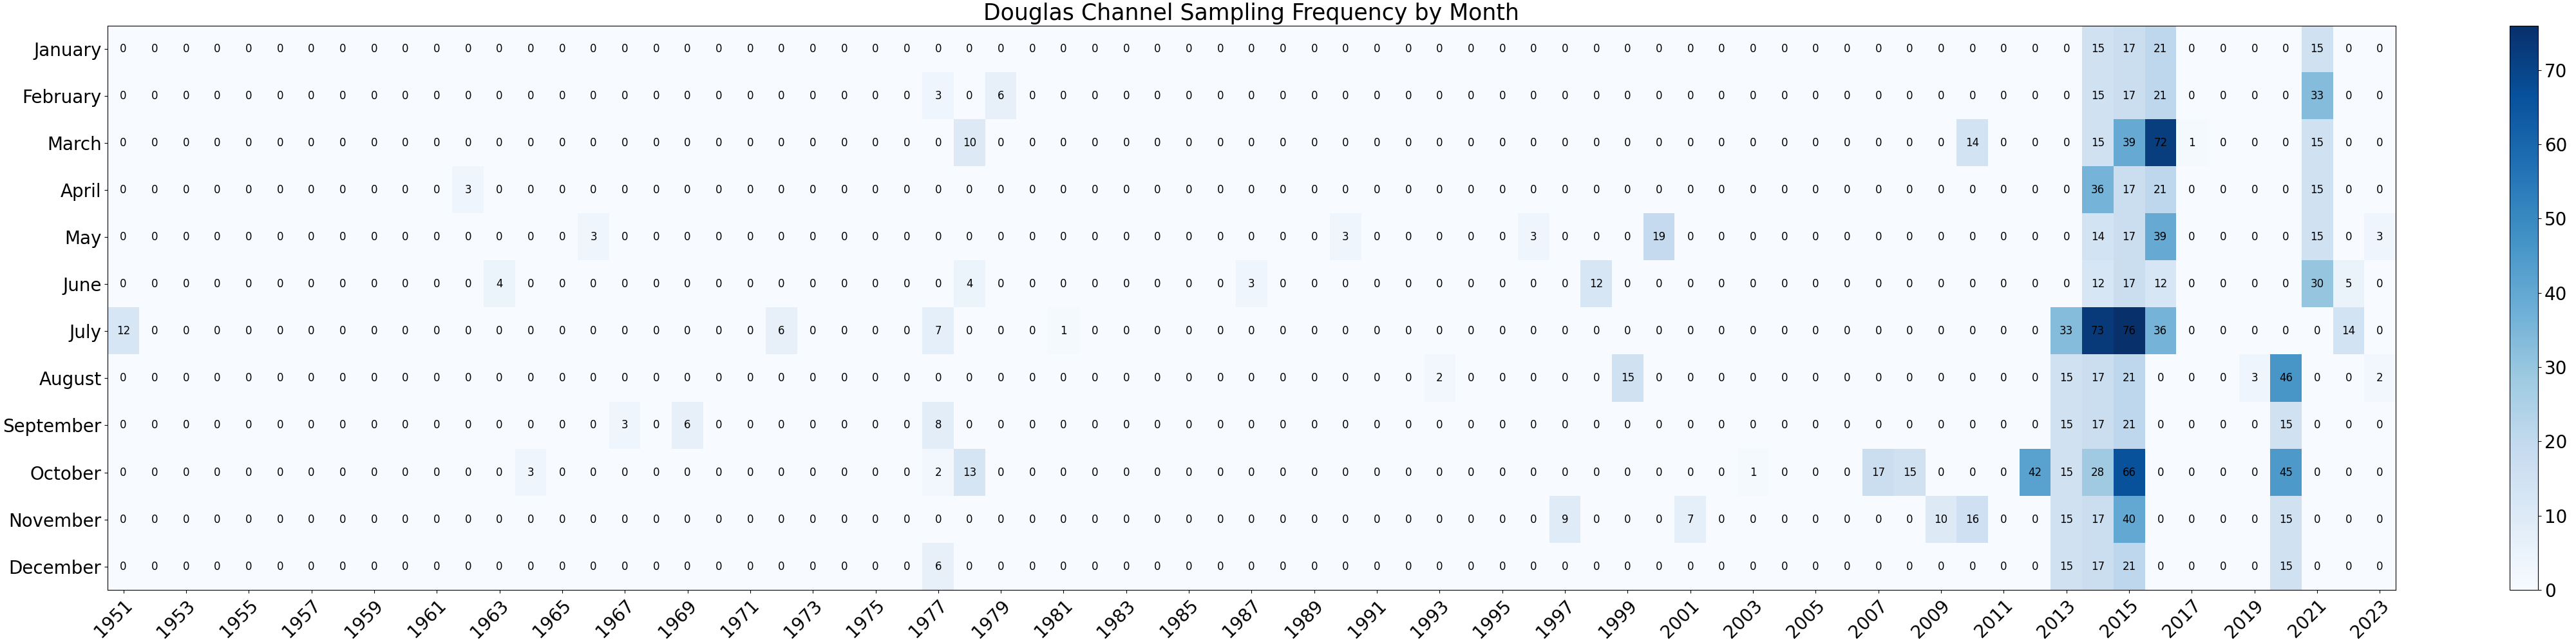
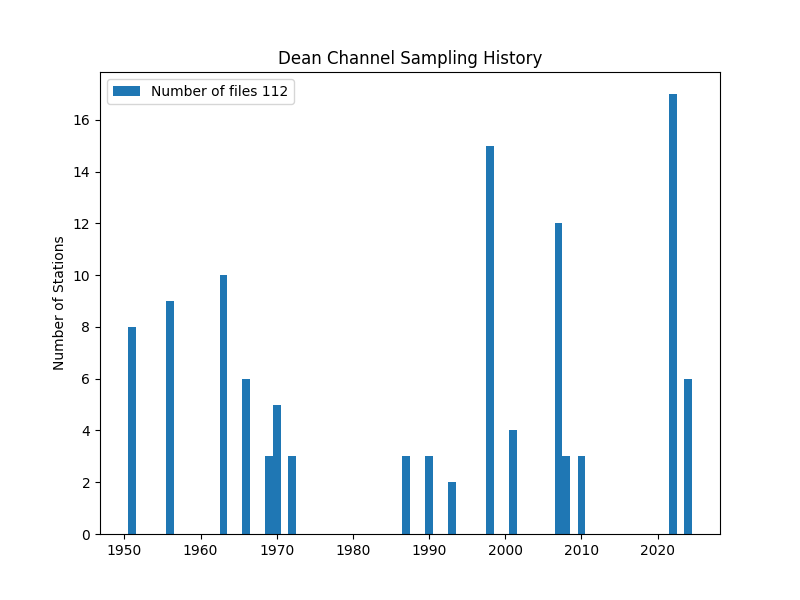
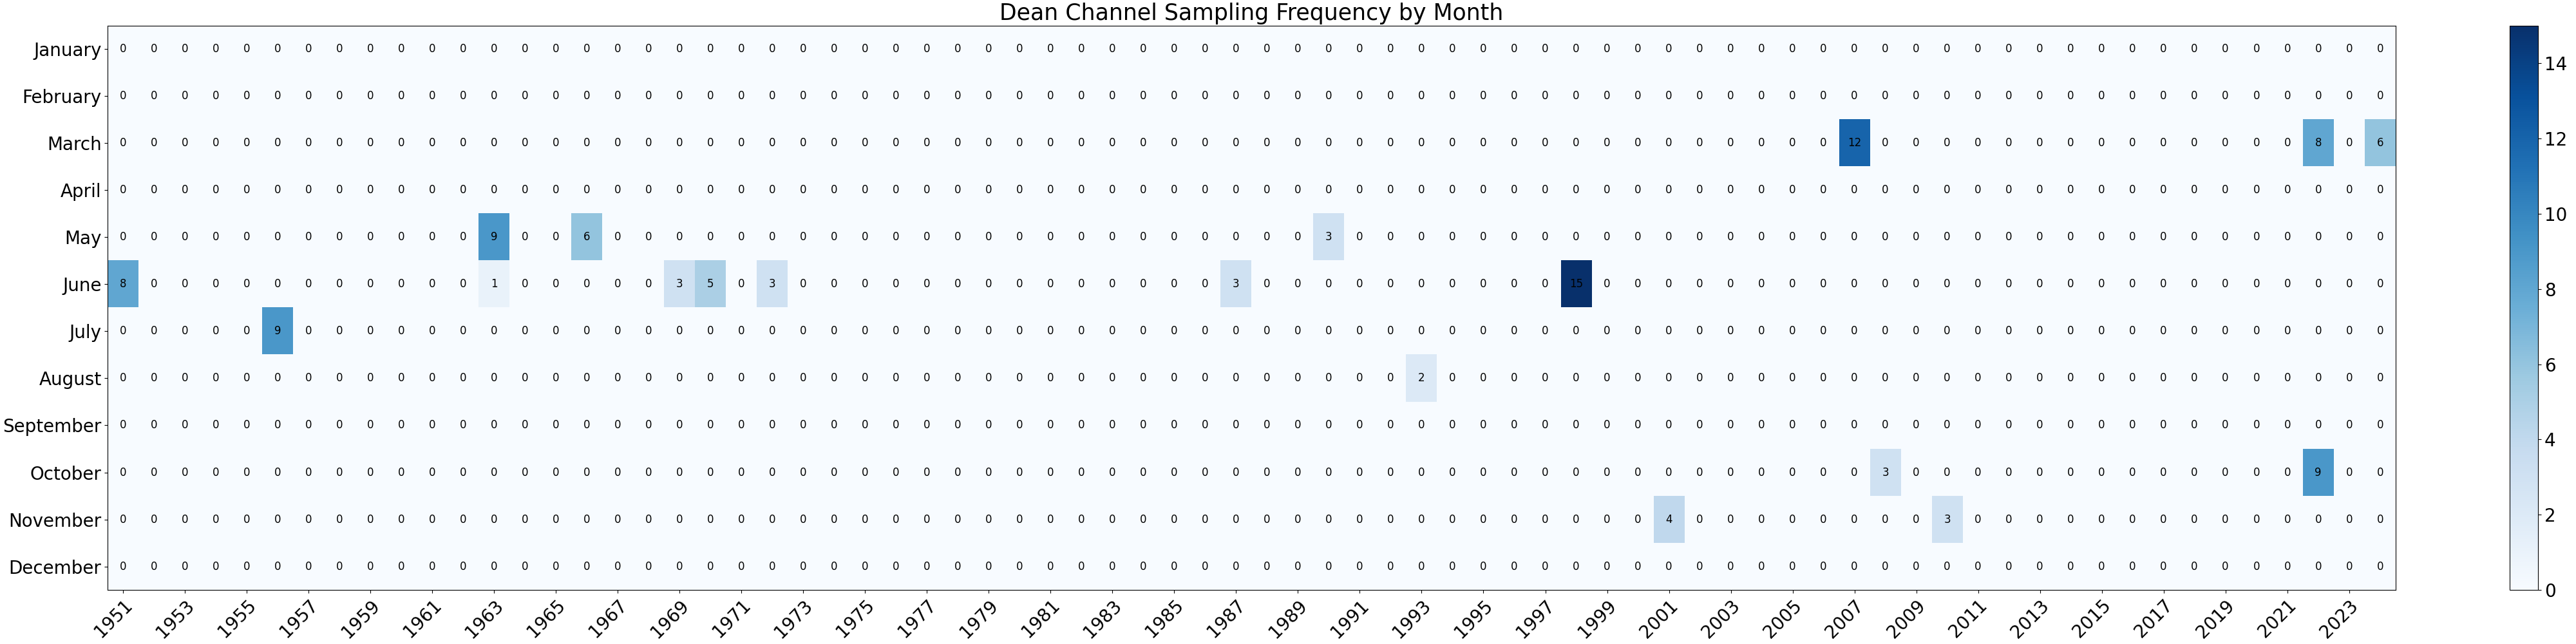
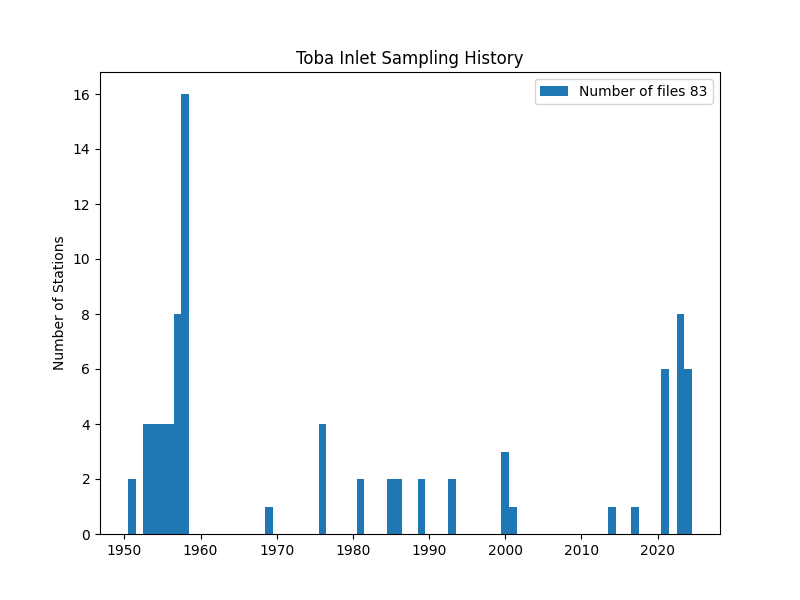
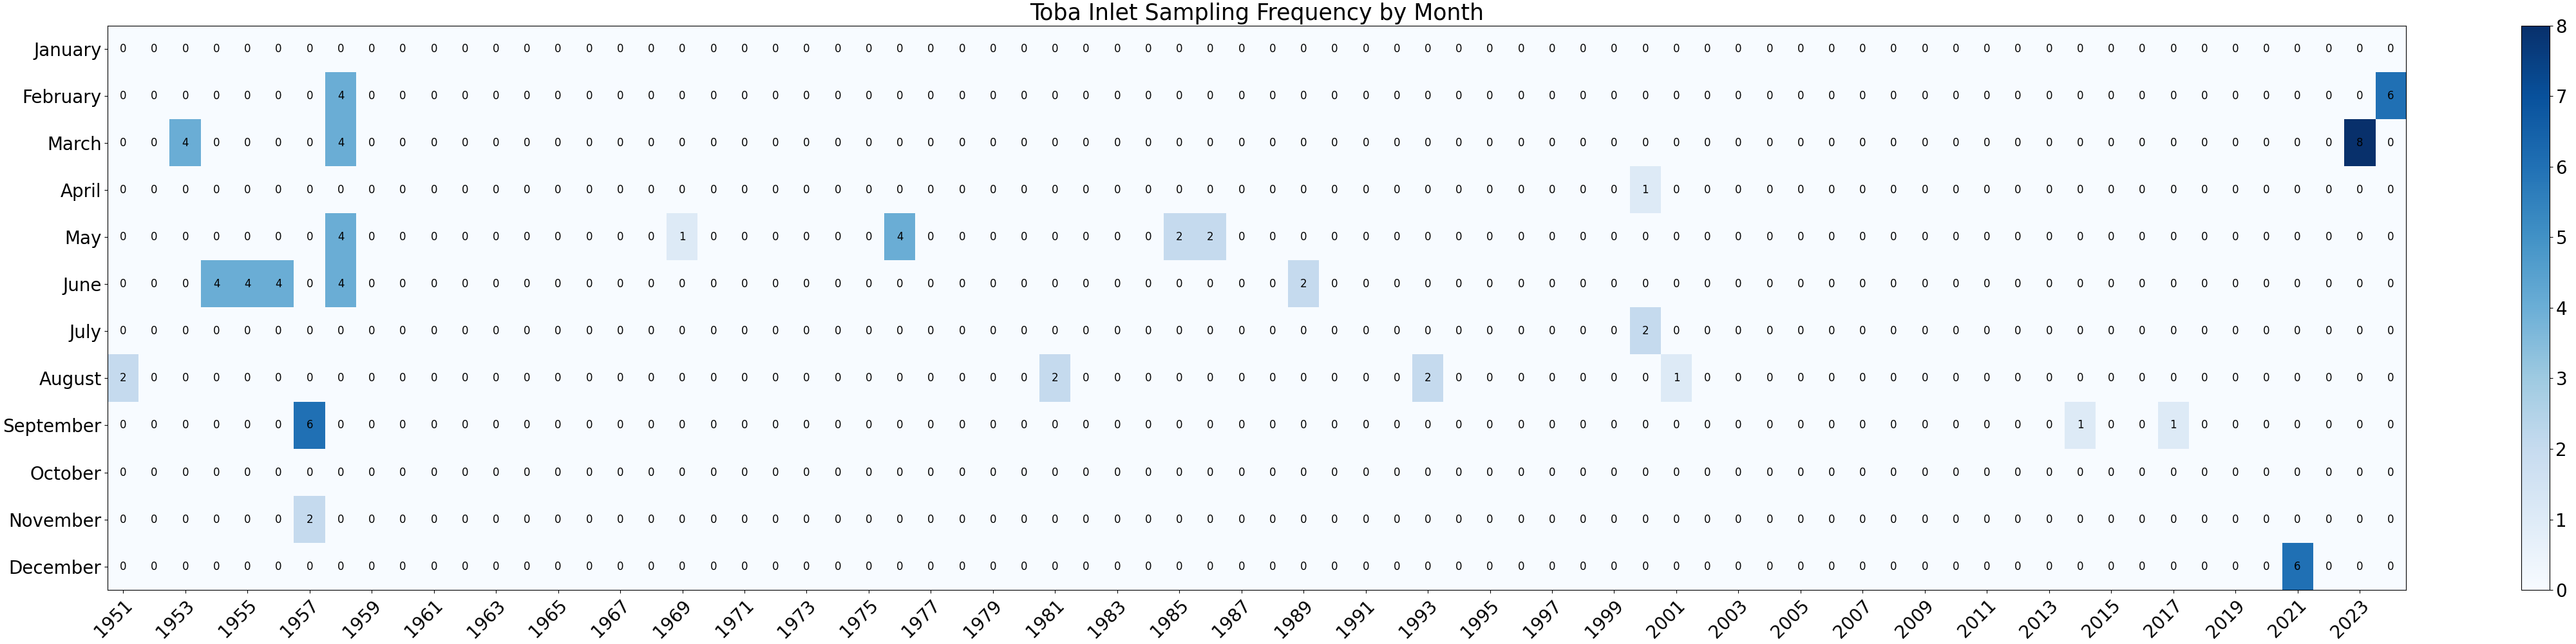
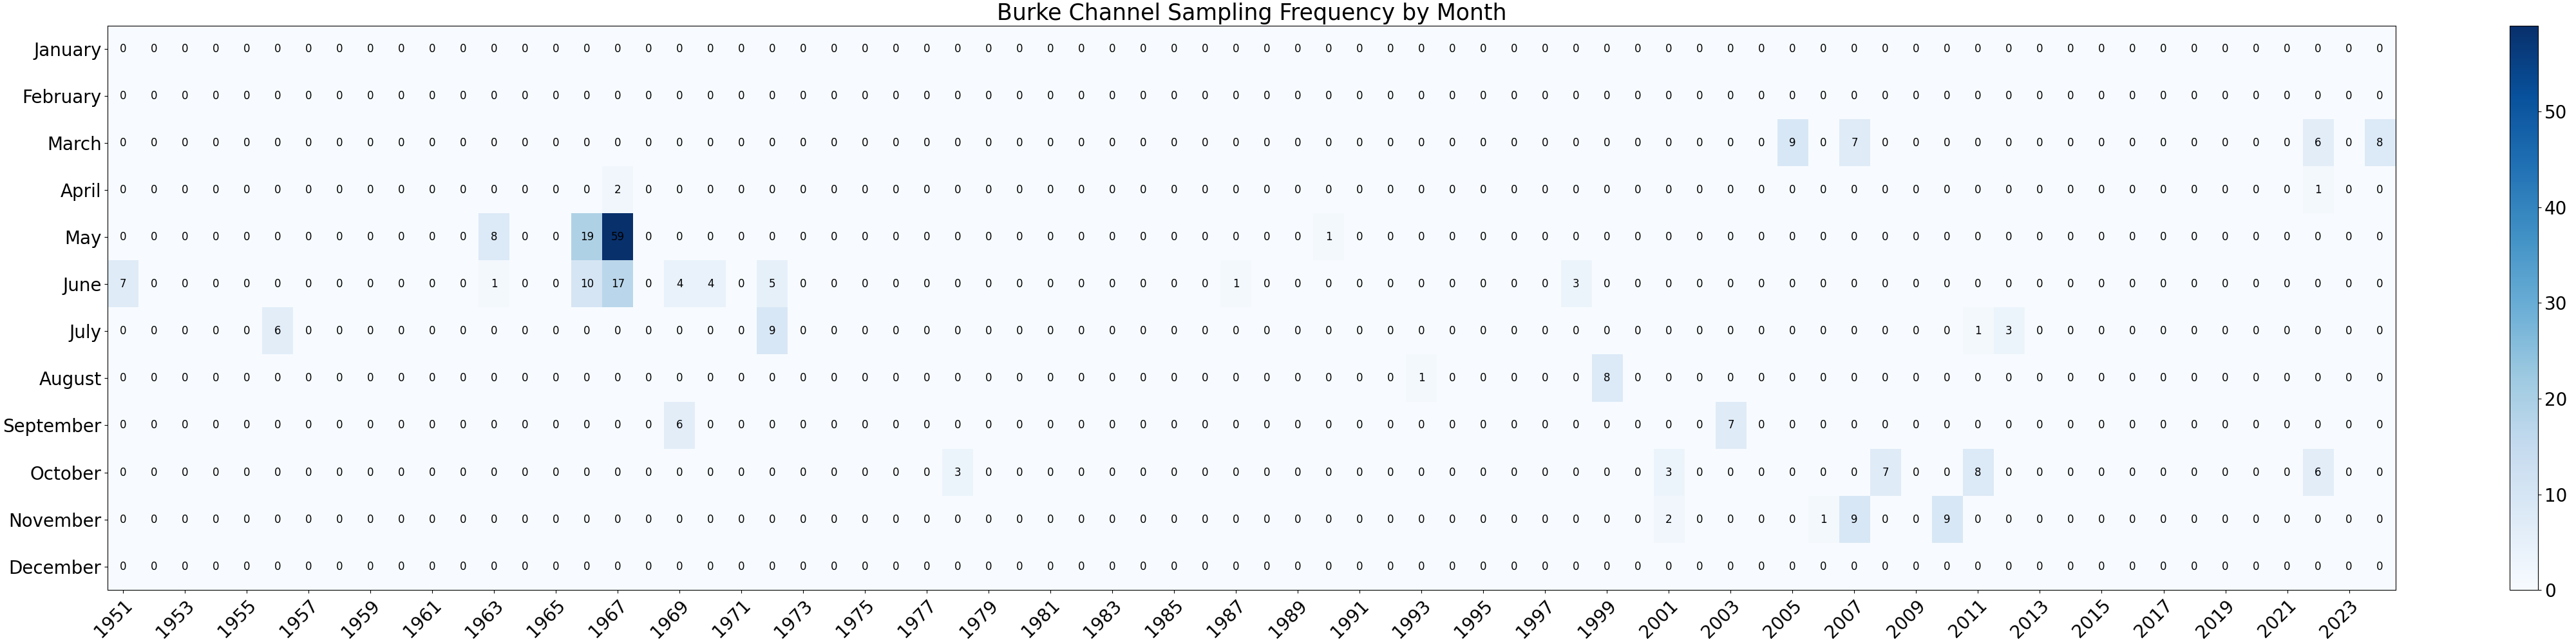
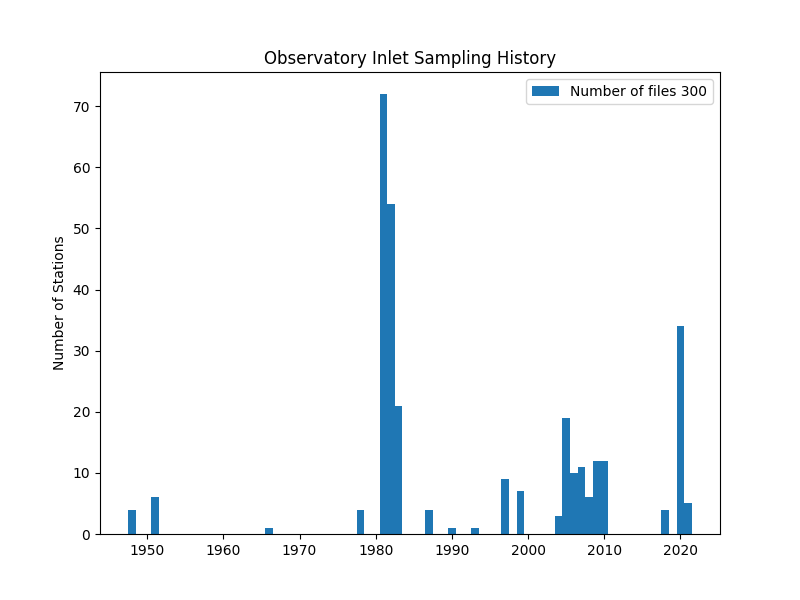
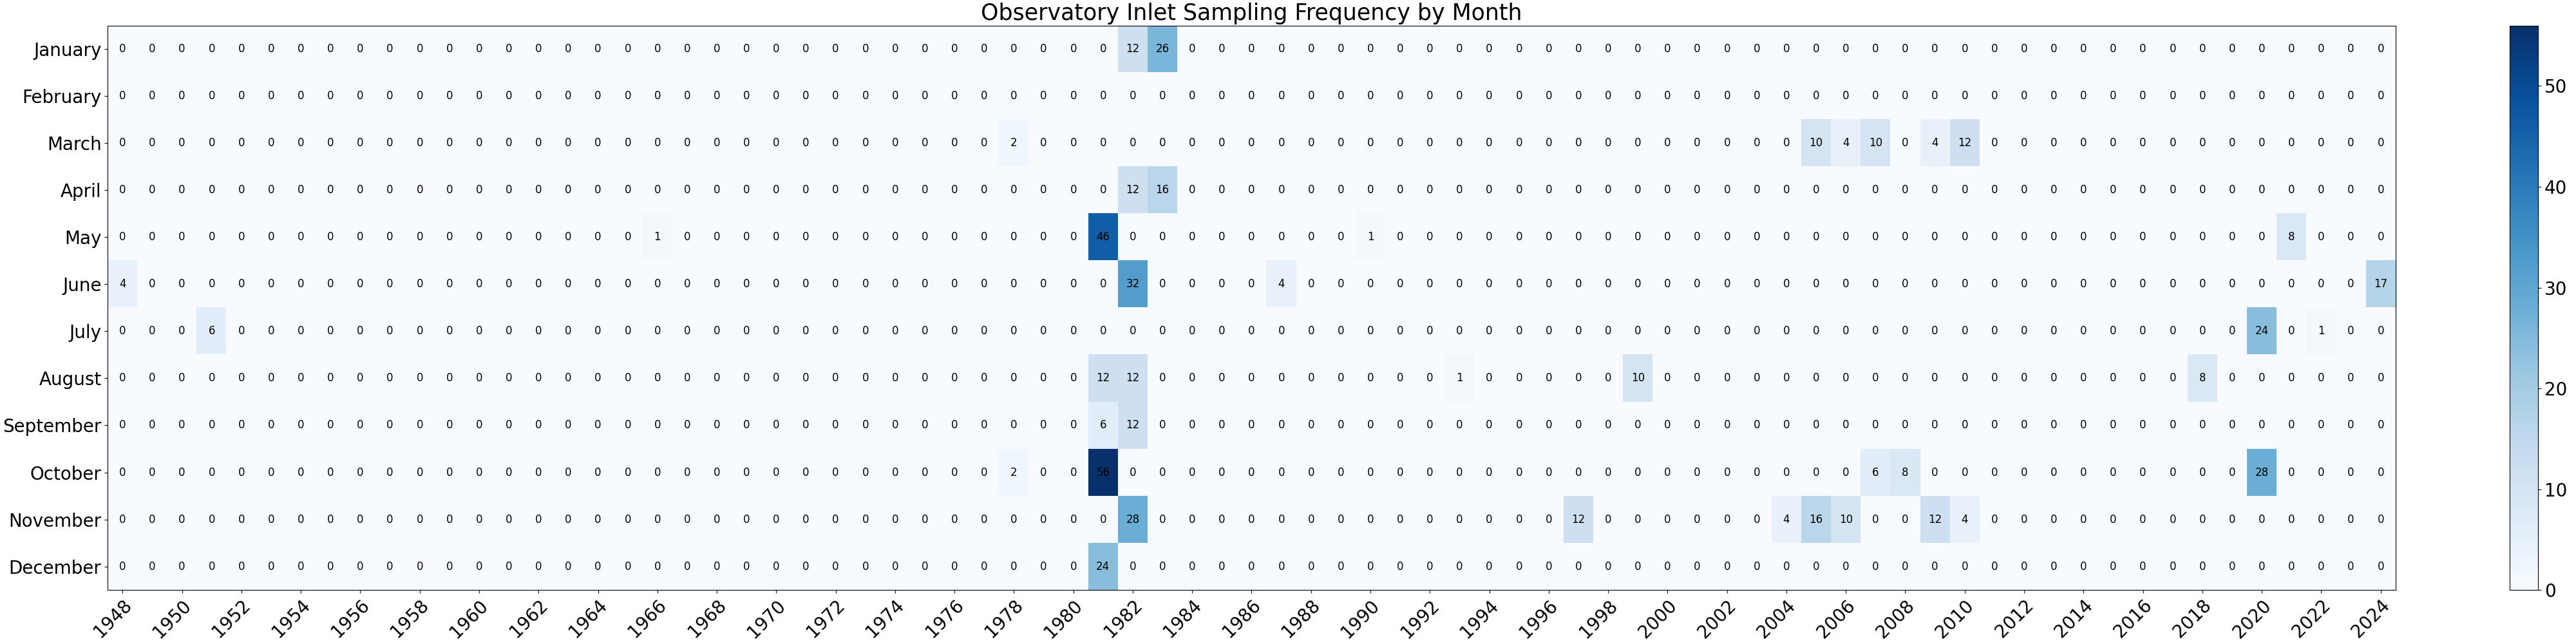
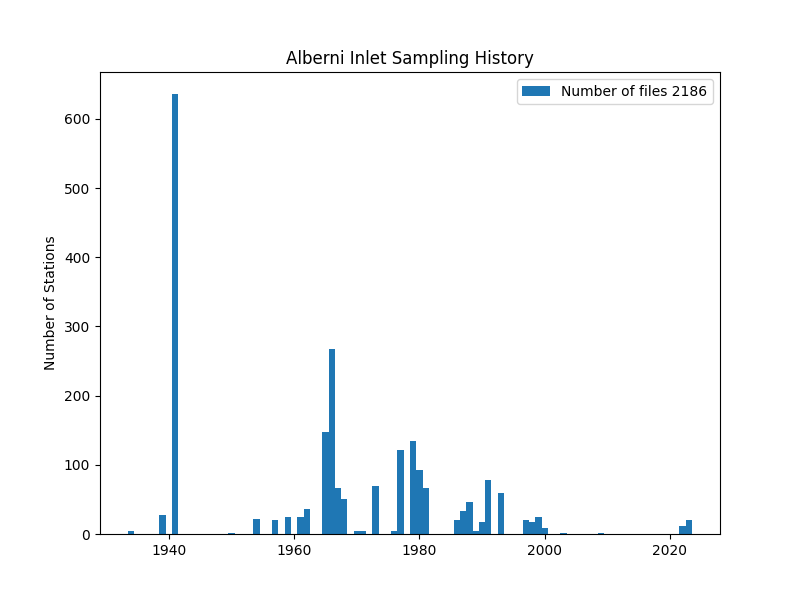
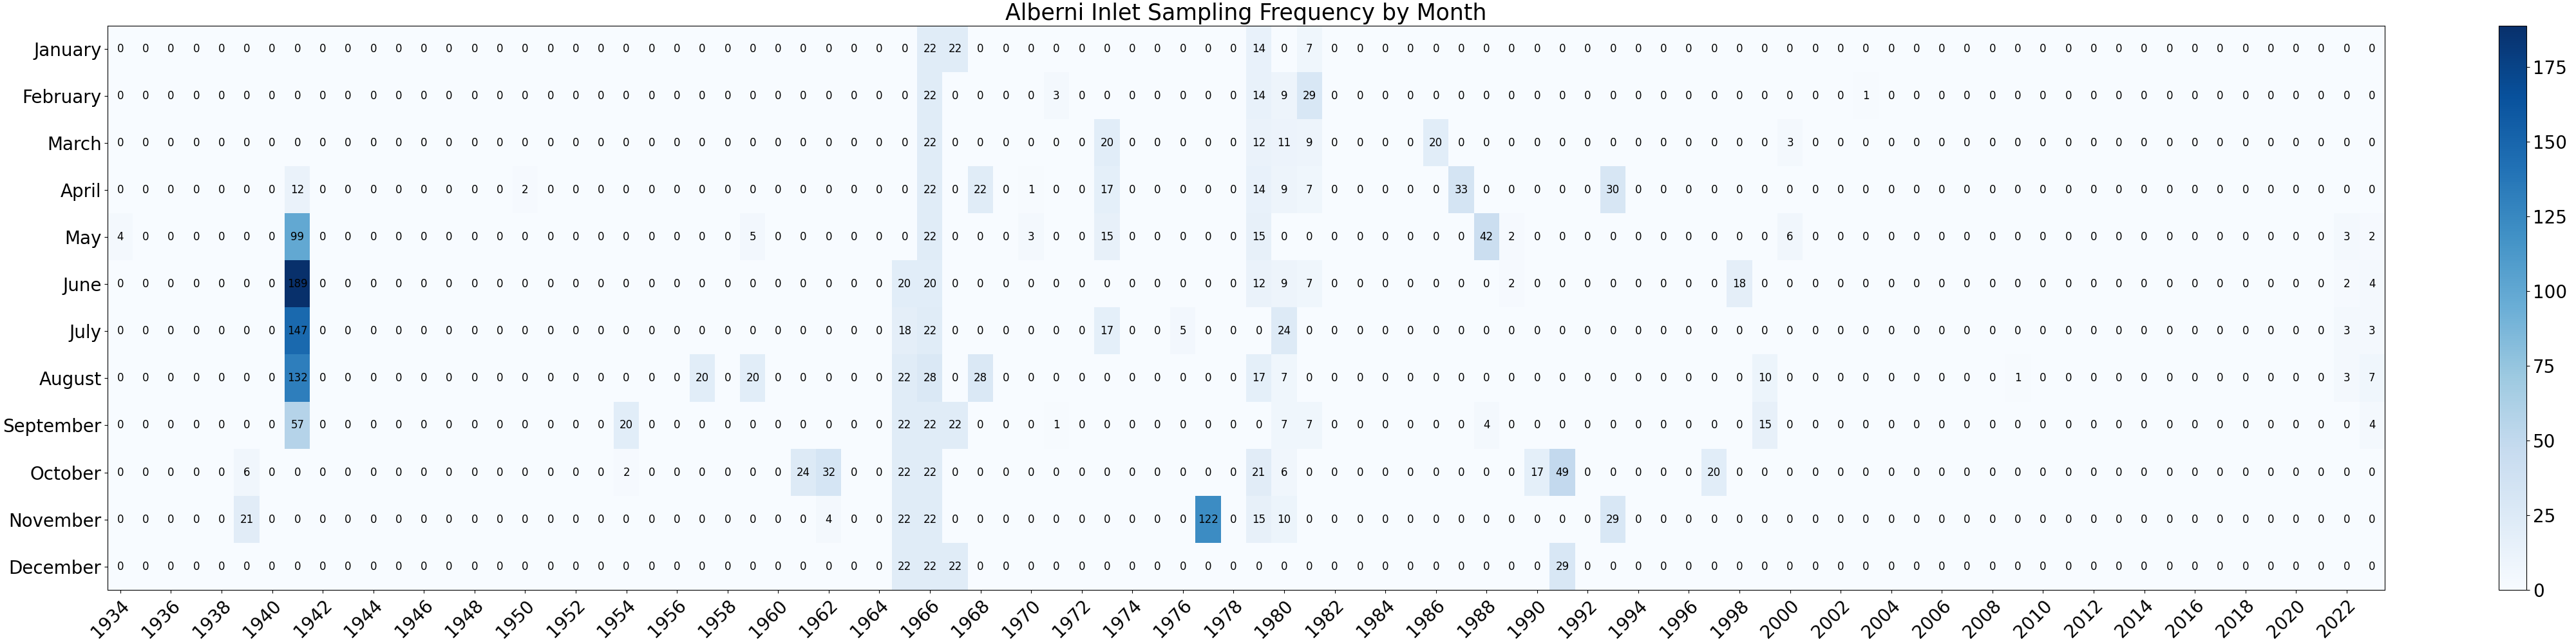
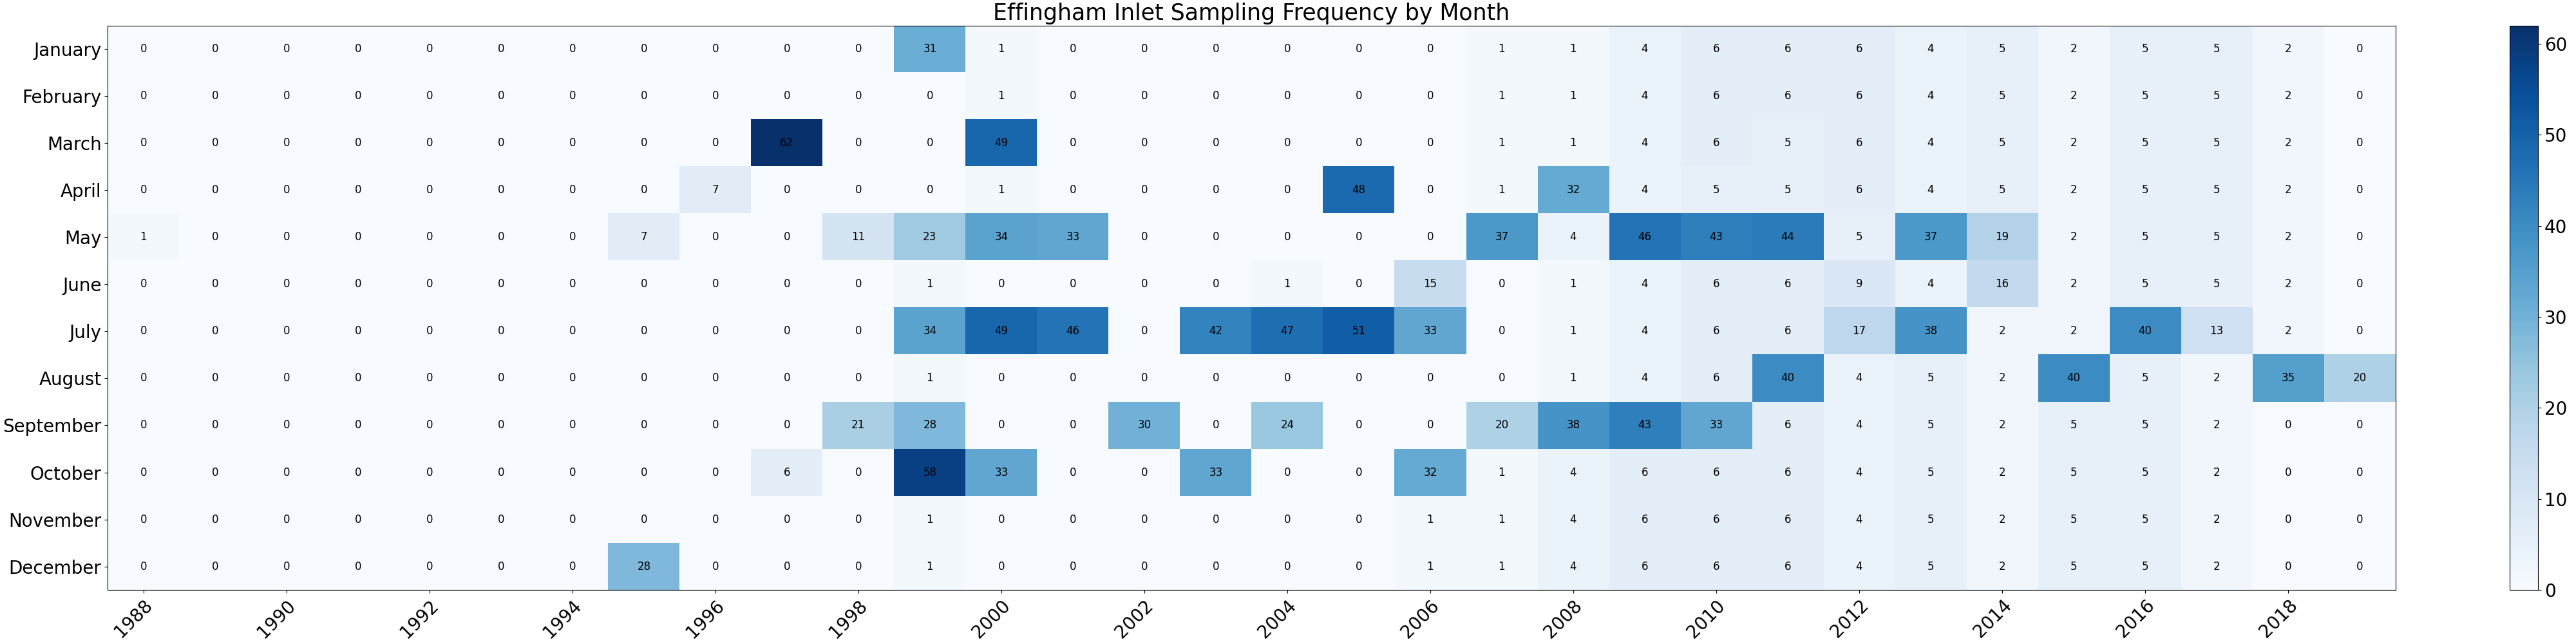
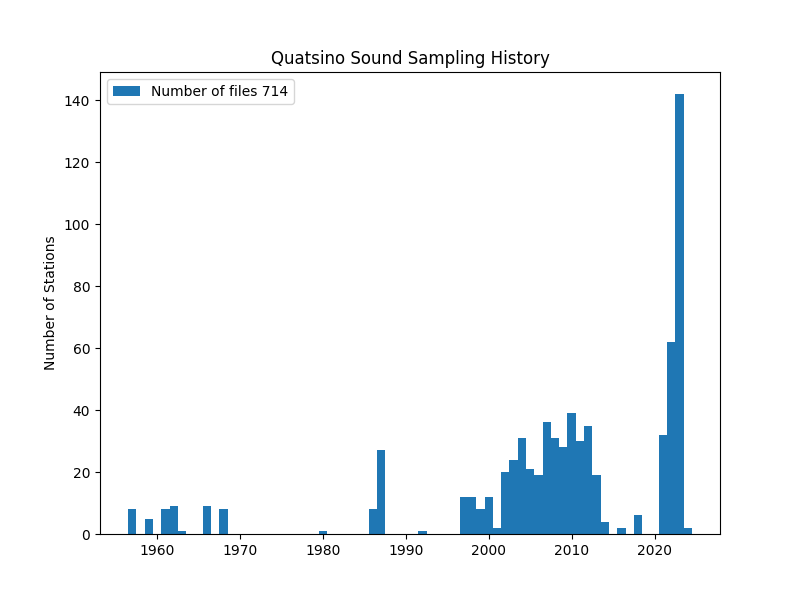
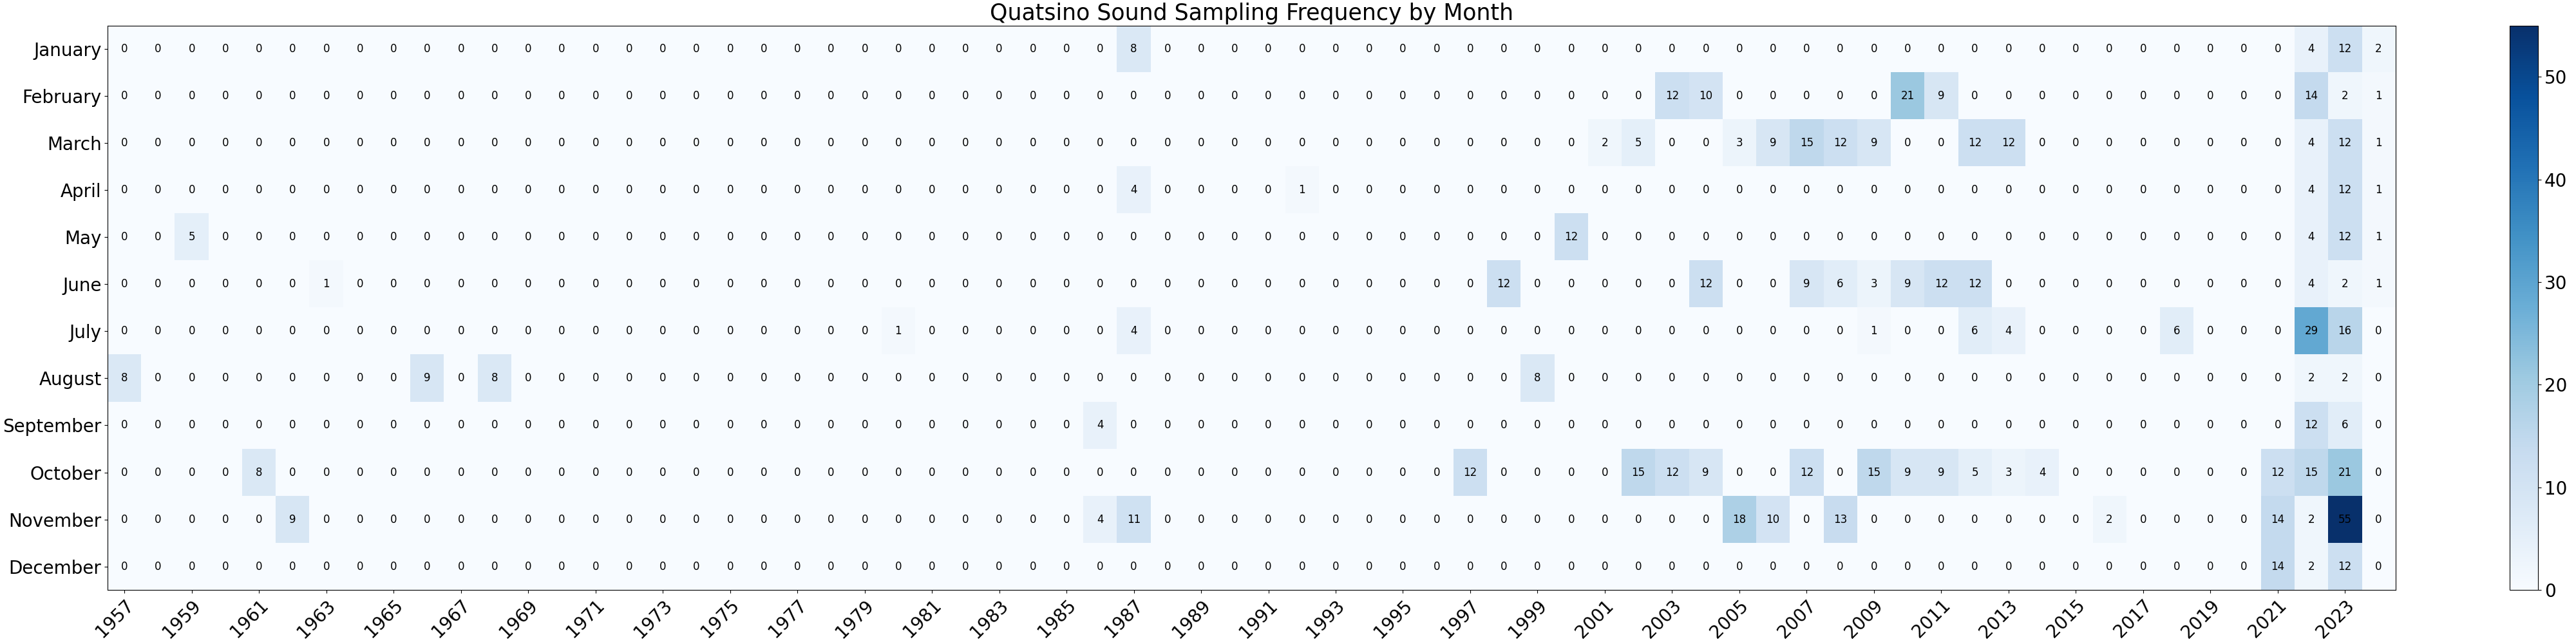
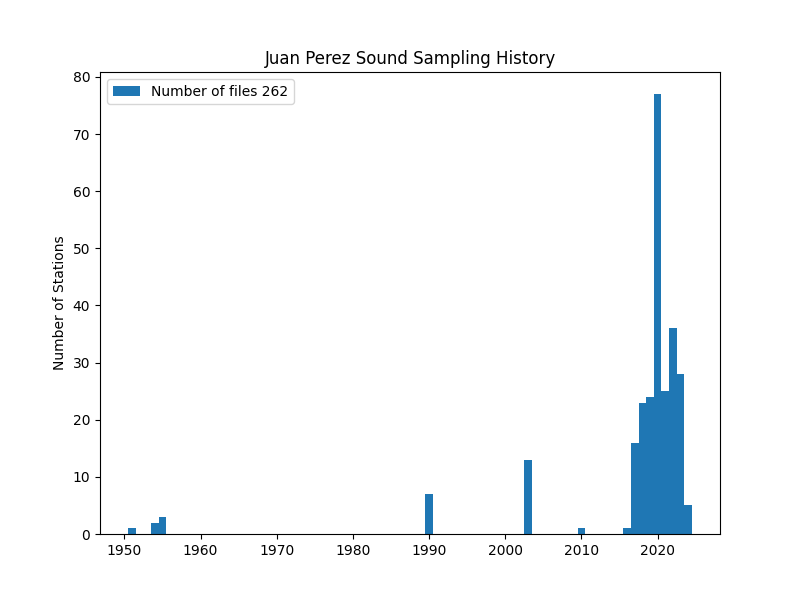
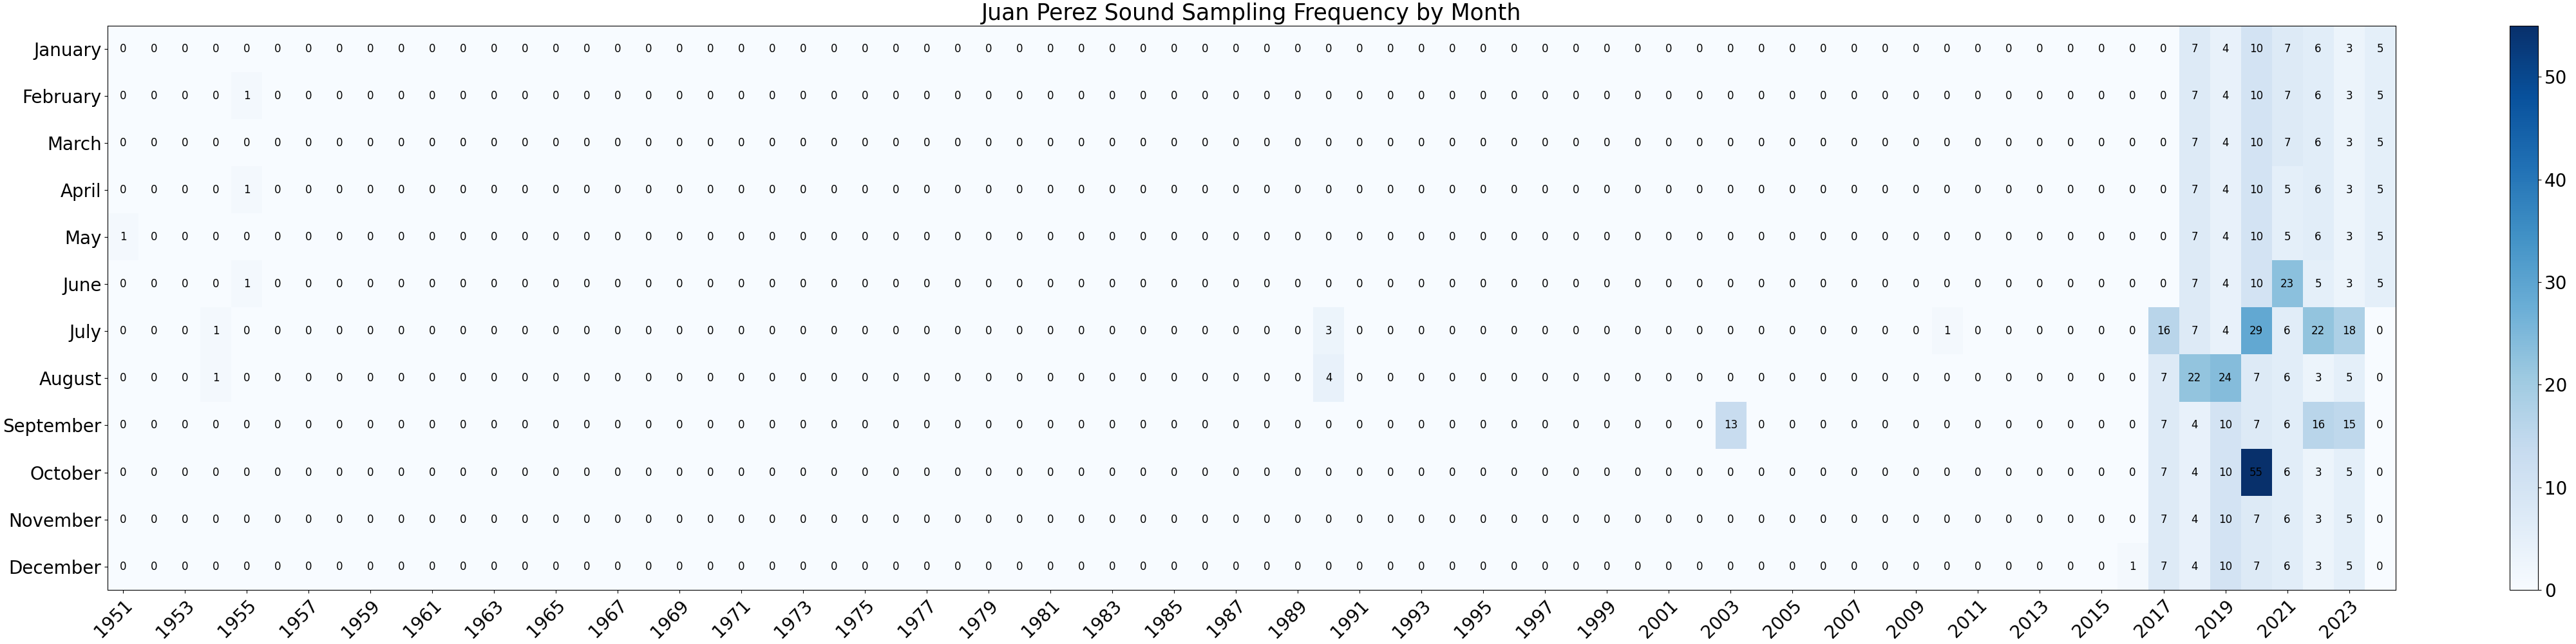
The sampling statistics of major BC inlets were investigated before constructing the time series of deep water properties to help understand the number of samples and profiles collected and sampling frequency on annual and monthly scales. The data archives of Ocean Sciences, Hakai Institute, and Ocean Networks Canada have been searched for all data holdings in the geographical area corresponding to the major inlets of the BC coast. The data holdings from individual inlets were summarized by the time in the form of 1. sampling histograms depicting the length of the time series and number of samples per year and 2. sampling heat maps display the number of samples per month.

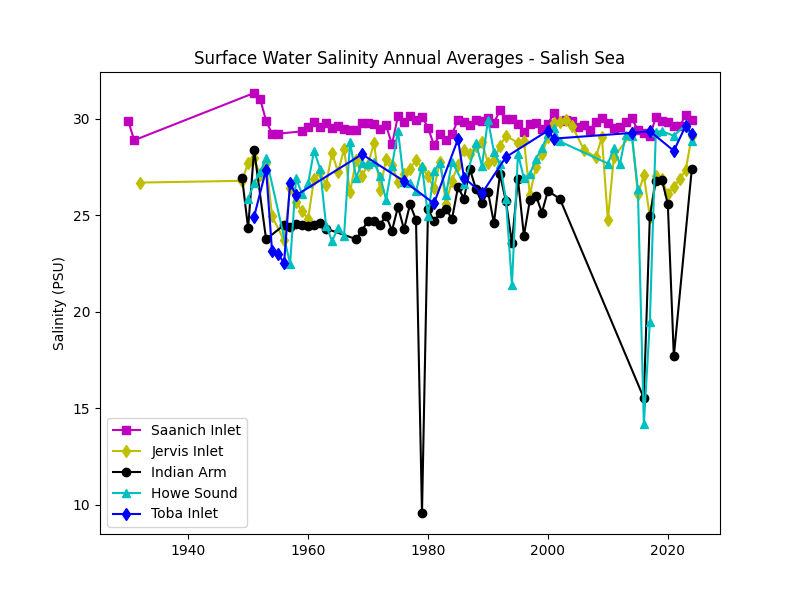

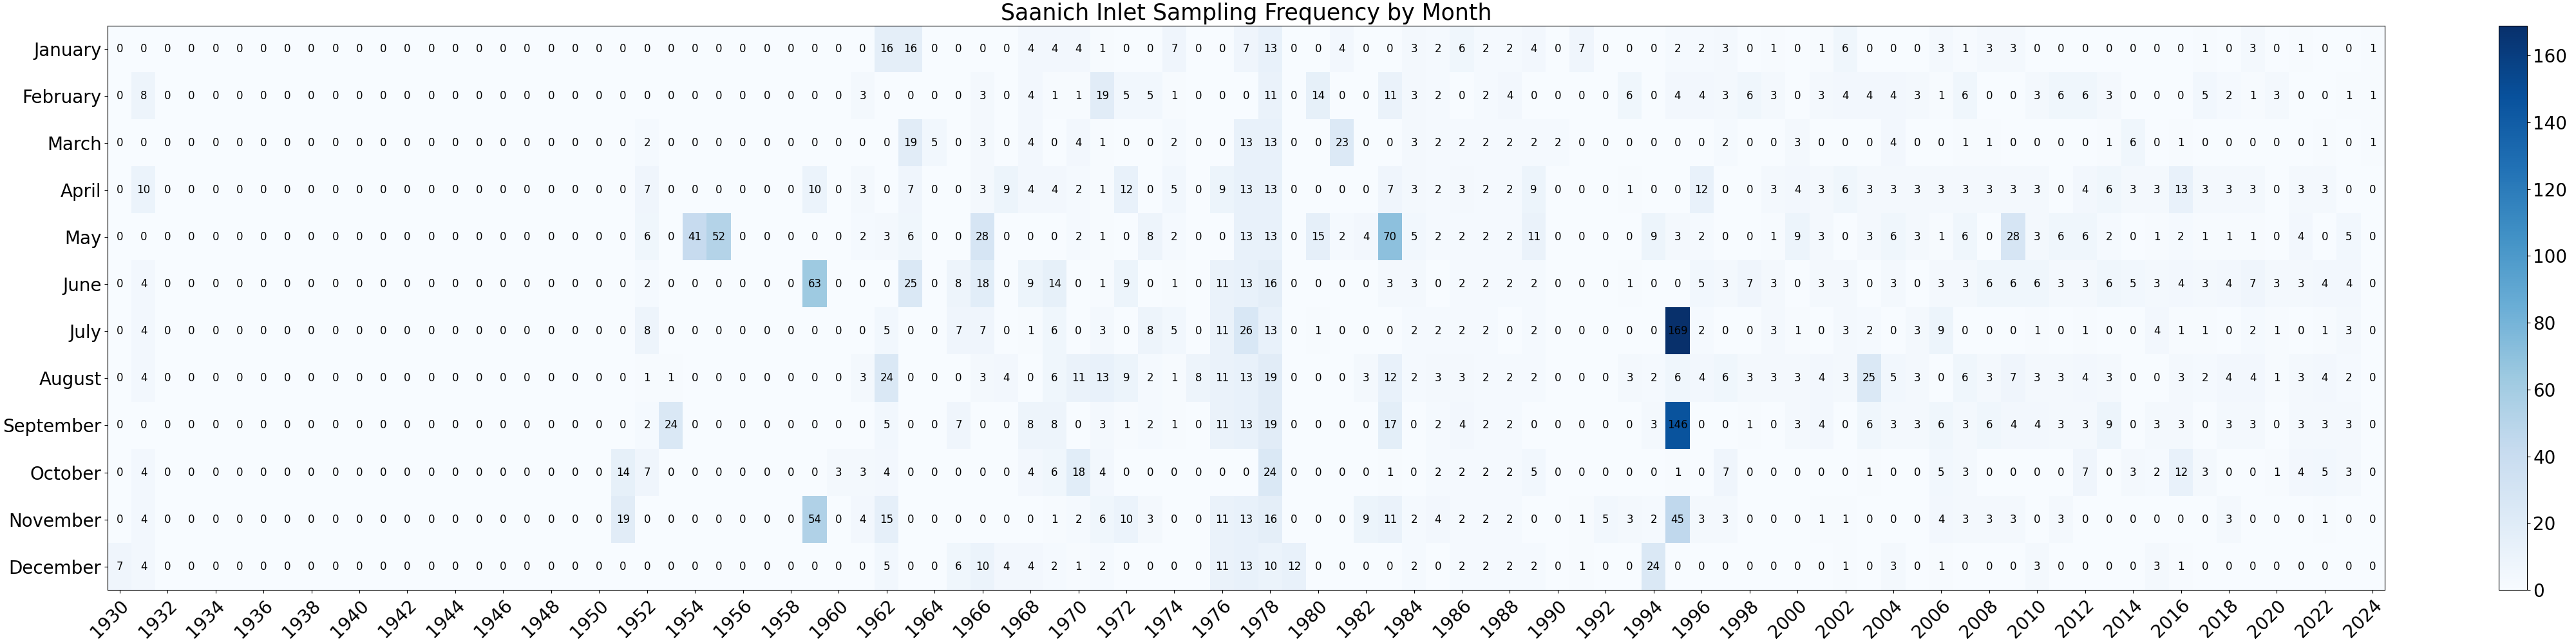


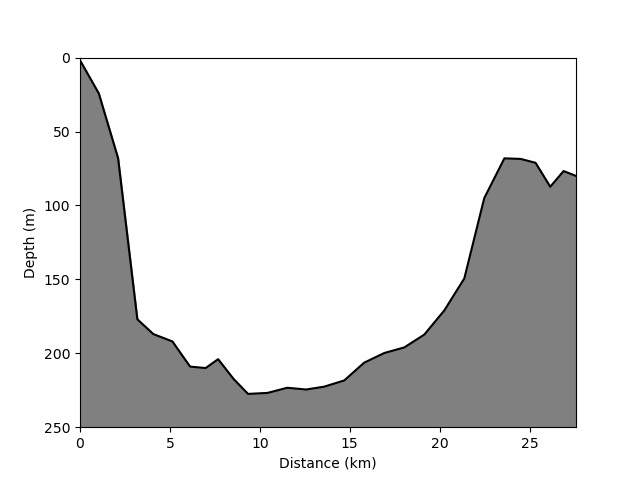
There are no major rivers discharging along the shores of Saanich Inlet as the total watershed area for Saanich Inlet is relatively small (~400 km2). The mean annual discharge for the Goldstream River and Shawnigan Creek combined is less than 3 m3 s-1 (Drinnan et al 1995). However, the Cowichan River, which discharges outside the inlet into Satellite Channel, is a significant source of freshwater (mean annual discharge ~ 50 m3 s-1) in the immediate vicinity of the inlet. The local streams and the Cowichan River have the highest flow rates in the winter months and minimum during the drier summer months. Within the Georgia Basin, the Fraser River is by far the major source of freshwater. The Fraser River flow is highly seasonal and unlike the Cowichan River its peak discharge occurs in late May and June as a result of the snowmelt in the interior of the province.
For most of the year the deep waters are devoid of dissolved oxygen or anoxic, and hydrogen sulphide (H2S) is often detected near the bottom. In the late summer and early fall, the density of waters in Haro Strait and Satellite Channel are sufficiently high that some oxygenated waters spill into the deep basin of Saanich Inlet (Anderson and Devol 1973). The amount of renewal or replacement of the inlet deep waters varies from year to year. The details of the renewal process are controlled by the neap - spring variation in tidal mixing in the energetic tidal passages outside Saanich Inlet (Stucchi and Giovando 1984). During neap tides when tidal mixing is at a minimum, dense renewal water in Haro Strait is present at or above sill depth and able to traverse Satellite Channel and arrive at the mouth of Saanich Inlet with sufficiently high density to flow into the deep waters of the inlet. During spring tides, tidal mixing is strong and the depth of the renewal water is below that of the inlet's sill depth. Immediately after a renewal, the deep waters have low but detectable amounts of dissolved oxygen, but after a few months the deep waters return to anoxic conditions.

As there were no gauged rivers in the Jervis Inlet watershed, Trites (1955) estimated the freshwater discharge using the area of the watershed (~1400 km2) and local precipitation data. The estimated mean annual discharge of 180 m3 s-1 is considerably smaller than the discharge in most of the longer BC inlets. Unlike many of the BC inlets where the main river enters at the head, there are many small rivers and streams distributed along the shores of Jervis Inlet. The runoff cycle for Jervis Inlet more closely follows the local precipitation cycle as the area of snow fields which store winter precipitation is relatively small (Macdonald and Murray 1973).
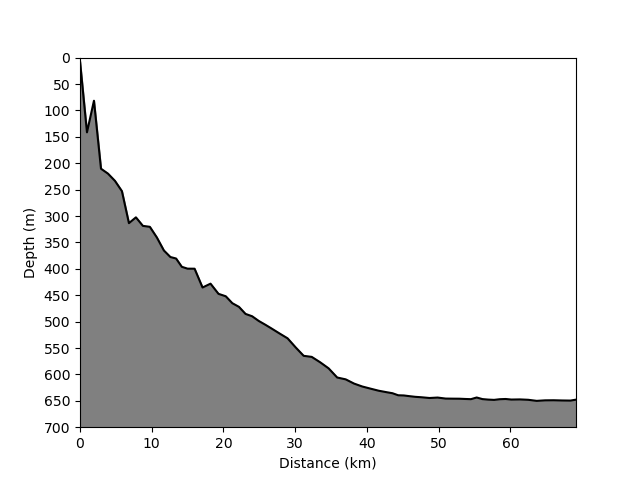
The outer and the largest basin in Jervis Inlet has a relatively deep sill at 240 m located at the mouth of the inlet where it connects with the Strait of Georgia. The deep waters of the inlet are renewed during the 3rd and 4th quarter of the year. The timing of the deep water renewal in the inlet is consistent with the summertime renewal of the deep waters of the Strait of Georgia (Thomson 1994). Dissolved oxygen concentrations provide a good indicator of the extent of the renewal with large increases in the dissolved oxygen corresponding to large influxes of the denser water from the strait. Deep water renewal occurs annually, but in some years no increase in dissolved oxygen is observed indicating that volume of renewal water was so small that one may consider it to have been a non-renewal year.
There are two main rivers that discharge into Bute Inlet, the Homathko and the Southgate, and both enter at the head of the inlet. The Homathko, the largest river, drains an interior watershed (~ 5720 km2) containing several permanent ice fields. Trites (1955) estimated the total mean annual freshwater flow into the inlet to be approximately 410 m3 s-1 of which 280 m3 s-1 is from the Homathko River. Runoff to Bute Inlet is highly seasonal, peaking in July because of snow and ice melt from the interior watershed. The lowest discharge occurs in the winter months because most of the precipitation is stored as snow in the higher elevations of the watershed.
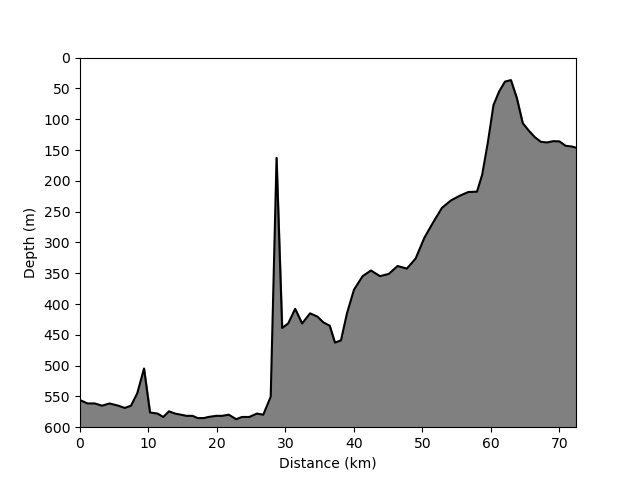
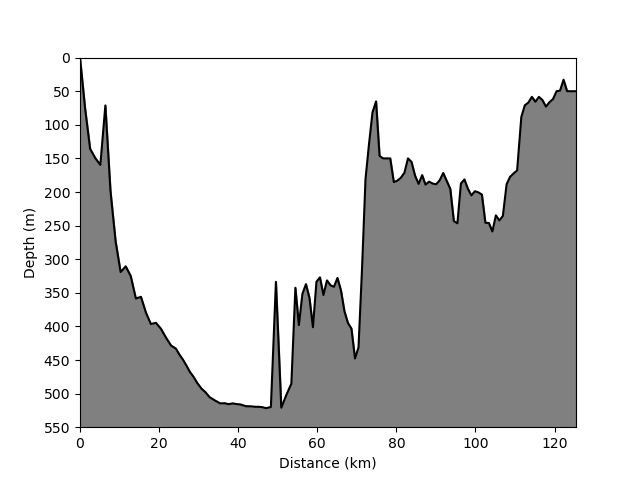
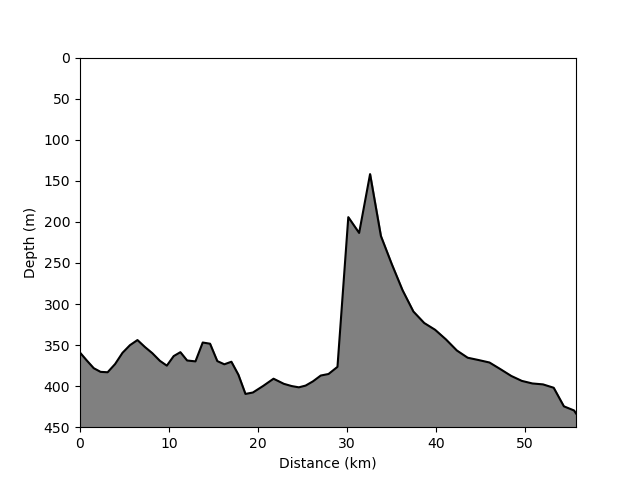
Bute Inlet is a deep inlet located amongst the narrow tidal passages at the northern end of the Strait of Georgia. The main passage for the deep waters of Bute Inlet is to the south over the very deep (370 m) sill in Calm Channel and then through Sutil Channel to the Strait of Georgia. The passages to the northern waters of Johnstone Strait and Queen Charlotte Strait are constricted and shallow. Tabata (1957) reported on the early oceanographic surveys of Bute Inlet, and later Lafond and Pickard (1975) described the deep water renewal process. Using a series of observations from 22 cruises over a two year period from 1972 to 1974 Lafond and Pickard (1975) documented several inflow events. The renewal of the deepest (>400 m) waters occurs in the 3rd and 4th quarter of the year. The timing of the renewal of Bute Inlet deep waters is supported by the observed fourth quarter maximum in salinity in Sutil Channel (Pickard 1975) and consistent with the annual deep water cycle in the Strait of Georgia.


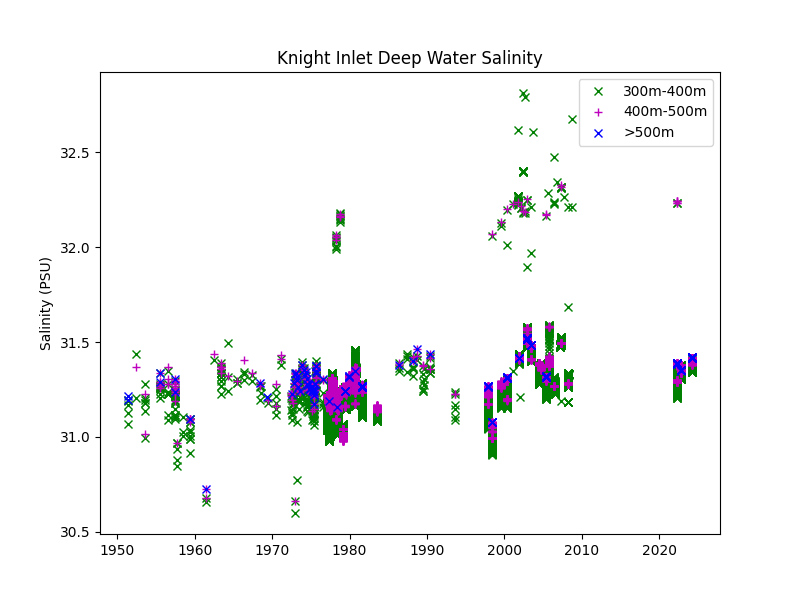
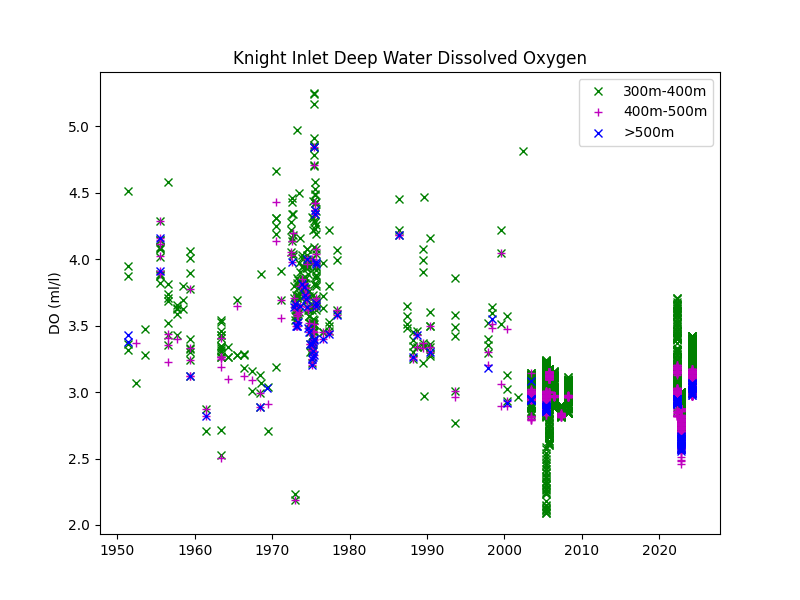
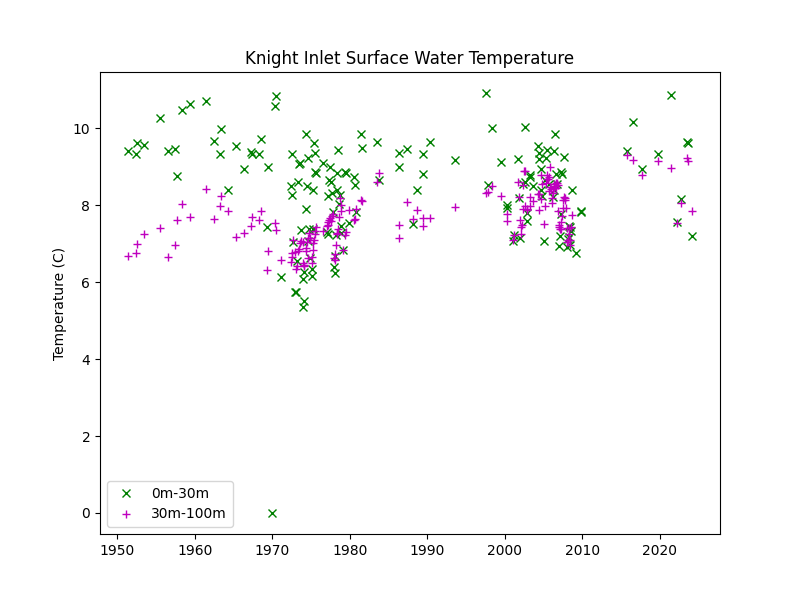
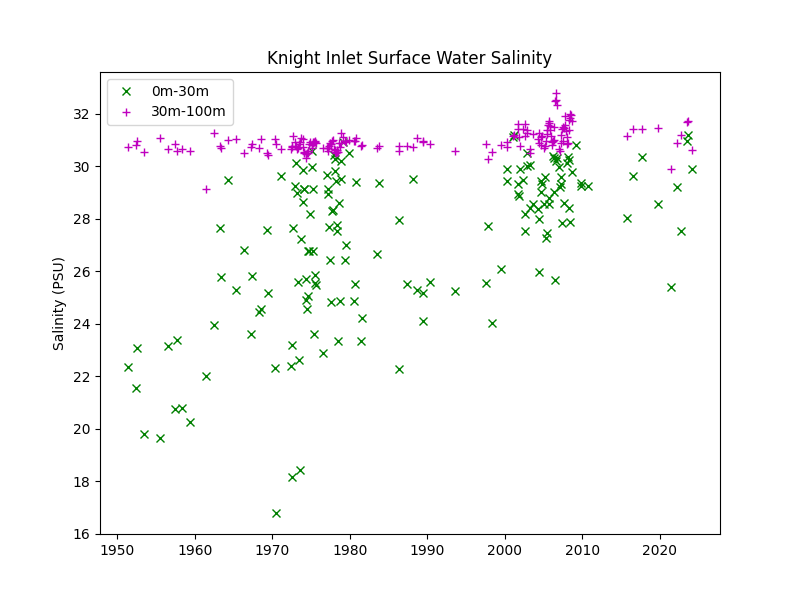
There are two main rivers that discharge into Knight Inlet, the Klinaklini and Franklin, and both enter at the head of the inlet. The Klinaklini, the largest river, drains an interior watershed (~ 5780 km2) containing several permanent ice fields. Trites (1955) estimated the total mean annual freshwater flow into the inlet to be approximately 410 m3 s-1 of which 293 m3 s-1 is from the Klinaklini River. Runoff to Knight Inlet is highly seasonal, peaking in July because of snow and ice melt from the interior watershed. The lowest discharge occurs in the winter months because most of the precipitation is stored as snow in the higher elevations of the watershed.
Knight Inlet has been the chosen location of many oceanographic studies. In particular, several studies have focused on the dynamics of the energetic stratified flow over the sill of Knight Inlet (Farmer and Smith 1980, Stacey and Pond 1992) and the implications for mixing and estuarine circulation (Freeland and Farmer 1980).
Stacey (1985) briefly describes the deep water renewal cycle in both the inner and outer basins using the observations collected during the 1977 to 1979 intensive sampling period. For the larger and deeper inner basin, the renewal of the deepest waters (300 m to the bottom) begins in early summer (May-June) and continues through to late fall (October-November). The relatively high (~3 ml/l) deep water dissolved oxygen levels indicate that renewals are frequent and that a large portion of the deep waters are exchanged.
Care must be taken when interpreting the time series of deep water temperatures and salinities as there are appreciable annual signals: ~ 0.4 °C for temperature and ~ 0.1 PSU for salinity (Pickard 1975).
Pickard (1961) lists Indian Arm as a low runoff fjord having only small rivers and streams. De Young and Pond (1988) report that the average annual freshwater flow into Indian Arm is about 42 m3 s-1 of which about half is discharged by the Buntzen power plant. The Indian River which is located at the head of the inlet is a relatively small river and contributes about 12 m3 s-1. The Seymour and Capilano Rivers are also significant sources of freshwater that discharge 15.9 m3 s-1 and 19.8 m3 s-1 respectively into Burrard Inlet. Gilmartin (1962) describes the flow of freshwater into Indian Arm as having a bimodal cycle: a late spring to early summer peak caused by melt waters and a fall to winter peak caused by direct runoff from rainfall and regulated flow from the Buntzen power plant.
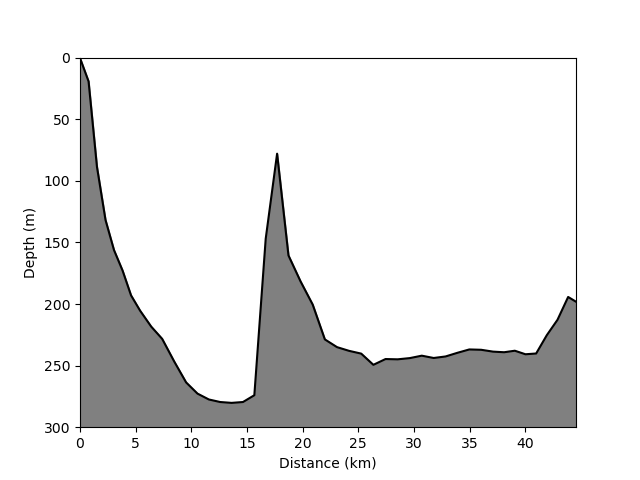
De Young and Pond (1988) have studied the deep water renewal process and describe the intrusions of denser water into Indian Arm as quasi-periodic. In the years when renewals take place, they occur late in the year coincident with the timing of the highest density at 100m depth in the Strait of Georgia. Given the long and shallow sill region in Burrard Inlet, the spring-neap variations in tidal mixing over the constricted sill control the timing of the inflows of denser waters into Indian Arm. The reduced mixing during neap tides in combination with periods of low run off permit dense waters from outside to traverse the sill in Burrard Inlet with comparatively small reduction in density. During spring tides or periods of high run off the dense water from outside is vigorously mixed and its density sufficiently reduced to prevent deep water renewal in Indian Arm.
Howe Sound is a high runoff fjord and receives more freshwater discharge than some of the longer and larger fjords (Bute and Knight). The Squamish River with an annual mean discharge of 300 m3 s-1 is the principal source of runoff to this fjord. Discharging at the head of the fjord, the Squamish River and its tributaries account for approximately two-thirds of the estimated 460 m3 s-1 total freshwater discharge to Howe Sound (Trites 1955). The watershed for the Squamish River and tributaries which totals about 3,600 km2, drains both interior snow and ice fields and lower elevation coastal regions. Like Knight and Bute inlets the maximum discharge occurs during the summer as the interior and higher elevation snow and ice fields melt. However, Howe Sound experiences a secondary and highly variable discharge maximum in the late fall because of precipitation falling mainly as rain. Minimum flows are in late winter and early spring when precipitation is mainly snow and is stored at the higher elevations.
Bell (1973) examined the deep water renewal process in Howe Sound using data collected from 1959 to 1973 and described the deep waters of Howe Sound as undergoing aperiodic renewals. Exchanges of the deepest water occur every 3 to 4 years, and the renewals occur in the winter coincident with the seasonal density maximum in the outside waters (Strait of Georgia) at sill depth. According to Bell (1973), the deepest renewals were also related to strong outflow winds (Squamish winds) associated with outbreaks of the cold air mass over the interior. Exchanges of the intermediate deep waters are more frequent and often occur in late spring and appear at times to be triggered by the Squamish River freshet.
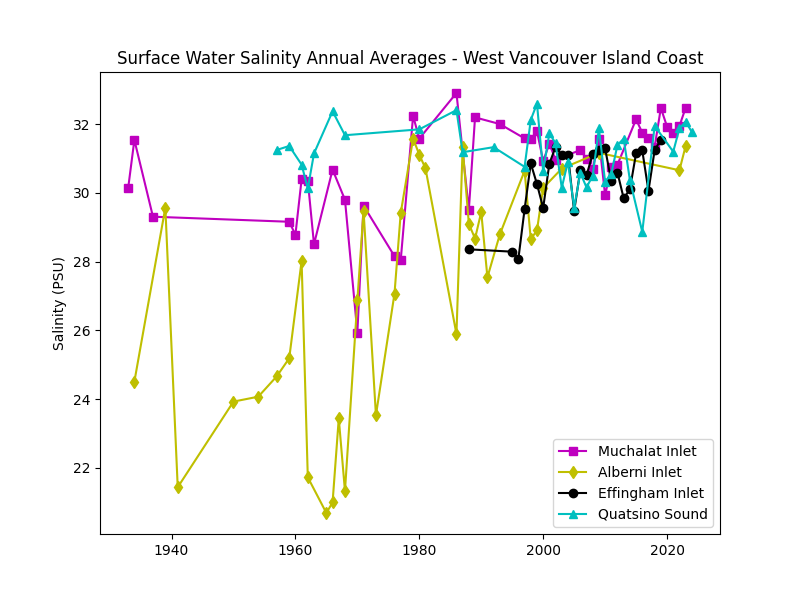
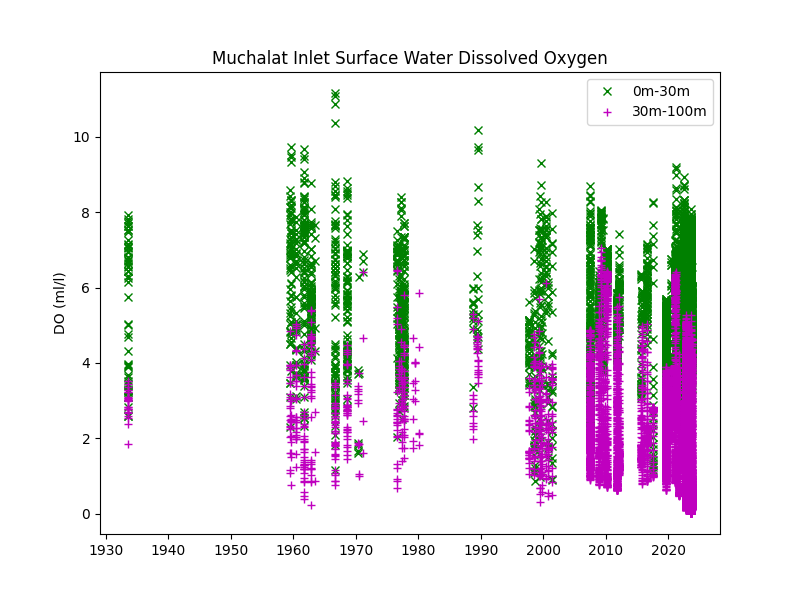
The Gold River and its tributaries drain a 1010 km2 watershed area resulting in an annual mean flow of about 90 m3 s-1. No estimates are available for the contribution of the other major streams around the inlet. As Pickard (1963) pointed out, the discharge curve for the Gold River is bimodal: there is a broad and highly variable winter maximum in discharge followed by a secondary maximum in May and June. The winter flow maximum is attributed to the seasonal precipitation maximum, and the May-June peak is attributed to melt water from the higher elevations in the water shed. The lowest flows occur in August and September when precipitation is at a seasonal low and most of the snow at higher elevations has melted."
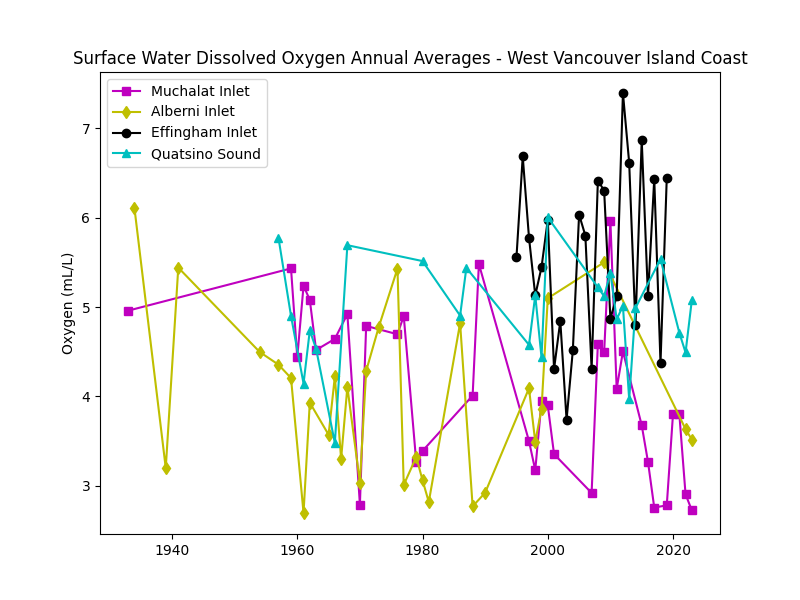
Very little attention has been given to the oceanography of this west coast inlet. There have been no publications on Muchalat Inlet apart from Tully's (1937) publication on the oceanography of Nootka Sound. Waldichuk et al (1968) monitored the water properties in the inlet because of the discharge of pulp mill waste and Pickard (1963) conducted several oceanographic cruises to the inlet. From the data that are available, the deep waters appear to be renewed in the May to September period. The dissolved oxygen content of the deep water is very low at times suggesting partial renewals or long time intervals between renewals.

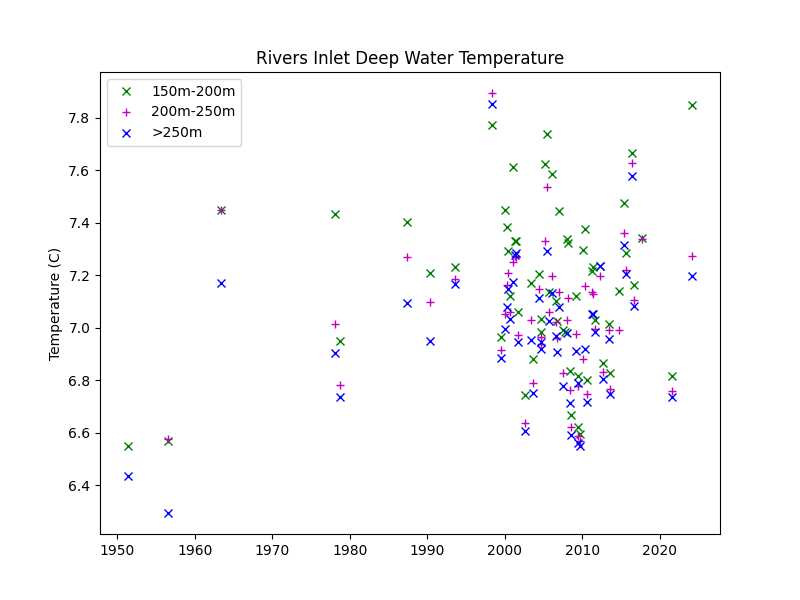
The primary source of freshwater inflow into Rivers Inlet comes from Owikeno Lake by way of the Wannock River at the head of the inlet. Owikeno Lake represents an interior watershed of about 3970 km2, representing about 65% of the total freshwater contribution to the inlet (Hodal 2010). The flow from the Wannock River represents an annual mean of about 320 m3 s-1, peaking in the spring and summer months (Hodal 2010). Contributions from Kibella Bay and the lower sources closer to the mouth are not as well studied.
Hodal (2010) provides a summary of the deep water renewal process, which happens yearly during the summer. The data used for this description is from a study performed from 2008 to 2009. The process itself is similar to Saanich Inlet and Knight Inlet (Hodal 2010).
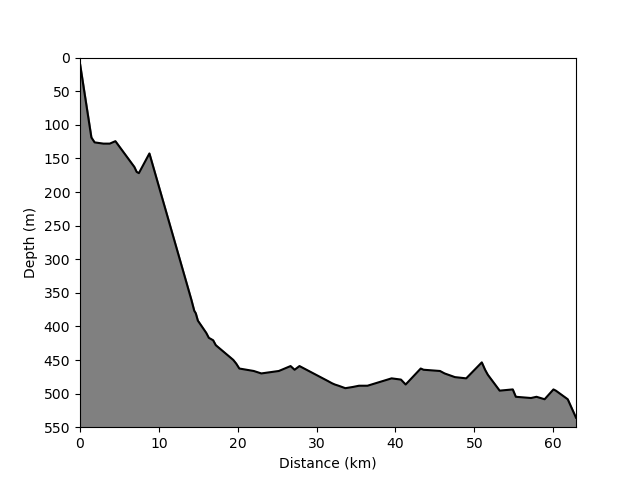
Douglas Channel recieves freshwater inflow primarlily from streams and rivers leading into it (Johannessen et al. 2015). Johannessen et al. (2015) estimate that the rainfed short rivers flowing into the channel provide more than the combined sources of the Kitimat and Kemano Rivers. The Kitimat River was measured to provide 133 m3 s-1 from July 2013 to July 2014, and the Kemano River provides 52 m3 s-1.
Johannessen et al. (2015) recorded the progression of deep water renewal up Douglas Channel over the course of mid-May into June. They found that the upwelled water does not necessarily reach the surface in this process, but may instead remain somewhere between 53 m and 127 m. This is still enough to pass over the sills present, and allow the water to replace the deepest water in the basins along the channel.